
Key Insights
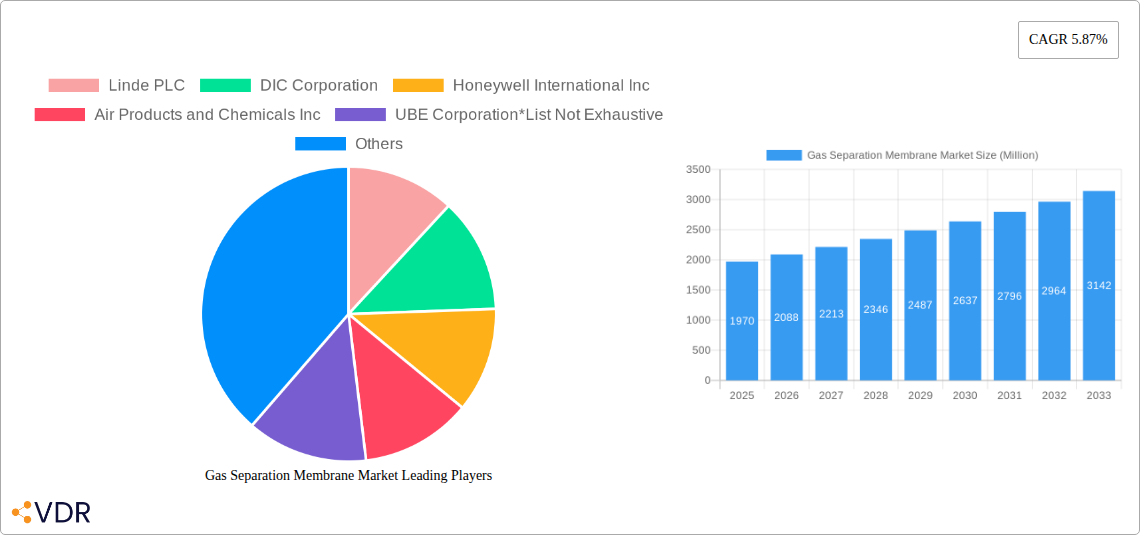
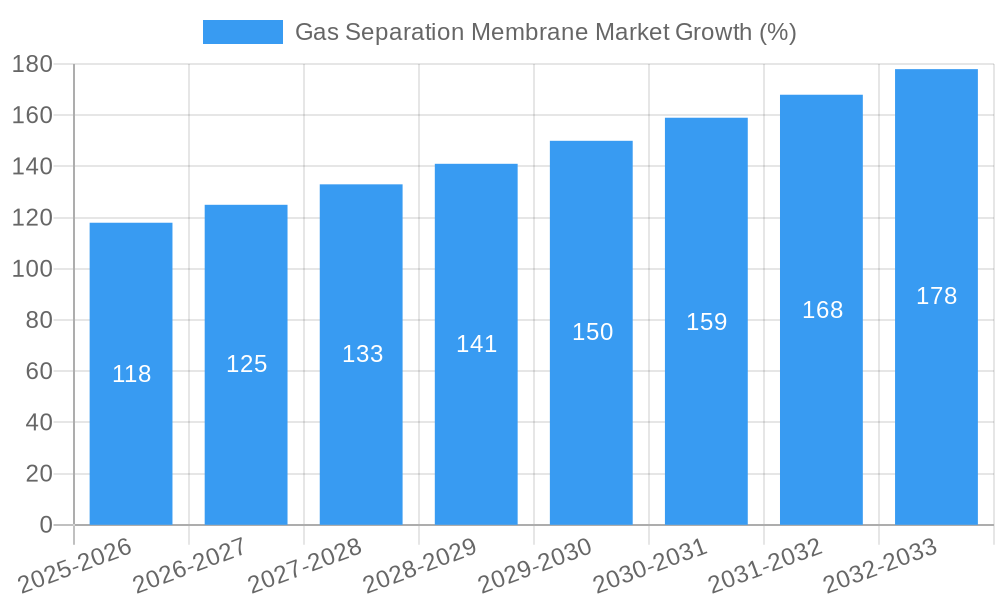
The gas separation membrane market, valued at $1.97 billion in 2025, is projected to experience robust growth, driven by increasing demand across diverse applications. The market's Compound Annual Growth Rate (CAGR) of 5.87% from 2019 to 2024 indicates a consistently expanding market, expected to continue its upward trajectory through 2033. Key drivers include the rising adoption of membrane technology in industrial gas separation due to its energy efficiency and cost-effectiveness compared to traditional methods. The increasing focus on environmental sustainability and stringent emission regulations are further boosting the demand for gas separation membranes in applications like carbon dioxide removal and hydrogen recovery. Growth is particularly strong in the Asia-Pacific region, fueled by rapid industrialization and significant investments in renewable energy infrastructure, particularly in China and India. The market is segmented by material type (polyimide and polyamide, polysulfone, cellulose acetate, and others) and application (nitrogen generation and oxygen enrichment, hydrogen recovery, carbon dioxide removal, hydrogen sulfide removal, and others). The diverse range of applications ensures sustained growth across various industries including petrochemicals, pharmaceuticals, and food processing. Competition is intense, with major players like Linde PLC, Air Products and Chemicals Inc., and others vying for market share through technological advancements and strategic partnerships.
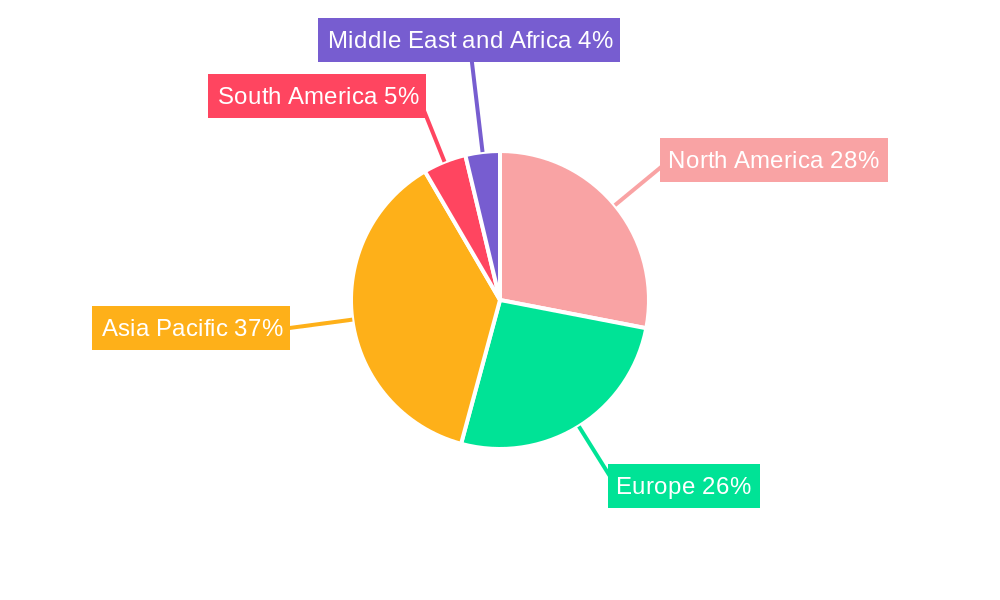
The market's segmentation reveals significant opportunities. Polyimide and polyamide membranes dominate due to their superior performance and durability. However, advancements in polysulfone and cellulose acetate membranes are expected to create new avenues for growth. The nitrogen generation and oxygen enrichment segment currently holds the largest market share, but significant growth potential exists in hydrogen recovery and carbon dioxide removal, driven by the global push for cleaner energy solutions and reduced carbon emissions. Regional variations in growth rates reflect the varying levels of industrial development and government policies supporting sustainable technologies. North America and Europe currently hold significant market shares, but Asia-Pacific is poised for the most substantial growth in the coming years due to its expanding industrial base and investments in renewable energy. Sustained innovation in membrane materials, coupled with favorable government policies and industry collaborations, will further propel the market's growth trajectory.
Gas Separation Membrane Market: A Comprehensive Market Analysis (2019-2033)
This comprehensive report provides an in-depth analysis of the Gas Separation Membrane Market, encompassing market dynamics, growth trends, regional analysis, product landscape, key players, and future outlook. The study period covers 2019-2033, with 2025 serving as the base and estimated year. This report is essential for industry professionals, investors, and anyone seeking a complete understanding of this rapidly evolving market. The market is segmented by material type (Polyimide and Polyamide, Polysulfone, Cellulose Acetate, Other Material Types) and application (Nitrogen Generation and Oxygen Enrichment, Hydrogen Recovery, Carbon Dioxide Removal, Removal of Hydrogen Sulphide, Other Applications). The parent market is the membrane separation market, with gas separation being a significant child market.
Gas Separation Membrane Market Dynamics & Structure
The Gas Separation Membrane Market is characterized by a moderately concentrated structure, with key players like Linde PLC, DIC Corporation, and Honeywell International Inc. holding significant market share. Technological innovation, particularly in material science and membrane design, is a primary growth driver. Stringent environmental regulations, particularly concerning carbon emissions, are further boosting demand. Competitive substitutes include traditional gas separation technologies like cryogenic distillation, but membrane-based solutions are increasingly favored for their efficiency and cost-effectiveness. End-user demographics are diverse, spanning various industries including energy, chemicals, and healthcare. M&A activity remains moderate, with a focus on expanding production capacity and acquiring specialized technologies. The market exhibited a xx Million units market size in 2024, and is expected to reach xx Million units by 2033.
- Market Concentration: Moderately concentrated, with top 5 players holding approximately xx% market share.
- Technological Innovation: Focus on improving membrane selectivity, permeability, and durability.
- Regulatory Frameworks: Stringent environmental regulations driving demand for CO2 capture solutions.
- Competitive Substitutes: Traditional gas separation technologies like cryogenic distillation.
- M&A Trends: Moderate activity, focused on capacity expansion and technological acquisitions. Approximately xx M&A deals occurred between 2019 and 2024.
Gas Separation Membrane Market Growth Trends & Insights
The Gas Separation Membrane Market is experiencing robust growth, driven by increasing demand for high-purity gases across various industries. The market witnessed a CAGR of xx% during the historical period (2019-2024) and is projected to maintain a CAGR of xx% during the forecast period (2025-2033). This growth is attributed to factors such as the rising adoption of gas separation membranes in energy-efficient processes, technological advancements leading to improved membrane performance, and government incentives promoting clean energy technologies. The market penetration rate for gas separation membranes in key applications is steadily increasing, reaching xx% in 2024 and projected to reach xx% by 2033. Technological disruptions, such as the development of advanced membrane materials, are further accelerating market expansion. Consumer behavior shifts towards sustainable practices are also fueling demand for environmentally friendly gas separation solutions. The market size is projected to grow from xx Million units in 2025 to xx Million units by 2033.
Dominant Regions, Countries, or Segments in Gas Separation Membrane Market
North America and Asia Pacific currently dominate the Gas Separation Membrane Market, driven by strong industrial activity and supportive government policies. Within these regions, countries like the U.S., China, and Japan are leading the market. In terms of segments, the Polyimide and Polyamide material type holds the largest market share due to its superior performance characteristics, followed by Polysulfone. The Nitrogen Generation and Oxygen Enrichment application segment exhibits the highest growth potential, propelled by increased demand for industrial gases and medical applications.
- Key Drivers (North America): Strong industrial base, technological advancements, government support for clean energy.
- Key Drivers (Asia Pacific): Rapid industrialization, increasing energy demand, rising environmental concerns.
- Dominant Material Type: Polyimide and Polyamide (xx% market share in 2025).
- Dominant Application: Nitrogen Generation and Oxygen Enrichment (xx% market share in 2025).
- Growth Potential: Hydrogen Recovery and Carbon Dioxide Removal applications are projected for significant growth.
Gas Separation Membrane Market Product Landscape
The Gas Separation Membrane Market offers a diverse range of products, including hollow fiber membranes, spiral wound membranes, and flat sheet membranes, each catering to specific applications. Continuous innovation focuses on enhancing membrane selectivity, permeability, and resistance to fouling. Key selling propositions include improved energy efficiency, reduced operating costs, and compact system designs. Recent advancements include the development of advanced materials like mixed matrix membranes and zwitterionic membranes, offering superior performance characteristics.
Key Drivers, Barriers & Challenges in Gas Separation Membrane Market
Key Drivers: Increasing demand for high-purity gases across various industries; stringent environmental regulations; technological advancements leading to improved membrane performance; government incentives promoting clean energy technologies. The significant decline in energy cost associated with membrane technologies is further pushing the market.
Key Challenges: High initial investment costs for membrane systems; potential membrane fouling and lifespan limitations; competition from traditional gas separation technologies; supply chain disruptions impacting raw material availability. The xx% increase in raw material prices in 2024 is a significant factor contributing to higher costs.
Emerging Opportunities in Gas Separation Membrane Market
Emerging opportunities lie in the development of next-generation membrane materials with enhanced performance characteristics; expansion into new applications such as biogas upgrading and natural gas processing; and the development of innovative membrane-based solutions for carbon capture, utilization, and storage (CCUS). Untapped markets in developing economies also present significant growth potential.
Growth Accelerators in the Gas Separation Membrane Market Industry
Long-term growth in the Gas Separation Membrane Market will be accelerated by ongoing R&D efforts leading to more efficient and cost-effective membranes; strategic partnerships between membrane manufacturers and end-users; and the expansion of market applications into emerging sectors such as hydrogen production and renewable energy. Government policies promoting clean energy technologies will also play a significant role.
Key Players Shaping the Gas Separation Membrane Market Market
- Linde PLC
- DIC Corporation
- Honeywell International Inc
- Air Products and Chemicals Inc
- UBE Corporation
- Toray Industries Inc
- SLB (schlumberger)
- Evonik Industries AG
- Fujifilm Corporation
- Air Liquide Advanced Separations
- Generon
- Parker Hannifin Corp
- Membrane Technology and Research Inc
Notable Milestones in Gas Separation Membrane Market Sector
- January 2023: UBE Corporation announced the expansion of its polyimide hollow fiber and gas separation membrane module production facilities, increasing production capacity by about 1.8 times by the first half of fiscal 2025. This expansion directly addresses the growing demand for CO2 separation membranes.
- January 2022: Toray Industries, Inc. developed a new polymeric separation membrane module that significantly improves hydrogen purification efficiency, more than halving carbon dioxide emissions and the number of modules needed.
In-Depth Gas Separation Membrane Market Outlook
The Gas Separation Membrane Market is poised for significant growth in the coming years, driven by a confluence of factors including increasing demand for high-purity gases, technological advancements leading to superior membrane performance, and supportive government policies promoting clean energy technologies. Strategic partnerships and market expansion into new applications, particularly in emerging economies, will further propel market growth. The long-term outlook for this market remains highly positive, presenting significant opportunities for both established players and new entrants.
Gas Separation Membrane Market Segmentation
-
1. Material Type
- 1.1. Polyimide and Polyamide
- 1.2. Polysulfone
- 1.3. Cellulose Acetate
- 1.4. Other Material Types (Nanostructured Membrane)
-
2. Application
- 2.1. Nitrogen Generation and Oxygen Enrichment
- 2.2. Hydrogen Recovery
- 2.3. Carbon Dioxide Removal
- 2.4. Removal of Hydrogen Sulphide
- 2.5. Other Applications (Carbonation)
Gas Separation Membrane Market Segmentation By Geography
-
1. Asia Pacific
- 1.1. China
- 1.2. India
- 1.3. Japan
- 1.4. South Korea
- 1.5. Malaysia
- 1.6. Thailand
- 1.7. Indonesia
- 1.8. Vietnam
- 1.9. Rest of Asia Pacific
-
2. North America
- 2.1. United States
- 2.2. Canada
- 2.3. Mexico
-
3. Europe
- 3.1. Germany
- 3.2. United Kingdom
- 3.3. Italy
- 3.4. France
- 3.5. Spain
- 3.6. Turkey
- 3.7. Russia
- 3.8. NORDIC
- 3.9. Rest of Europe
-
4. South America
- 4.1. Brazil
- 4.2. Argentina
- 4.3. Colombia
- 4.4. Rest of South America
-
5. Middle East and Africa
- 5.1. Saudi Arabia
- 5.2. South Africa
- 5.3. Nigeria
- 5.4. Qatar
- 5.5. Egypt
- 5.6. UAE
- 5.7. Rest of Middle East and Africa
Gas Separation Membrane Market REPORT HIGHLIGHTS
| Aspects | Details |
|---|---|
| Study Period | 2019-2033 |
| Base Year | 2024 |
| Estimated Year | 2025 |
| Forecast Period | 2025-2033 |
| Historical Period | 2019-2024 |
| Growth Rate | CAGR of 5.87% from 2019-2033 |
| Segmentation |
|
Table of Contents
- 1. Introduction
- 1.1. Research Scope
- 1.2. Market Segmentation
- 1.3. Research Methodology
- 1.4. Definitions and Assumptions
- 2. Executive Summary
- 2.1. Introduction
- 3. Market Dynamics
- 3.1. Introduction
- 3.2. Market Drivers
- 3.2.1. Increasing Demand for Membranes in Carbon Dioxide Separation Processes; Strict Government Norms Toward GHG Emissions
- 3.3. Market Restrains
- 3.3.1. Plasticization of Polymeric Membranes in High-Temperature Applications; Upscaling and Adoption of New Membranes
- 3.4. Market Trends
- 3.4.1. Nitrogen Generation and Oxygen Enrichment Application to Dominate the Market
- 4. Market Factor Analysis
- 4.1. Porters Five Forces
- 4.2. Supply/Value Chain
- 4.3. PESTEL analysis
- 4.4. Market Entropy
- 4.5. Patent/Trademark Analysis
- 5. Global Gas Separation Membrane Market Analysis, Insights and Forecast, 2019-2031
- 5.1. Market Analysis, Insights and Forecast - by Material Type
- 5.1.1. Polyimide and Polyamide
- 5.1.2. Polysulfone
- 5.1.3. Cellulose Acetate
- 5.1.4. Other Material Types (Nanostructured Membrane)
- 5.2. Market Analysis, Insights and Forecast - by Application
- 5.2.1. Nitrogen Generation and Oxygen Enrichment
- 5.2.2. Hydrogen Recovery
- 5.2.3. Carbon Dioxide Removal
- 5.2.4. Removal of Hydrogen Sulphide
- 5.2.5. Other Applications (Carbonation)
- 5.3. Market Analysis, Insights and Forecast - by Region
- 5.3.1. Asia Pacific
- 5.3.2. North America
- 5.3.3. Europe
- 5.3.4. South America
- 5.3.5. Middle East and Africa
- 5.1. Market Analysis, Insights and Forecast - by Material Type
- 6. Asia Pacific Gas Separation Membrane Market Analysis, Insights and Forecast, 2019-2031
- 6.1. Market Analysis, Insights and Forecast - by Material Type
- 6.1.1. Polyimide and Polyamide
- 6.1.2. Polysulfone
- 6.1.3. Cellulose Acetate
- 6.1.4. Other Material Types (Nanostructured Membrane)
- 6.2. Market Analysis, Insights and Forecast - by Application
- 6.2.1. Nitrogen Generation and Oxygen Enrichment
- 6.2.2. Hydrogen Recovery
- 6.2.3. Carbon Dioxide Removal
- 6.2.4. Removal of Hydrogen Sulphide
- 6.2.5. Other Applications (Carbonation)
- 6.1. Market Analysis, Insights and Forecast - by Material Type
- 7. North America Gas Separation Membrane Market Analysis, Insights and Forecast, 2019-2031
- 7.1. Market Analysis, Insights and Forecast - by Material Type
- 7.1.1. Polyimide and Polyamide
- 7.1.2. Polysulfone
- 7.1.3. Cellulose Acetate
- 7.1.4. Other Material Types (Nanostructured Membrane)
- 7.2. Market Analysis, Insights and Forecast - by Application
- 7.2.1. Nitrogen Generation and Oxygen Enrichment
- 7.2.2. Hydrogen Recovery
- 7.2.3. Carbon Dioxide Removal
- 7.2.4. Removal of Hydrogen Sulphide
- 7.2.5. Other Applications (Carbonation)
- 7.1. Market Analysis, Insights and Forecast - by Material Type
- 8. Europe Gas Separation Membrane Market Analysis, Insights and Forecast, 2019-2031
- 8.1. Market Analysis, Insights and Forecast - by Material Type
- 8.1.1. Polyimide and Polyamide
- 8.1.2. Polysulfone
- 8.1.3. Cellulose Acetate
- 8.1.4. Other Material Types (Nanostructured Membrane)
- 8.2. Market Analysis, Insights and Forecast - by Application
- 8.2.1. Nitrogen Generation and Oxygen Enrichment
- 8.2.2. Hydrogen Recovery
- 8.2.3. Carbon Dioxide Removal
- 8.2.4. Removal of Hydrogen Sulphide
- 8.2.5. Other Applications (Carbonation)
- 8.1. Market Analysis, Insights and Forecast - by Material Type
- 9. South America Gas Separation Membrane Market Analysis, Insights and Forecast, 2019-2031
- 9.1. Market Analysis, Insights and Forecast - by Material Type
- 9.1.1. Polyimide and Polyamide
- 9.1.2. Polysulfone
- 9.1.3. Cellulose Acetate
- 9.1.4. Other Material Types (Nanostructured Membrane)
- 9.2. Market Analysis, Insights and Forecast - by Application
- 9.2.1. Nitrogen Generation and Oxygen Enrichment
- 9.2.2. Hydrogen Recovery
- 9.2.3. Carbon Dioxide Removal
- 9.2.4. Removal of Hydrogen Sulphide
- 9.2.5. Other Applications (Carbonation)
- 9.1. Market Analysis, Insights and Forecast - by Material Type
- 10. Middle East and Africa Gas Separation Membrane Market Analysis, Insights and Forecast, 2019-2031
- 10.1. Market Analysis, Insights and Forecast - by Material Type
- 10.1.1. Polyimide and Polyamide
- 10.1.2. Polysulfone
- 10.1.3. Cellulose Acetate
- 10.1.4. Other Material Types (Nanostructured Membrane)
- 10.2. Market Analysis, Insights and Forecast - by Application
- 10.2.1. Nitrogen Generation and Oxygen Enrichment
- 10.2.2. Hydrogen Recovery
- 10.2.3. Carbon Dioxide Removal
- 10.2.4. Removal of Hydrogen Sulphide
- 10.2.5. Other Applications (Carbonation)
- 10.1. Market Analysis, Insights and Forecast - by Material Type
- 11. Asia Pacific Gas Separation Membrane Market Analysis, Insights and Forecast, 2019-2031
- 11.1. Market Analysis, Insights and Forecast - By Country/Sub-region
- 11.1.1 China
- 11.1.2 India
- 11.1.3 Japan
- 11.1.4 South Korea
- 11.1.5 Rest of Asia Pacific
- 12. North America Gas Separation Membrane Market Analysis, Insights and Forecast, 2019-2031
- 12.1. Market Analysis, Insights and Forecast - By Country/Sub-region
- 12.1.1 United States
- 12.1.2 Canada
- 12.1.3 Mexico
- 13. Europe Gas Separation Membrane Market Analysis, Insights and Forecast, 2019-2031
- 13.1. Market Analysis, Insights and Forecast - By Country/Sub-region
- 13.1.1 Germany
- 13.1.2 United Kingdom
- 13.1.3 Italy
- 13.1.4 France
- 13.1.5 Rest of Europe
- 14. South America Gas Separation Membrane Market Analysis, Insights and Forecast, 2019-2031
- 14.1. Market Analysis, Insights and Forecast - By Country/Sub-region
- 14.1.1 Brazil
- 14.1.2 Argentina
- 14.1.3 Rest of South America
- 15. Middle East and Africa Gas Separation Membrane Market Analysis, Insights and Forecast, 2019-2031
- 15.1. Market Analysis, Insights and Forecast - By Country/Sub-region
- 15.1.1 Saudi Arabia
- 15.1.2 South Africa
- 15.1.3 Rest of Middle East and Africa
- 16. Competitive Analysis
- 16.1. Global Market Share Analysis 2024
- 16.2. Company Profiles
- 16.2.1 Linde PLC
- 16.2.1.1. Overview
- 16.2.1.2. Products
- 16.2.1.3. SWOT Analysis
- 16.2.1.4. Recent Developments
- 16.2.1.5. Financials (Based on Availability)
- 16.2.2 DIC Corporation
- 16.2.2.1. Overview
- 16.2.2.2. Products
- 16.2.2.3. SWOT Analysis
- 16.2.2.4. Recent Developments
- 16.2.2.5. Financials (Based on Availability)
- 16.2.3 Honeywell International Inc
- 16.2.3.1. Overview
- 16.2.3.2. Products
- 16.2.3.3. SWOT Analysis
- 16.2.3.4. Recent Developments
- 16.2.3.5. Financials (Based on Availability)
- 16.2.4 Air Products and Chemicals Inc
- 16.2.4.1. Overview
- 16.2.4.2. Products
- 16.2.4.3. SWOT Analysis
- 16.2.4.4. Recent Developments
- 16.2.4.5. Financials (Based on Availability)
- 16.2.5 UBE Corporation*List Not Exhaustive
- 16.2.5.1. Overview
- 16.2.5.2. Products
- 16.2.5.3. SWOT Analysis
- 16.2.5.4. Recent Developments
- 16.2.5.5. Financials (Based on Availability)
- 16.2.6 Toray Industries Inc
- 16.2.6.1. Overview
- 16.2.6.2. Products
- 16.2.6.3. SWOT Analysis
- 16.2.6.4. Recent Developments
- 16.2.6.5. Financials (Based on Availability)
- 16.2.7 SLB (schlumberger)
- 16.2.7.1. Overview
- 16.2.7.2. Products
- 16.2.7.3. SWOT Analysis
- 16.2.7.4. Recent Developments
- 16.2.7.5. Financials (Based on Availability)
- 16.2.8 Evonik Industries AG
- 16.2.8.1. Overview
- 16.2.8.2. Products
- 16.2.8.3. SWOT Analysis
- 16.2.8.4. Recent Developments
- 16.2.8.5. Financials (Based on Availability)
- 16.2.9 Fujifilm Corporation
- 16.2.9.1. Overview
- 16.2.9.2. Products
- 16.2.9.3. SWOT Analysis
- 16.2.9.4. Recent Developments
- 16.2.9.5. Financials (Based on Availability)
- 16.2.10 Air Liquide Advanced Separations
- 16.2.10.1. Overview
- 16.2.10.2. Products
- 16.2.10.3. SWOT Analysis
- 16.2.10.4. Recent Developments
- 16.2.10.5. Financials (Based on Availability)
- 16.2.11 Generon
- 16.2.11.1. Overview
- 16.2.11.2. Products
- 16.2.11.3. SWOT Analysis
- 16.2.11.4. Recent Developments
- 16.2.11.5. Financials (Based on Availability)
- 16.2.12 Parker Hannifin Corp
- 16.2.12.1. Overview
- 16.2.12.2. Products
- 16.2.12.3. SWOT Analysis
- 16.2.12.4. Recent Developments
- 16.2.12.5. Financials (Based on Availability)
- 16.2.13 Membrane Technology and Research Inc
- 16.2.13.1. Overview
- 16.2.13.2. Products
- 16.2.13.3. SWOT Analysis
- 16.2.13.4. Recent Developments
- 16.2.13.5. Financials (Based on Availability)
- 16.2.1 Linde PLC
List of Figures
- Figure 1: Global Gas Separation Membrane Market Revenue Breakdown (Million, %) by Region 2024 & 2032
- Figure 2: Global Gas Separation Membrane Market Volume Breakdown (K Tons, %) by Region 2024 & 2032
- Figure 3: Asia Pacific Gas Separation Membrane Market Revenue (Million), by Country 2024 & 2032
- Figure 4: Asia Pacific Gas Separation Membrane Market Volume (K Tons), by Country 2024 & 2032
- Figure 5: Asia Pacific Gas Separation Membrane Market Revenue Share (%), by Country 2024 & 2032
- Figure 6: Asia Pacific Gas Separation Membrane Market Volume Share (%), by Country 2024 & 2032
- Figure 7: North America Gas Separation Membrane Market Revenue (Million), by Country 2024 & 2032
- Figure 8: North America Gas Separation Membrane Market Volume (K Tons), by Country 2024 & 2032
- Figure 9: North America Gas Separation Membrane Market Revenue Share (%), by Country 2024 & 2032
- Figure 10: North America Gas Separation Membrane Market Volume Share (%), by Country 2024 & 2032
- Figure 11: Europe Gas Separation Membrane Market Revenue (Million), by Country 2024 & 2032
- Figure 12: Europe Gas Separation Membrane Market Volume (K Tons), by Country 2024 & 2032
- Figure 13: Europe Gas Separation Membrane Market Revenue Share (%), by Country 2024 & 2032
- Figure 14: Europe Gas Separation Membrane Market Volume Share (%), by Country 2024 & 2032
- Figure 15: South America Gas Separation Membrane Market Revenue (Million), by Country 2024 & 2032
- Figure 16: South America Gas Separation Membrane Market Volume (K Tons), by Country 2024 & 2032
- Figure 17: South America Gas Separation Membrane Market Revenue Share (%), by Country 2024 & 2032
- Figure 18: South America Gas Separation Membrane Market Volume Share (%), by Country 2024 & 2032
- Figure 19: Middle East and Africa Gas Separation Membrane Market Revenue (Million), by Country 2024 & 2032
- Figure 20: Middle East and Africa Gas Separation Membrane Market Volume (K Tons), by Country 2024 & 2032
- Figure 21: Middle East and Africa Gas Separation Membrane Market Revenue Share (%), by Country 2024 & 2032
- Figure 22: Middle East and Africa Gas Separation Membrane Market Volume Share (%), by Country 2024 & 2032
- Figure 23: Asia Pacific Gas Separation Membrane Market Revenue (Million), by Material Type 2024 & 2032
- Figure 24: Asia Pacific Gas Separation Membrane Market Volume (K Tons), by Material Type 2024 & 2032
- Figure 25: Asia Pacific Gas Separation Membrane Market Revenue Share (%), by Material Type 2024 & 2032
- Figure 26: Asia Pacific Gas Separation Membrane Market Volume Share (%), by Material Type 2024 & 2032
- Figure 27: Asia Pacific Gas Separation Membrane Market Revenue (Million), by Application 2024 & 2032
- Figure 28: Asia Pacific Gas Separation Membrane Market Volume (K Tons), by Application 2024 & 2032
- Figure 29: Asia Pacific Gas Separation Membrane Market Revenue Share (%), by Application 2024 & 2032
- Figure 30: Asia Pacific Gas Separation Membrane Market Volume Share (%), by Application 2024 & 2032
- Figure 31: Asia Pacific Gas Separation Membrane Market Revenue (Million), by Country 2024 & 2032
- Figure 32: Asia Pacific Gas Separation Membrane Market Volume (K Tons), by Country 2024 & 2032
- Figure 33: Asia Pacific Gas Separation Membrane Market Revenue Share (%), by Country 2024 & 2032
- Figure 34: Asia Pacific Gas Separation Membrane Market Volume Share (%), by Country 2024 & 2032
- Figure 35: North America Gas Separation Membrane Market Revenue (Million), by Material Type 2024 & 2032
- Figure 36: North America Gas Separation Membrane Market Volume (K Tons), by Material Type 2024 & 2032
- Figure 37: North America Gas Separation Membrane Market Revenue Share (%), by Material Type 2024 & 2032
- Figure 38: North America Gas Separation Membrane Market Volume Share (%), by Material Type 2024 & 2032
- Figure 39: North America Gas Separation Membrane Market Revenue (Million), by Application 2024 & 2032
- Figure 40: North America Gas Separation Membrane Market Volume (K Tons), by Application 2024 & 2032
- Figure 41: North America Gas Separation Membrane Market Revenue Share (%), by Application 2024 & 2032
- Figure 42: North America Gas Separation Membrane Market Volume Share (%), by Application 2024 & 2032
- Figure 43: North America Gas Separation Membrane Market Revenue (Million), by Country 2024 & 2032
- Figure 44: North America Gas Separation Membrane Market Volume (K Tons), by Country 2024 & 2032
- Figure 45: North America Gas Separation Membrane Market Revenue Share (%), by Country 2024 & 2032
- Figure 46: North America Gas Separation Membrane Market Volume Share (%), by Country 2024 & 2032
- Figure 47: Europe Gas Separation Membrane Market Revenue (Million), by Material Type 2024 & 2032
- Figure 48: Europe Gas Separation Membrane Market Volume (K Tons), by Material Type 2024 & 2032
- Figure 49: Europe Gas Separation Membrane Market Revenue Share (%), by Material Type 2024 & 2032
- Figure 50: Europe Gas Separation Membrane Market Volume Share (%), by Material Type 2024 & 2032
- Figure 51: Europe Gas Separation Membrane Market Revenue (Million), by Application 2024 & 2032
- Figure 52: Europe Gas Separation Membrane Market Volume (K Tons), by Application 2024 & 2032
- Figure 53: Europe Gas Separation Membrane Market Revenue Share (%), by Application 2024 & 2032
- Figure 54: Europe Gas Separation Membrane Market Volume Share (%), by Application 2024 & 2032
- Figure 55: Europe Gas Separation Membrane Market Revenue (Million), by Country 2024 & 2032
- Figure 56: Europe Gas Separation Membrane Market Volume (K Tons), by Country 2024 & 2032
- Figure 57: Europe Gas Separation Membrane Market Revenue Share (%), by Country 2024 & 2032
- Figure 58: Europe Gas Separation Membrane Market Volume Share (%), by Country 2024 & 2032
- Figure 59: South America Gas Separation Membrane Market Revenue (Million), by Material Type 2024 & 2032
- Figure 60: South America Gas Separation Membrane Market Volume (K Tons), by Material Type 2024 & 2032
- Figure 61: South America Gas Separation Membrane Market Revenue Share (%), by Material Type 2024 & 2032
- Figure 62: South America Gas Separation Membrane Market Volume Share (%), by Material Type 2024 & 2032
- Figure 63: South America Gas Separation Membrane Market Revenue (Million), by Application 2024 & 2032
- Figure 64: South America Gas Separation Membrane Market Volume (K Tons), by Application 2024 & 2032
- Figure 65: South America Gas Separation Membrane Market Revenue Share (%), by Application 2024 & 2032
- Figure 66: South America Gas Separation Membrane Market Volume Share (%), by Application 2024 & 2032
- Figure 67: South America Gas Separation Membrane Market Revenue (Million), by Country 2024 & 2032
- Figure 68: South America Gas Separation Membrane Market Volume (K Tons), by Country 2024 & 2032
- Figure 69: South America Gas Separation Membrane Market Revenue Share (%), by Country 2024 & 2032
- Figure 70: South America Gas Separation Membrane Market Volume Share (%), by Country 2024 & 2032
- Figure 71: Middle East and Africa Gas Separation Membrane Market Revenue (Million), by Material Type 2024 & 2032
- Figure 72: Middle East and Africa Gas Separation Membrane Market Volume (K Tons), by Material Type 2024 & 2032
- Figure 73: Middle East and Africa Gas Separation Membrane Market Revenue Share (%), by Material Type 2024 & 2032
- Figure 74: Middle East and Africa Gas Separation Membrane Market Volume Share (%), by Material Type 2024 & 2032
- Figure 75: Middle East and Africa Gas Separation Membrane Market Revenue (Million), by Application 2024 & 2032
- Figure 76: Middle East and Africa Gas Separation Membrane Market Volume (K Tons), by Application 2024 & 2032
- Figure 77: Middle East and Africa Gas Separation Membrane Market Revenue Share (%), by Application 2024 & 2032
- Figure 78: Middle East and Africa Gas Separation Membrane Market Volume Share (%), by Application 2024 & 2032
- Figure 79: Middle East and Africa Gas Separation Membrane Market Revenue (Million), by Country 2024 & 2032
- Figure 80: Middle East and Africa Gas Separation Membrane Market Volume (K Tons), by Country 2024 & 2032
- Figure 81: Middle East and Africa Gas Separation Membrane Market Revenue Share (%), by Country 2024 & 2032
- Figure 82: Middle East and Africa Gas Separation Membrane Market Volume Share (%), by Country 2024 & 2032
List of Tables
- Table 1: Global Gas Separation Membrane Market Revenue Million Forecast, by Region 2019 & 2032
- Table 2: Global Gas Separation Membrane Market Volume K Tons Forecast, by Region 2019 & 2032
- Table 3: Global Gas Separation Membrane Market Revenue Million Forecast, by Material Type 2019 & 2032
- Table 4: Global Gas Separation Membrane Market Volume K Tons Forecast, by Material Type 2019 & 2032
- Table 5: Global Gas Separation Membrane Market Revenue Million Forecast, by Application 2019 & 2032
- Table 6: Global Gas Separation Membrane Market Volume K Tons Forecast, by Application 2019 & 2032
- Table 7: Global Gas Separation Membrane Market Revenue Million Forecast, by Region 2019 & 2032
- Table 8: Global Gas Separation Membrane Market Volume K Tons Forecast, by Region 2019 & 2032
- Table 9: Global Gas Separation Membrane Market Revenue Million Forecast, by Country 2019 & 2032
- Table 10: Global Gas Separation Membrane Market Volume K Tons Forecast, by Country 2019 & 2032
- Table 11: China Gas Separation Membrane Market Revenue (Million) Forecast, by Application 2019 & 2032
- Table 12: China Gas Separation Membrane Market Volume (K Tons) Forecast, by Application 2019 & 2032
- Table 13: India Gas Separation Membrane Market Revenue (Million) Forecast, by Application 2019 & 2032
- Table 14: India Gas Separation Membrane Market Volume (K Tons) Forecast, by Application 2019 & 2032
- Table 15: Japan Gas Separation Membrane Market Revenue (Million) Forecast, by Application 2019 & 2032
- Table 16: Japan Gas Separation Membrane Market Volume (K Tons) Forecast, by Application 2019 & 2032
- Table 17: South Korea Gas Separation Membrane Market Revenue (Million) Forecast, by Application 2019 & 2032
- Table 18: South Korea Gas Separation Membrane Market Volume (K Tons) Forecast, by Application 2019 & 2032
- Table 19: Rest of Asia Pacific Gas Separation Membrane Market Revenue (Million) Forecast, by Application 2019 & 2032
- Table 20: Rest of Asia Pacific Gas Separation Membrane Market Volume (K Tons) Forecast, by Application 2019 & 2032
- Table 21: Global Gas Separation Membrane Market Revenue Million Forecast, by Country 2019 & 2032
- Table 22: Global Gas Separation Membrane Market Volume K Tons Forecast, by Country 2019 & 2032
- Table 23: United States Gas Separation Membrane Market Revenue (Million) Forecast, by Application 2019 & 2032
- Table 24: United States Gas Separation Membrane Market Volume (K Tons) Forecast, by Application 2019 & 2032
- Table 25: Canada Gas Separation Membrane Market Revenue (Million) Forecast, by Application 2019 & 2032
- Table 26: Canada Gas Separation Membrane Market Volume (K Tons) Forecast, by Application 2019 & 2032
- Table 27: Mexico Gas Separation Membrane Market Revenue (Million) Forecast, by Application 2019 & 2032
- Table 28: Mexico Gas Separation Membrane Market Volume (K Tons) Forecast, by Application 2019 & 2032
- Table 29: Global Gas Separation Membrane Market Revenue Million Forecast, by Country 2019 & 2032
- Table 30: Global Gas Separation Membrane Market Volume K Tons Forecast, by Country 2019 & 2032
- Table 31: Germany Gas Separation Membrane Market Revenue (Million) Forecast, by Application 2019 & 2032
- Table 32: Germany Gas Separation Membrane Market Volume (K Tons) Forecast, by Application 2019 & 2032
- Table 33: United Kingdom Gas Separation Membrane Market Revenue (Million) Forecast, by Application 2019 & 2032
- Table 34: United Kingdom Gas Separation Membrane Market Volume (K Tons) Forecast, by Application 2019 & 2032
- Table 35: Italy Gas Separation Membrane Market Revenue (Million) Forecast, by Application 2019 & 2032
- Table 36: Italy Gas Separation Membrane Market Volume (K Tons) Forecast, by Application 2019 & 2032
- Table 37: France Gas Separation Membrane Market Revenue (Million) Forecast, by Application 2019 & 2032
- Table 38: France Gas Separation Membrane Market Volume (K Tons) Forecast, by Application 2019 & 2032
- Table 39: Rest of Europe Gas Separation Membrane Market Revenue (Million) Forecast, by Application 2019 & 2032
- Table 40: Rest of Europe Gas Separation Membrane Market Volume (K Tons) Forecast, by Application 2019 & 2032
- Table 41: Global Gas Separation Membrane Market Revenue Million Forecast, by Country 2019 & 2032
- Table 42: Global Gas Separation Membrane Market Volume K Tons Forecast, by Country 2019 & 2032
- Table 43: Brazil Gas Separation Membrane Market Revenue (Million) Forecast, by Application 2019 & 2032
- Table 44: Brazil Gas Separation Membrane Market Volume (K Tons) Forecast, by Application 2019 & 2032
- Table 45: Argentina Gas Separation Membrane Market Revenue (Million) Forecast, by Application 2019 & 2032
- Table 46: Argentina Gas Separation Membrane Market Volume (K Tons) Forecast, by Application 2019 & 2032
- Table 47: Rest of South America Gas Separation Membrane Market Revenue (Million) Forecast, by Application 2019 & 2032
- Table 48: Rest of South America Gas Separation Membrane Market Volume (K Tons) Forecast, by Application 2019 & 2032
- Table 49: Global Gas Separation Membrane Market Revenue Million Forecast, by Country 2019 & 2032
- Table 50: Global Gas Separation Membrane Market Volume K Tons Forecast, by Country 2019 & 2032
- Table 51: Saudi Arabia Gas Separation Membrane Market Revenue (Million) Forecast, by Application 2019 & 2032
- Table 52: Saudi Arabia Gas Separation Membrane Market Volume (K Tons) Forecast, by Application 2019 & 2032
- Table 53: South Africa Gas Separation Membrane Market Revenue (Million) Forecast, by Application 2019 & 2032
- Table 54: South Africa Gas Separation Membrane Market Volume (K Tons) Forecast, by Application 2019 & 2032
- Table 55: Rest of Middle East and Africa Gas Separation Membrane Market Revenue (Million) Forecast, by Application 2019 & 2032
- Table 56: Rest of Middle East and Africa Gas Separation Membrane Market Volume (K Tons) Forecast, by Application 2019 & 2032
- Table 57: Global Gas Separation Membrane Market Revenue Million Forecast, by Material Type 2019 & 2032
- Table 58: Global Gas Separation Membrane Market Volume K Tons Forecast, by Material Type 2019 & 2032
- Table 59: Global Gas Separation Membrane Market Revenue Million Forecast, by Application 2019 & 2032
- Table 60: Global Gas Separation Membrane Market Volume K Tons Forecast, by Application 2019 & 2032
- Table 61: Global Gas Separation Membrane Market Revenue Million Forecast, by Country 2019 & 2032
- Table 62: Global Gas Separation Membrane Market Volume K Tons Forecast, by Country 2019 & 2032
- Table 63: China Gas Separation Membrane Market Revenue (Million) Forecast, by Application 2019 & 2032
- Table 64: China Gas Separation Membrane Market Volume (K Tons) Forecast, by Application 2019 & 2032
- Table 65: India Gas Separation Membrane Market Revenue (Million) Forecast, by Application 2019 & 2032
- Table 66: India Gas Separation Membrane Market Volume (K Tons) Forecast, by Application 2019 & 2032
- Table 67: Japan Gas Separation Membrane Market Revenue (Million) Forecast, by Application 2019 & 2032
- Table 68: Japan Gas Separation Membrane Market Volume (K Tons) Forecast, by Application 2019 & 2032
- Table 69: South Korea Gas Separation Membrane Market Revenue (Million) Forecast, by Application 2019 & 2032
- Table 70: South Korea Gas Separation Membrane Market Volume (K Tons) Forecast, by Application 2019 & 2032
- Table 71: Malaysia Gas Separation Membrane Market Revenue (Million) Forecast, by Application 2019 & 2032
- Table 72: Malaysia Gas Separation Membrane Market Volume (K Tons) Forecast, by Application 2019 & 2032
- Table 73: Thailand Gas Separation Membrane Market Revenue (Million) Forecast, by Application 2019 & 2032
- Table 74: Thailand Gas Separation Membrane Market Volume (K Tons) Forecast, by Application 2019 & 2032
- Table 75: Indonesia Gas Separation Membrane Market Revenue (Million) Forecast, by Application 2019 & 2032
- Table 76: Indonesia Gas Separation Membrane Market Volume (K Tons) Forecast, by Application 2019 & 2032
- Table 77: Vietnam Gas Separation Membrane Market Revenue (Million) Forecast, by Application 2019 & 2032
- Table 78: Vietnam Gas Separation Membrane Market Volume (K Tons) Forecast, by Application 2019 & 2032
- Table 79: Rest of Asia Pacific Gas Separation Membrane Market Revenue (Million) Forecast, by Application 2019 & 2032
- Table 80: Rest of Asia Pacific Gas Separation Membrane Market Volume (K Tons) Forecast, by Application 2019 & 2032
- Table 81: Global Gas Separation Membrane Market Revenue Million Forecast, by Material Type 2019 & 2032
- Table 82: Global Gas Separation Membrane Market Volume K Tons Forecast, by Material Type 2019 & 2032
- Table 83: Global Gas Separation Membrane Market Revenue Million Forecast, by Application 2019 & 2032
- Table 84: Global Gas Separation Membrane Market Volume K Tons Forecast, by Application 2019 & 2032
- Table 85: Global Gas Separation Membrane Market Revenue Million Forecast, by Country 2019 & 2032
- Table 86: Global Gas Separation Membrane Market Volume K Tons Forecast, by Country 2019 & 2032
- Table 87: United States Gas Separation Membrane Market Revenue (Million) Forecast, by Application 2019 & 2032
- Table 88: United States Gas Separation Membrane Market Volume (K Tons) Forecast, by Application 2019 & 2032
- Table 89: Canada Gas Separation Membrane Market Revenue (Million) Forecast, by Application 2019 & 2032
- Table 90: Canada Gas Separation Membrane Market Volume (K Tons) Forecast, by Application 2019 & 2032
- Table 91: Mexico Gas Separation Membrane Market Revenue (Million) Forecast, by Application 2019 & 2032
- Table 92: Mexico Gas Separation Membrane Market Volume (K Tons) Forecast, by Application 2019 & 2032
- Table 93: Global Gas Separation Membrane Market Revenue Million Forecast, by Material Type 2019 & 2032
- Table 94: Global Gas Separation Membrane Market Volume K Tons Forecast, by Material Type 2019 & 2032
- Table 95: Global Gas Separation Membrane Market Revenue Million Forecast, by Application 2019 & 2032
- Table 96: Global Gas Separation Membrane Market Volume K Tons Forecast, by Application 2019 & 2032
- Table 97: Global Gas Separation Membrane Market Revenue Million Forecast, by Country 2019 & 2032
- Table 98: Global Gas Separation Membrane Market Volume K Tons Forecast, by Country 2019 & 2032
- Table 99: Germany Gas Separation Membrane Market Revenue (Million) Forecast, by Application 2019 & 2032
- Table 100: Germany Gas Separation Membrane Market Volume (K Tons) Forecast, by Application 2019 & 2032
- Table 101: United Kingdom Gas Separation Membrane Market Revenue (Million) Forecast, by Application 2019 & 2032
- Table 102: United Kingdom Gas Separation Membrane Market Volume (K Tons) Forecast, by Application 2019 & 2032
- Table 103: Italy Gas Separation Membrane Market Revenue (Million) Forecast, by Application 2019 & 2032
- Table 104: Italy Gas Separation Membrane Market Volume (K Tons) Forecast, by Application 2019 & 2032
- Table 105: France Gas Separation Membrane Market Revenue (Million) Forecast, by Application 2019 & 2032
- Table 106: France Gas Separation Membrane Market Volume (K Tons) Forecast, by Application 2019 & 2032
- Table 107: Spain Gas Separation Membrane Market Revenue (Million) Forecast, by Application 2019 & 2032
- Table 108: Spain Gas Separation Membrane Market Volume (K Tons) Forecast, by Application 2019 & 2032
- Table 109: Turkey Gas Separation Membrane Market Revenue (Million) Forecast, by Application 2019 & 2032
- Table 110: Turkey Gas Separation Membrane Market Volume (K Tons) Forecast, by Application 2019 & 2032
- Table 111: Russia Gas Separation Membrane Market Revenue (Million) Forecast, by Application 2019 & 2032
- Table 112: Russia Gas Separation Membrane Market Volume (K Tons) Forecast, by Application 2019 & 2032
- Table 113: NORDIC Gas Separation Membrane Market Revenue (Million) Forecast, by Application 2019 & 2032
- Table 114: NORDIC Gas Separation Membrane Market Volume (K Tons) Forecast, by Application 2019 & 2032
- Table 115: Rest of Europe Gas Separation Membrane Market Revenue (Million) Forecast, by Application 2019 & 2032
- Table 116: Rest of Europe Gas Separation Membrane Market Volume (K Tons) Forecast, by Application 2019 & 2032
- Table 117: Global Gas Separation Membrane Market Revenue Million Forecast, by Material Type 2019 & 2032
- Table 118: Global Gas Separation Membrane Market Volume K Tons Forecast, by Material Type 2019 & 2032
- Table 119: Global Gas Separation Membrane Market Revenue Million Forecast, by Application 2019 & 2032
- Table 120: Global Gas Separation Membrane Market Volume K Tons Forecast, by Application 2019 & 2032
- Table 121: Global Gas Separation Membrane Market Revenue Million Forecast, by Country 2019 & 2032
- Table 122: Global Gas Separation Membrane Market Volume K Tons Forecast, by Country 2019 & 2032
- Table 123: Brazil Gas Separation Membrane Market Revenue (Million) Forecast, by Application 2019 & 2032
- Table 124: Brazil Gas Separation Membrane Market Volume (K Tons) Forecast, by Application 2019 & 2032
- Table 125: Argentina Gas Separation Membrane Market Revenue (Million) Forecast, by Application 2019 & 2032
- Table 126: Argentina Gas Separation Membrane Market Volume (K Tons) Forecast, by Application 2019 & 2032
- Table 127: Colombia Gas Separation Membrane Market Revenue (Million) Forecast, by Application 2019 & 2032
- Table 128: Colombia Gas Separation Membrane Market Volume (K Tons) Forecast, by Application 2019 & 2032
- Table 129: Rest of South America Gas Separation Membrane Market Revenue (Million) Forecast, by Application 2019 & 2032
- Table 130: Rest of South America Gas Separation Membrane Market Volume (K Tons) Forecast, by Application 2019 & 2032
- Table 131: Global Gas Separation Membrane Market Revenue Million Forecast, by Material Type 2019 & 2032
- Table 132: Global Gas Separation Membrane Market Volume K Tons Forecast, by Material Type 2019 & 2032
- Table 133: Global Gas Separation Membrane Market Revenue Million Forecast, by Application 2019 & 2032
- Table 134: Global Gas Separation Membrane Market Volume K Tons Forecast, by Application 2019 & 2032
- Table 135: Global Gas Separation Membrane Market Revenue Million Forecast, by Country 2019 & 2032
- Table 136: Global Gas Separation Membrane Market Volume K Tons Forecast, by Country 2019 & 2032
- Table 137: Saudi Arabia Gas Separation Membrane Market Revenue (Million) Forecast, by Application 2019 & 2032
- Table 138: Saudi Arabia Gas Separation Membrane Market Volume (K Tons) Forecast, by Application 2019 & 2032
- Table 139: South Africa Gas Separation Membrane Market Revenue (Million) Forecast, by Application 2019 & 2032
- Table 140: South Africa Gas Separation Membrane Market Volume (K Tons) Forecast, by Application 2019 & 2032
- Table 141: Nigeria Gas Separation Membrane Market Revenue (Million) Forecast, by Application 2019 & 2032
- Table 142: Nigeria Gas Separation Membrane Market Volume (K Tons) Forecast, by Application 2019 & 2032
- Table 143: Qatar Gas Separation Membrane Market Revenue (Million) Forecast, by Application 2019 & 2032
- Table 144: Qatar Gas Separation Membrane Market Volume (K Tons) Forecast, by Application 2019 & 2032
- Table 145: Egypt Gas Separation Membrane Market Revenue (Million) Forecast, by Application 2019 & 2032
- Table 146: Egypt Gas Separation Membrane Market Volume (K Tons) Forecast, by Application 2019 & 2032
- Table 147: UAE Gas Separation Membrane Market Revenue (Million) Forecast, by Application 2019 & 2032
- Table 148: UAE Gas Separation Membrane Market Volume (K Tons) Forecast, by Application 2019 & 2032
- Table 149: Rest of Middle East and Africa Gas Separation Membrane Market Revenue (Million) Forecast, by Application 2019 & 2032
- Table 150: Rest of Middle East and Africa Gas Separation Membrane Market Volume (K Tons) Forecast, by Application 2019 & 2032
Frequently Asked Questions
1. What is the projected Compound Annual Growth Rate (CAGR) of the Gas Separation Membrane Market?
The projected CAGR is approximately 5.87%.
2. Which companies are prominent players in the Gas Separation Membrane Market?
Key companies in the market include Linde PLC, DIC Corporation, Honeywell International Inc, Air Products and Chemicals Inc, UBE Corporation*List Not Exhaustive, Toray Industries Inc, SLB (schlumberger), Evonik Industries AG, Fujifilm Corporation, Air Liquide Advanced Separations, Generon, Parker Hannifin Corp, Membrane Technology and Research Inc.
3. What are the main segments of the Gas Separation Membrane Market?
The market segments include Material Type, Application.
4. Can you provide details about the market size?
The market size is estimated to be USD 1.97 Million as of 2022.
5. What are some drivers contributing to market growth?
Increasing Demand for Membranes in Carbon Dioxide Separation Processes; Strict Government Norms Toward GHG Emissions.
6. What are the notable trends driving market growth?
Nitrogen Generation and Oxygen Enrichment Application to Dominate the Market.
7. Are there any restraints impacting market growth?
Plasticization of Polymeric Membranes in High-Temperature Applications; Upscaling and Adoption of New Membranes.
8. Can you provide examples of recent developments in the market?
January 2023: UBE Corporation announced the expansion of its polyimide hollow fiber production facilities for gas separation membranes at its Ube Chemical Factory and the gas separation membrane module production facilities at its Sakai Factory in order to meet rapidly growing demand, particularly for CO2 separation membranes. Both expanded facilities are scheduled to go online in the first half of fiscal 2025, increasing production capacity by about 1.8 times.
9. What pricing options are available for accessing the report?
Pricing options include single-user, multi-user, and enterprise licenses priced at USD 4750, USD 5250, and USD 8750 respectively.
10. Is the market size provided in terms of value or volume?
The market size is provided in terms of value, measured in Million and volume, measured in K Tons.
11. Are there any specific market keywords associated with the report?
Yes, the market keyword associated with the report is "Gas Separation Membrane Market," which aids in identifying and referencing the specific market segment covered.
12. How do I determine which pricing option suits my needs best?
The pricing options vary based on user requirements and access needs. Individual users may opt for single-user licenses, while businesses requiring broader access may choose multi-user or enterprise licenses for cost-effective access to the report.
13. Are there any additional resources or data provided in the Gas Separation Membrane Market report?
While the report offers comprehensive insights, it's advisable to review the specific contents or supplementary materials provided to ascertain if additional resources or data are available.
14. How can I stay updated on further developments or reports in the Gas Separation Membrane Market?
To stay informed about further developments, trends, and reports in the Gas Separation Membrane Market, consider subscribing to industry newsletters, following relevant companies and organizations, or regularly checking reputable industry news sources and publications.
Methodology
Step 1 - Identification of Relevant Samples Size from Population Database


Step 2 - Approaches for Defining Global Market Size (Value, Volume* & Price*)

Note*: In applicable scenarios
Step 3 - Data Sources
Primary Research
- Web Analytics
- Survey Reports
- Research Institute
- Latest Research Reports
- Opinion Leaders
Secondary Research
- Annual Reports
- White Paper
- Latest Press Release
- Industry Association
- Paid Database
- Investor Presentations

Step 4 - Data Triangulation
Involves using different sources of information in order to increase the validity of a study
These sources are likely to be stakeholders in a program - participants, other researchers, program staff, other community members, and so on.
Then we put all data in single framework & apply various statistical tools to find out the dynamic on the market.
During the analysis stage, feedback from the stakeholder groups would be compared to determine areas of agreement as well as areas of divergence


