

Key Insights
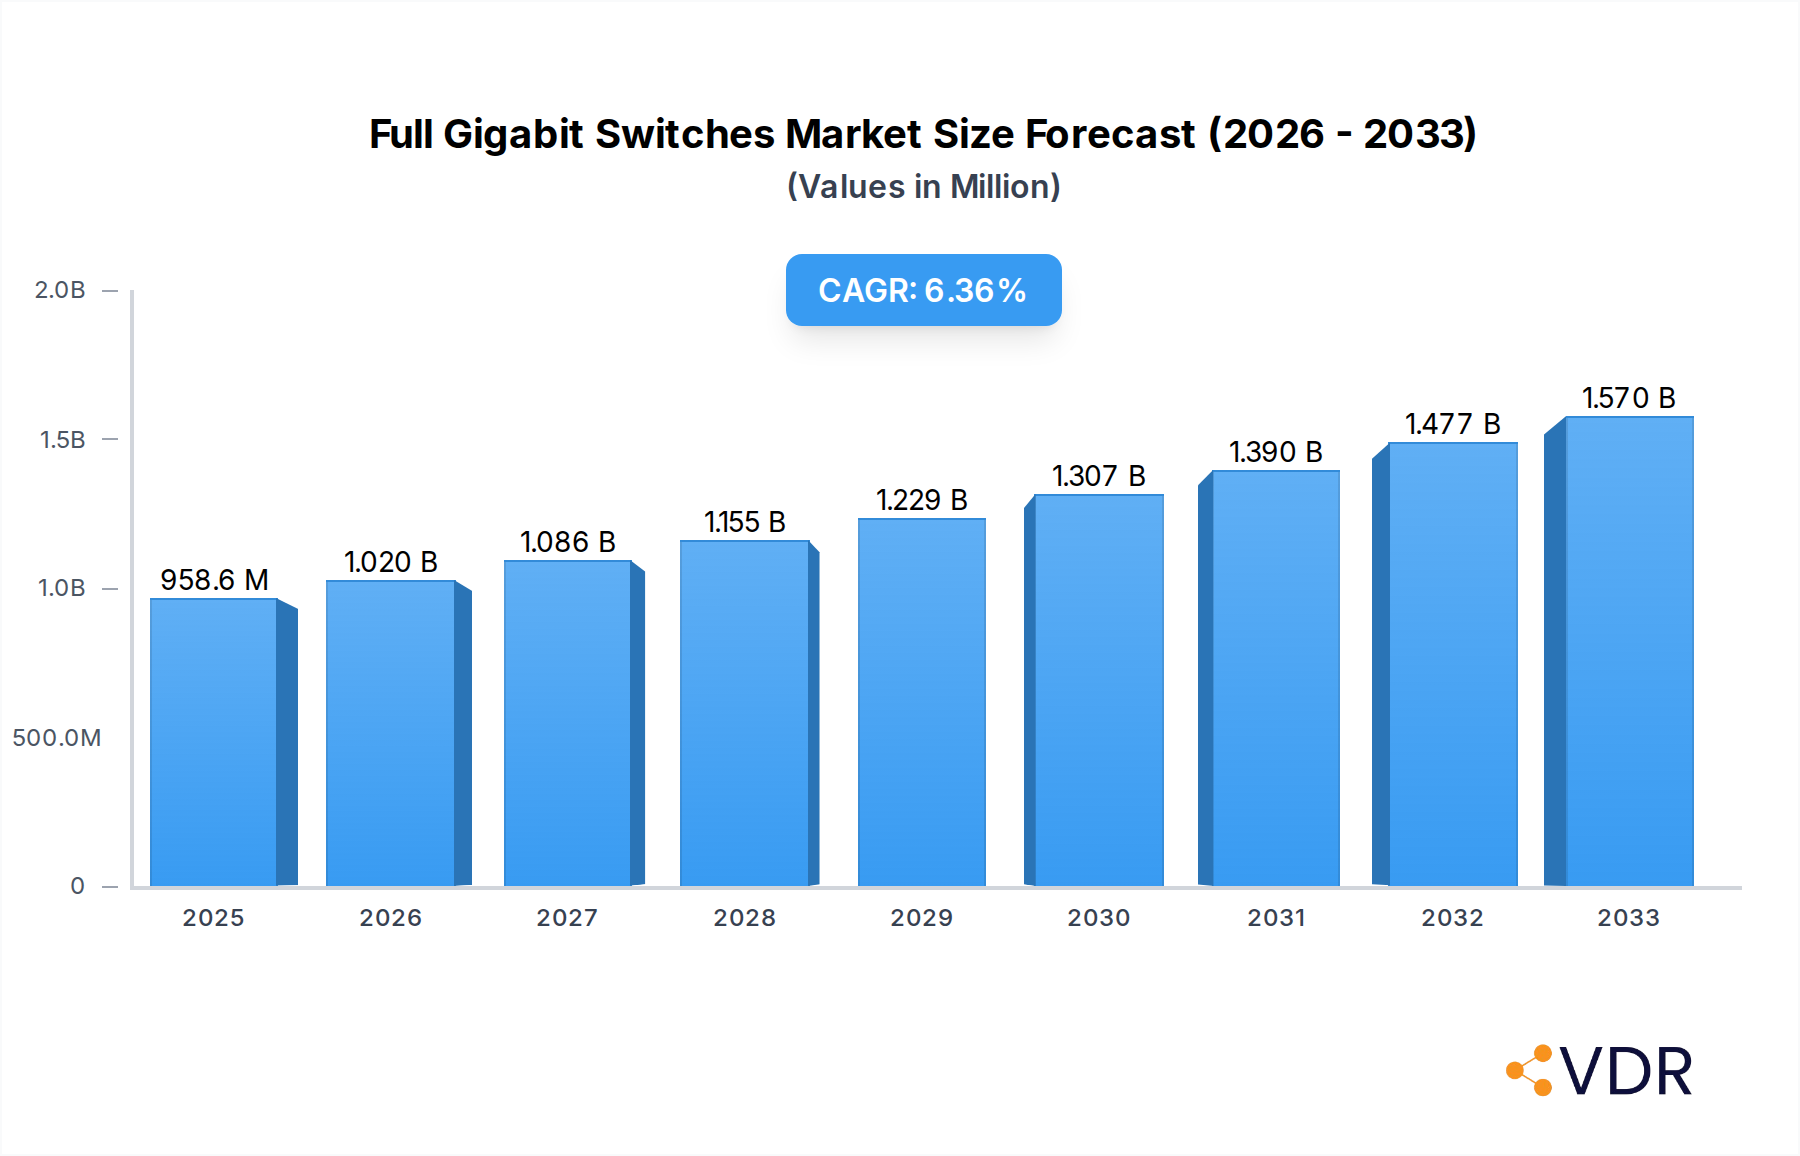
The Full Gigabit Switches market is poised for substantial growth, projected to reach a significant $958.57 million by 2025, demonstrating a robust 6.48% Compound Annual Growth Rate (CAGR). This expansion is fueled by an escalating demand for faster and more reliable network infrastructure across diverse sectors. The increasing adoption of high-bandwidth applications, such as cloud computing, high-definition video streaming, and the burgeoning Internet of Things (IoT) ecosystem, are primary drivers. Businesses are actively upgrading their networks to support these data-intensive operations, leading to a greater need for gigabit-speed connectivity. Furthermore, the continuous evolution of smart home technologies and the growing complexity of enterprise networks necessitate switches capable of handling increased traffic volumes efficiently. This surge in demand is also influenced by the ongoing digital transformation initiatives worldwide, which prioritize seamless data flow and enhanced network performance.

Full Gigabit Switches Market Size (In Million)
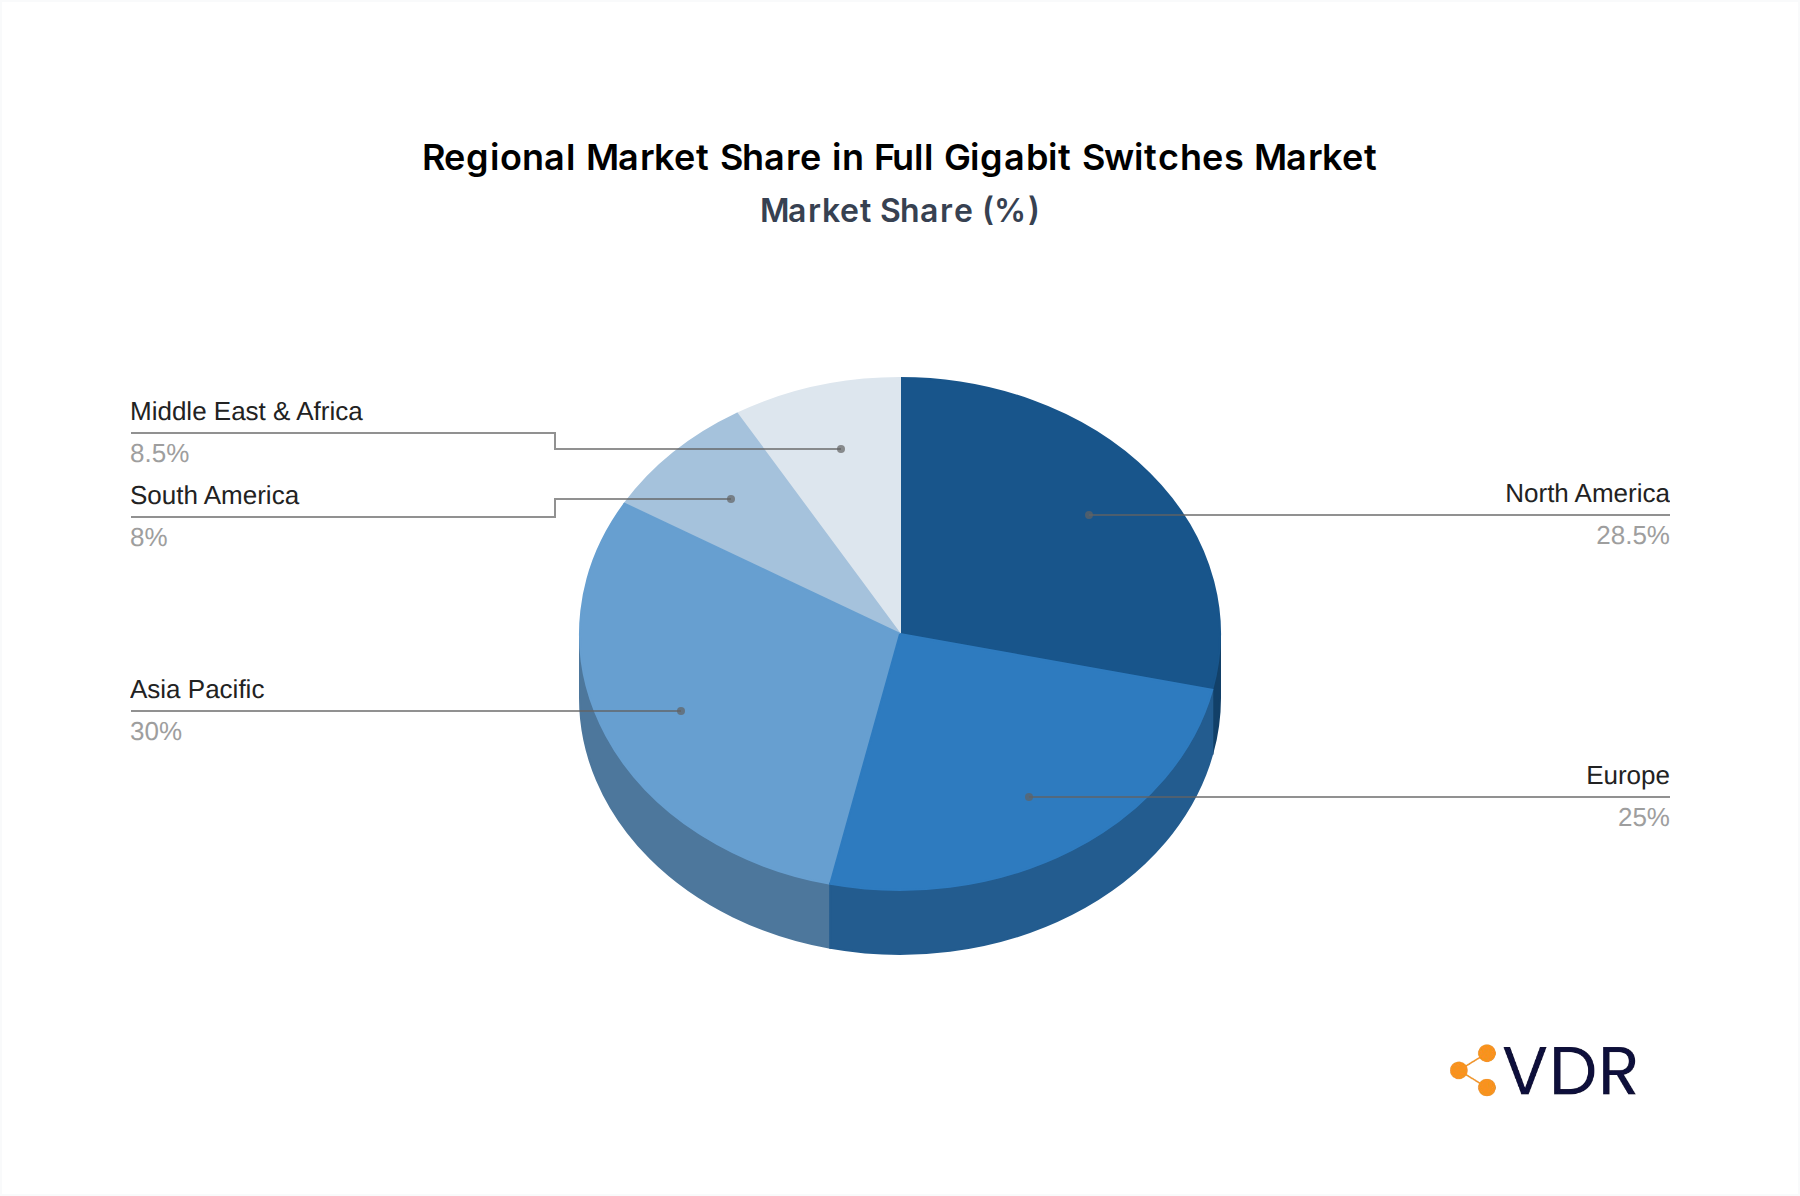
The market is segmented into key applications, with Online Sales demonstrating a strong preference, reflecting the growing e-commerce landscape and the ease of digital procurement for networking solutions. Offline Sales remain crucial, particularly for large enterprises and complex deployments requiring expert consultation and support. The types of switches, ranging from 4 Ports to 16 Ports and others, cater to a spectrum of user needs, from small home offices to large data centers. Geographically, North America and Asia Pacific are expected to lead market expansion due to significant investments in IT infrastructure, rapid technological advancements, and the presence of major market players like NETGEAR, TP-Link Technologies, and Cisco Systems. Europe also presents a substantial market, driven by smart city initiatives and the widespread adoption of digital technologies. The market's trajectory indicates a sustained upward trend, underscoring the critical role of gigabit switches in powering the modern digital economy.
Full Gigabit Switches Company Market Share
This in-depth report provides an exhaustive analysis of the global Full Gigabit Switches market, covering its dynamics, growth trajectory, regional dominance, product landscape, key drivers, challenges, and future opportunities. Leveraging extensive data from the Study Period (2019–2033), with a Base Year of 2025, Estimated Year of 2025, and Forecast Period (2025–2033), this report offers invaluable insights for industry professionals, investors, and stakeholders. We delve into the market's evolution during the Historical Period (2019–2024) to provide a holistic view. This report is meticulously structured to deliver clear, actionable intelligence without requiring further modification.
Full Gigabit Switches Market Dynamics & Structure
The Full Gigabit Switches market exhibits a moderately concentrated structure, with leading players like NETGEAR, TP-Link Technologies, and Cisco Systems holding significant market share. Technological innovation is primarily driven by the increasing demand for high-speed data transfer in enterprise networks, smart homes, and industrial IoT deployments. Regulatory frameworks, though generally supportive of network infrastructure development, can influence product standards and import/export dynamics. Competitive product substitutes, such as managed switches with advanced features or lower-speed alternatives, exist but are increasingly being phased out in favor of full gigabit capabilities. End-user demographics span small and medium-sized businesses (SMBs), large enterprises, educational institutions, and residential users, each with distinct performance and feature requirements. Mergers and acquisitions (M&A) trends are evident, particularly among smaller vendors seeking to enhance their product portfolios or market reach, indicating a consolidation phase in certain market segments.
- Market Concentration: Moderate, with top players holding a combined market share exceeding 55 million units.
- Technological Innovation Drivers: Growing demand for 4K/8K streaming, cloud computing, AI, and IoT connectivity.
- Regulatory Frameworks: Focus on network security standards and interoperability protocols.
- Competitive Substitutes: Higher-tier managed switches, Power over Ethernet (PoE) switches, and legacy Fast Ethernet switches in niche applications.
- End-User Demographics: Enterprises (45%), SMBs (30%), Residential (20%), Education & Government (5%).
- M&A Trends: Strategic acquisitions to broaden product lines and expand geographical presence, with approximately 10-15 significant M&A activities annually in the past five years.
Full Gigabit Switches Growth Trends & Insights
The Full Gigabit Switches market is poised for robust expansion, driven by the insatiable demand for faster and more reliable network connectivity across diverse sectors. The market size, estimated at approximately 350 million units in 2025, is projected to witness a Compound Annual Growth Rate (CAGR) of 6.8% during the forecast period, reaching over 580 million units by 2033. Adoption rates for full gigabit technology are steadily increasing, displacing older Ethernet standards as businesses and consumers prioritize bandwidth-intensive applications. Technological disruptions, such as the integration of AI-powered network management and the increasing prevalence of Wi-Fi 6/6E and Wi-Fi 7, are acting as significant catalysts, necessitating higher-speed wired backhaul. Consumer behavior shifts are characterized by a growing reliance on smart home devices, online gaming, and high-definition content streaming, all of which demand superior network performance. The proliferation of smart cities and the expansion of cloud infrastructure further contribute to the escalating need for high-throughput networking solutions. The market penetration of full gigabit switches is projected to reach over 75% in enterprise environments and 60% in residential deployments by 2033.
Dominant Regions, Countries, or Segments in Full Gigabit Switches
The Asia-Pacific region is emerging as the dominant force in the Full Gigabit Switches market, driven by rapid digital transformation initiatives, substantial investments in IT infrastructure, and a burgeoning base of small and medium-sized enterprises (SMEs). Countries like China, India, and South Korea are spearheading this growth due to government support for digitalization, increasing disposable incomes, and the widespread adoption of high-speed internet. The 8 Ports segment, a crucial category for both SMBs and home offices, is experiencing particularly strong demand, accounting for an estimated 40% of the total market volume in 2025. This is further fueled by the increasing number of connected devices within these environments.
- Dominant Region: Asia-Pacific, projected to command a market share of approximately 35% by 2028.
- Key Dominant Countries: China (estimated 15% market share), India (estimated 10% market share), United States (estimated 12% market share).
- Dominant Application Segment: Online Sales are increasingly contributing to market growth, expected to account for over 55% of total sales by 2030, owing to the convenience and reach of e-commerce platforms.
- Dominant Type Segment: 8 Ports switches are leading the charge, driven by their versatility and affordability for a wide range of users, representing an estimated 250 million units in global demand for 2025.
- Key Growth Drivers in Asia-Pacific: Smart city initiatives, 5G network deployment, and the rapid expansion of e-commerce and digital services.
- Market Share and Growth Potential: Asia-Pacific is expected to grow at a CAGR of 7.5% during the forecast period, surpassing North America and Europe in terms of volume.
Full Gigabit Switches Product Landscape
The Full Gigabit Switches product landscape is characterized by continuous innovation focused on enhancing speed, reliability, and manageability. Manufacturers are increasingly offering compact, energy-efficient designs suitable for various deployment scenarios, from enterprise server rooms to desktop use. Key product innovations include the integration of advanced Quality of Service (QoS) features for prioritizing critical traffic, enhanced security protocols to protect against network threats, and user-friendly interfaces for simplified setup and management, particularly for unmanaged and smart managed switches. Performance metrics such as switching capacity, packet forwarding rate, and latency are crucial differentiators, with leading products boasting capacities of up to hundreds of gigabits per second. Unique selling propositions often revolve around affordability for SMBs, robust build quality for industrial environments, and advanced features for enterprise-grade solutions.
Key Drivers, Barriers & Challenges in Full Gigabit Switches
Key Drivers:
- Accelerated Digitalization: The pervasive adoption of cloud computing, AI, and IoT necessitates faster network infrastructure.
- Demand for High-Bandwidth Applications: Streaming services, online gaming, and video conferencing require robust gigabit connectivity.
- Smart Home and Office Growth: The proliferation of connected devices in residential and commercial spaces drives demand.
- 5G Network Expansion: The rollout of 5G infrastructure requires high-speed wired backhaul for base stations and data centers.
- SMB Network Upgrades: Small and medium-sized businesses are increasingly upgrading to gigabit speeds for improved productivity.
Key Barriers & Challenges:
- Supply Chain Disruptions: Global chip shortages and logistical challenges can impact production and lead times, contributing to price volatility.
- Cybersecurity Threats: Growing sophistication of cyberattacks necessitates robust security features, increasing development costs.
- Price Sensitivity in Certain Segments: While demand for speed is high, cost remains a significant factor for entry-level users and some SMBs.
- Competition from Higher-Tier Solutions: In advanced enterprise environments, there is competition from 10 Gigabit Ethernet and higher.
- E-Waste and Sustainability Concerns: The rapid obsolescence of older networking equipment poses environmental challenges.
Emerging Opportunities in Full Gigabit Switches
Emerging opportunities in the Full Gigabit Switches market lie in the expansion of smart city infrastructure, where high-speed, low-latency networks are critical for managing traffic, public safety, and utility services. The growing demand for industrial IoT (IIoT) solutions in manufacturing, logistics, and agriculture presents a significant untapped market, requiring ruggedized and reliable gigabit switches. Furthermore, the increasing adoption of Edge computing, which processes data closer to the source, will necessitate localized high-speed networking capabilities. Evolving consumer preferences for seamless home networking, supporting multiple high-definition streams and immersive gaming experiences, also presents a continuous opportunity for product innovation and market penetration.
Growth Accelerators in the Full Gigabit Switches Industry
Technological breakthroughs in silicon manufacturing are enabling the development of more power-efficient and cost-effective gigabit switch chipsets, acting as a significant growth accelerator. Strategic partnerships between switch manufacturers and cloud service providers are facilitating the integration of switches into broader networking solutions, expanding their market reach. The ongoing market expansion driven by government initiatives promoting digital infrastructure development in developing economies further fuels long-term growth. Moreover, the increasing adoption of Software-Defined Networking (SDN) principles in SMB and enterprise environments is creating demand for managed and smart managed gigabit switches that offer centralized control and enhanced flexibility.
Key Players Shaping the Full Gigabit Switches Market
- NETGEAR
- TRENDnet
- TP-Link Technologies
- EnGenius Technologies
- Cisco Systems
- Aruba
- Zyxel Networks
- D-Link
- CommScope
Notable Milestones in Full Gigabit Switches Sector
- 2019: Widespread adoption of Wi-Fi 6 begins, increasing demand for gigabit Ethernet backhaul.
- 2020: Increased remote work and online learning accelerate demand for reliable home and office networking.
- 2021: Global supply chain constraints begin to impact semiconductor availability for network hardware.
- 2022: Introduction of more energy-efficient gigabit switch designs and enhanced security features.
- 2023: Growing focus on smart city deployments drives demand for high-performance network infrastructure.
- 2024: Emergence of Wi-Fi 7 standards begins to influence future switch requirements.
In-Depth Full Gigabit Switches Market Outlook
The future of the Full Gigabit Switches market is exceptionally promising, driven by the relentless pursuit of digital transformation and the exponential growth of data. Key growth accelerators, including advancements in semiconductor technology and the strategic expansion of 5G and IoT ecosystems, will continue to propel market expansion. The increasing adoption of smart technologies across residential, commercial, and industrial sectors ensures a sustained demand for high-speed, reliable wired connectivity. Stakeholders can capitalize on emerging opportunities in underserved markets and by offering innovative solutions that cater to the evolving needs of a hyper-connected world. The market is expected to witness continued innovation in areas such as network automation, enhanced cybersecurity, and greater integration with cloud-based management platforms.
Full Gigabit Switches Segmentation
-
1. Application
- 1.1. Online Sales
- 1.2. Offline Sales
-
2. Types
- 2.1. 4 Ports
- 2.2. 8 Ports
- 2.3. 16 Ports
- 2.4. Others
Full Gigabit Switches Segmentation By Geography
-
1. North America
- 1.1. United States
- 1.2. Canada
- 1.3. Mexico
-
2. South America
- 2.1. Brazil
- 2.2. Argentina
- 2.3. Rest of South America
-
3. Europe
- 3.1. United Kingdom
- 3.2. Germany
- 3.3. France
- 3.4. Italy
- 3.5. Spain
- 3.6. Russia
- 3.7. Benelux
- 3.8. Nordics
- 3.9. Rest of Europe
-
4. Middle East & Africa
- 4.1. Turkey
- 4.2. Israel
- 4.3. GCC
- 4.4. North Africa
- 4.5. South Africa
- 4.6. Rest of Middle East & Africa
-
5. Asia Pacific
- 5.1. China
- 5.2. India
- 5.3. Japan
- 5.4. South Korea
- 5.5. ASEAN
- 5.6. Oceania
- 5.7. Rest of Asia Pacific
Full Gigabit Switches Regional Market Share
Geographic Coverage of Full Gigabit Switches
Full Gigabit Switches REPORT HIGHLIGHTS
| Aspects | Details |
|---|---|
| Study Period | 2020-2034 |
| Base Year | 2025 |
| Estimated Year | 2026 |
| Forecast Period | 2026-2034 |
| Historical Period | 2020-2025 |
| Growth Rate | CAGR of 7.1% from 2020-2034 |
| Segmentation |
|
Table of Contents
- 1. Introduction
- 1.1. Research Scope
- 1.2. Market Segmentation
- 1.3. Research Objective
- 1.4. Definitions and Assumptions
- 2. Executive Summary
- 2.1. Market Snapshot
- 3. Market Dynamics
- 3.1. Market Drivers
- 3.2. Market Restrains
- 3.3. Market Trends
- 3.4. Market Opportunities
- 4. Market Factor Analysis
- 4.1. Porters Five Forces
- 4.1.1. Bargaining Power of Suppliers
- 4.1.2. Bargaining Power of Buyers
- 4.1.3. Threat of New Entrants
- 4.1.4. Threat of Substitutes
- 4.1.5. Competitive Rivalry
- 4.2. PESTEL analysis
- 4.3. BCG Analysis
- 4.3.1. Stars (High Growth, High Market Share)
- 4.3.2. Cash Cows (Low Growth, High Market Share)
- 4.3.3. Question Mark (High Growth, Low Market Share)
- 4.3.4. Dogs (Low Growth, Low Market Share)
- 4.4. Ansoff Matrix Analysis
- 4.5. Supply Chain Analysis
- 4.6. Regulatory Landscape
- 4.7. Current Market Potential and Opportunity Assessment (TAM–SAM–SOM Framework)
- 4.8. VDR Analyst Note
- 4.1. Porters Five Forces
- 5. Market Analysis, Insights and Forecast 2021-2033
- 5.1. Market Analysis, Insights and Forecast - by Application
- 5.1.1. Online Sales
- 5.1.2. Offline Sales
- 5.2. Market Analysis, Insights and Forecast - by Types
- 5.2.1. 4 Ports
- 5.2.2. 8 Ports
- 5.2.3. 16 Ports
- 5.2.4. Others
- 5.3. Market Analysis, Insights and Forecast - by Region
- 5.3.1. North America
- 5.3.2. South America
- 5.3.3. Europe
- 5.3.4. Middle East & Africa
- 5.3.5. Asia Pacific
- 5.1. Market Analysis, Insights and Forecast - by Application
- 6. Global Full Gigabit Switches Analysis, Insights and Forecast, 2021-2033
- 6.1. Market Analysis, Insights and Forecast - by Application
- 6.1.1. Online Sales
- 6.1.2. Offline Sales
- 6.2. Market Analysis, Insights and Forecast - by Types
- 6.2.1. 4 Ports
- 6.2.2. 8 Ports
- 6.2.3. 16 Ports
- 6.2.4. Others
- 6.1. Market Analysis, Insights and Forecast - by Application
- 7. North America Full Gigabit Switches Analysis, Insights and Forecast, 2021-2033
- 7.1. Market Analysis, Insights and Forecast - by Application
- 7.1.1. Online Sales
- 7.1.2. Offline Sales
- 7.2. Market Analysis, Insights and Forecast - by Types
- 7.2.1. 4 Ports
- 7.2.2. 8 Ports
- 7.2.3. 16 Ports
- 7.2.4. Others
- 7.1. Market Analysis, Insights and Forecast - by Application
- 8. South America Full Gigabit Switches Analysis, Insights and Forecast, 2021-2033
- 8.1. Market Analysis, Insights and Forecast - by Application
- 8.1.1. Online Sales
- 8.1.2. Offline Sales
- 8.2. Market Analysis, Insights and Forecast - by Types
- 8.2.1. 4 Ports
- 8.2.2. 8 Ports
- 8.2.3. 16 Ports
- 8.2.4. Others
- 8.1. Market Analysis, Insights and Forecast - by Application
- 9. Europe Full Gigabit Switches Analysis, Insights and Forecast, 2021-2033
- 9.1. Market Analysis, Insights and Forecast - by Application
- 9.1.1. Online Sales
- 9.1.2. Offline Sales
- 9.2. Market Analysis, Insights and Forecast - by Types
- 9.2.1. 4 Ports
- 9.2.2. 8 Ports
- 9.2.3. 16 Ports
- 9.2.4. Others
- 9.1. Market Analysis, Insights and Forecast - by Application
- 10. Middle East & Africa Full Gigabit Switches Analysis, Insights and Forecast, 2021-2033
- 10.1. Market Analysis, Insights and Forecast - by Application
- 10.1.1. Online Sales
- 10.1.2. Offline Sales
- 10.2. Market Analysis, Insights and Forecast - by Types
- 10.2.1. 4 Ports
- 10.2.2. 8 Ports
- 10.2.3. 16 Ports
- 10.2.4. Others
- 10.1. Market Analysis, Insights and Forecast - by Application
- 11. Asia Pacific Full Gigabit Switches Analysis, Insights and Forecast, 2021-2033
- 11.1. Market Analysis, Insights and Forecast - by Application
- 11.1.1. Online Sales
- 11.1.2. Offline Sales
- 11.2. Market Analysis, Insights and Forecast - by Types
- 11.2.1. 4 Ports
- 11.2.2. 8 Ports
- 11.2.3. 16 Ports
- 11.2.4. Others
- 11.1. Market Analysis, Insights and Forecast - by Application
- 12. Competitive Analysis
- 12.1. Company Profiles
- 12.1.1 NETGEAR
- 12.1.1.1. Company Overview
- 12.1.1.2. Products
- 12.1.1.3. Company Financials
- 12.1.1.4. SWOT Analysis
- 12.1.2 TRENDnet
- 12.1.2.1. Company Overview
- 12.1.2.2. Products
- 12.1.2.3. Company Financials
- 12.1.2.4. SWOT Analysis
- 12.1.3 TP-Link Technologies
- 12.1.3.1. Company Overview
- 12.1.3.2. Products
- 12.1.3.3. Company Financials
- 12.1.3.4. SWOT Analysis
- 12.1.4 EnGenius Technologies
- 12.1.4.1. Company Overview
- 12.1.4.2. Products
- 12.1.4.3. Company Financials
- 12.1.4.4. SWOT Analysis
- 12.1.5 Cisco Systems
- 12.1.5.1. Company Overview
- 12.1.5.2. Products
- 12.1.5.3. Company Financials
- 12.1.5.4. SWOT Analysis
- 12.1.6 Aruba
- 12.1.6.1. Company Overview
- 12.1.6.2. Products
- 12.1.6.3. Company Financials
- 12.1.6.4. SWOT Analysis
- 12.1.7 Zyxel Networks
- 12.1.7.1. Company Overview
- 12.1.7.2. Products
- 12.1.7.3. Company Financials
- 12.1.7.4. SWOT Analysis
- 12.1.8 D-Link
- 12.1.8.1. Company Overview
- 12.1.8.2. Products
- 12.1.8.3. Company Financials
- 12.1.8.4. SWOT Analysis
- 12.1.9 CommScope
- 12.1.9.1. Company Overview
- 12.1.9.2. Products
- 12.1.9.3. Company Financials
- 12.1.9.4. SWOT Analysis
- 12.1.1 NETGEAR
- 12.2. Market Entropy
- 12.2.1 Company's Key Areas Served
- 12.2.2 Recent Developments
- 12.3. Company Market Share Analysis 2025
- 12.3.1 Top 5 Companies Market Share Analysis
- 12.3.2 Top 3 Companies Market Share Analysis
- 12.4. List of Potential Customers
- 13. Research Methodology
List of Figures
- Figure 1: Global Full Gigabit Switches Revenue Breakdown (undefined, %) by Region 2025 & 2033
- Figure 2: Global Full Gigabit Switches Volume Breakdown (K, %) by Region 2025 & 2033
- Figure 3: North America Full Gigabit Switches Revenue (undefined), by Application 2025 & 2033
- Figure 4: North America Full Gigabit Switches Volume (K), by Application 2025 & 2033
- Figure 5: North America Full Gigabit Switches Revenue Share (%), by Application 2025 & 2033
- Figure 6: North America Full Gigabit Switches Volume Share (%), by Application 2025 & 2033
- Figure 7: North America Full Gigabit Switches Revenue (undefined), by Types 2025 & 2033
- Figure 8: North America Full Gigabit Switches Volume (K), by Types 2025 & 2033
- Figure 9: North America Full Gigabit Switches Revenue Share (%), by Types 2025 & 2033
- Figure 10: North America Full Gigabit Switches Volume Share (%), by Types 2025 & 2033
- Figure 11: North America Full Gigabit Switches Revenue (undefined), by Country 2025 & 2033
- Figure 12: North America Full Gigabit Switches Volume (K), by Country 2025 & 2033
- Figure 13: North America Full Gigabit Switches Revenue Share (%), by Country 2025 & 2033
- Figure 14: North America Full Gigabit Switches Volume Share (%), by Country 2025 & 2033
- Figure 15: South America Full Gigabit Switches Revenue (undefined), by Application 2025 & 2033
- Figure 16: South America Full Gigabit Switches Volume (K), by Application 2025 & 2033
- Figure 17: South America Full Gigabit Switches Revenue Share (%), by Application 2025 & 2033
- Figure 18: South America Full Gigabit Switches Volume Share (%), by Application 2025 & 2033
- Figure 19: South America Full Gigabit Switches Revenue (undefined), by Types 2025 & 2033
- Figure 20: South America Full Gigabit Switches Volume (K), by Types 2025 & 2033
- Figure 21: South America Full Gigabit Switches Revenue Share (%), by Types 2025 & 2033
- Figure 22: South America Full Gigabit Switches Volume Share (%), by Types 2025 & 2033
- Figure 23: South America Full Gigabit Switches Revenue (undefined), by Country 2025 & 2033
- Figure 24: South America Full Gigabit Switches Volume (K), by Country 2025 & 2033
- Figure 25: South America Full Gigabit Switches Revenue Share (%), by Country 2025 & 2033
- Figure 26: South America Full Gigabit Switches Volume Share (%), by Country 2025 & 2033
- Figure 27: Europe Full Gigabit Switches Revenue (undefined), by Application 2025 & 2033
- Figure 28: Europe Full Gigabit Switches Volume (K), by Application 2025 & 2033
- Figure 29: Europe Full Gigabit Switches Revenue Share (%), by Application 2025 & 2033
- Figure 30: Europe Full Gigabit Switches Volume Share (%), by Application 2025 & 2033
- Figure 31: Europe Full Gigabit Switches Revenue (undefined), by Types 2025 & 2033
- Figure 32: Europe Full Gigabit Switches Volume (K), by Types 2025 & 2033
- Figure 33: Europe Full Gigabit Switches Revenue Share (%), by Types 2025 & 2033
- Figure 34: Europe Full Gigabit Switches Volume Share (%), by Types 2025 & 2033
- Figure 35: Europe Full Gigabit Switches Revenue (undefined), by Country 2025 & 2033
- Figure 36: Europe Full Gigabit Switches Volume (K), by Country 2025 & 2033
- Figure 37: Europe Full Gigabit Switches Revenue Share (%), by Country 2025 & 2033
- Figure 38: Europe Full Gigabit Switches Volume Share (%), by Country 2025 & 2033
- Figure 39: Middle East & Africa Full Gigabit Switches Revenue (undefined), by Application 2025 & 2033
- Figure 40: Middle East & Africa Full Gigabit Switches Volume (K), by Application 2025 & 2033
- Figure 41: Middle East & Africa Full Gigabit Switches Revenue Share (%), by Application 2025 & 2033
- Figure 42: Middle East & Africa Full Gigabit Switches Volume Share (%), by Application 2025 & 2033
- Figure 43: Middle East & Africa Full Gigabit Switches Revenue (undefined), by Types 2025 & 2033
- Figure 44: Middle East & Africa Full Gigabit Switches Volume (K), by Types 2025 & 2033
- Figure 45: Middle East & Africa Full Gigabit Switches Revenue Share (%), by Types 2025 & 2033
- Figure 46: Middle East & Africa Full Gigabit Switches Volume Share (%), by Types 2025 & 2033
- Figure 47: Middle East & Africa Full Gigabit Switches Revenue (undefined), by Country 2025 & 2033
- Figure 48: Middle East & Africa Full Gigabit Switches Volume (K), by Country 2025 & 2033
- Figure 49: Middle East & Africa Full Gigabit Switches Revenue Share (%), by Country 2025 & 2033
- Figure 50: Middle East & Africa Full Gigabit Switches Volume Share (%), by Country 2025 & 2033
- Figure 51: Asia Pacific Full Gigabit Switches Revenue (undefined), by Application 2025 & 2033
- Figure 52: Asia Pacific Full Gigabit Switches Volume (K), by Application 2025 & 2033
- Figure 53: Asia Pacific Full Gigabit Switches Revenue Share (%), by Application 2025 & 2033
- Figure 54: Asia Pacific Full Gigabit Switches Volume Share (%), by Application 2025 & 2033
- Figure 55: Asia Pacific Full Gigabit Switches Revenue (undefined), by Types 2025 & 2033
- Figure 56: Asia Pacific Full Gigabit Switches Volume (K), by Types 2025 & 2033
- Figure 57: Asia Pacific Full Gigabit Switches Revenue Share (%), by Types 2025 & 2033
- Figure 58: Asia Pacific Full Gigabit Switches Volume Share (%), by Types 2025 & 2033
- Figure 59: Asia Pacific Full Gigabit Switches Revenue (undefined), by Country 2025 & 2033
- Figure 60: Asia Pacific Full Gigabit Switches Volume (K), by Country 2025 & 2033
- Figure 61: Asia Pacific Full Gigabit Switches Revenue Share (%), by Country 2025 & 2033
- Figure 62: Asia Pacific Full Gigabit Switches Volume Share (%), by Country 2025 & 2033
List of Tables
- Table 1: Global Full Gigabit Switches Revenue undefined Forecast, by Application 2020 & 2033
- Table 2: Global Full Gigabit Switches Volume K Forecast, by Application 2020 & 2033
- Table 3: Global Full Gigabit Switches Revenue undefined Forecast, by Types 2020 & 2033
- Table 4: Global Full Gigabit Switches Volume K Forecast, by Types 2020 & 2033
- Table 5: Global Full Gigabit Switches Revenue undefined Forecast, by Region 2020 & 2033
- Table 6: Global Full Gigabit Switches Volume K Forecast, by Region 2020 & 2033
- Table 7: Global Full Gigabit Switches Revenue undefined Forecast, by Application 2020 & 2033
- Table 8: Global Full Gigabit Switches Volume K Forecast, by Application 2020 & 2033
- Table 9: Global Full Gigabit Switches Revenue undefined Forecast, by Types 2020 & 2033
- Table 10: Global Full Gigabit Switches Volume K Forecast, by Types 2020 & 2033
- Table 11: Global Full Gigabit Switches Revenue undefined Forecast, by Country 2020 & 2033
- Table 12: Global Full Gigabit Switches Volume K Forecast, by Country 2020 & 2033
- Table 13: United States Full Gigabit Switches Revenue (undefined) Forecast, by Application 2020 & 2033
- Table 14: United States Full Gigabit Switches Volume (K) Forecast, by Application 2020 & 2033
- Table 15: Canada Full Gigabit Switches Revenue (undefined) Forecast, by Application 2020 & 2033
- Table 16: Canada Full Gigabit Switches Volume (K) Forecast, by Application 2020 & 2033
- Table 17: Mexico Full Gigabit Switches Revenue (undefined) Forecast, by Application 2020 & 2033
- Table 18: Mexico Full Gigabit Switches Volume (K) Forecast, by Application 2020 & 2033
- Table 19: Global Full Gigabit Switches Revenue undefined Forecast, by Application 2020 & 2033
- Table 20: Global Full Gigabit Switches Volume K Forecast, by Application 2020 & 2033
- Table 21: Global Full Gigabit Switches Revenue undefined Forecast, by Types 2020 & 2033
- Table 22: Global Full Gigabit Switches Volume K Forecast, by Types 2020 & 2033
- Table 23: Global Full Gigabit Switches Revenue undefined Forecast, by Country 2020 & 2033
- Table 24: Global Full Gigabit Switches Volume K Forecast, by Country 2020 & 2033
- Table 25: Brazil Full Gigabit Switches Revenue (undefined) Forecast, by Application 2020 & 2033
- Table 26: Brazil Full Gigabit Switches Volume (K) Forecast, by Application 2020 & 2033
- Table 27: Argentina Full Gigabit Switches Revenue (undefined) Forecast, by Application 2020 & 2033
- Table 28: Argentina Full Gigabit Switches Volume (K) Forecast, by Application 2020 & 2033
- Table 29: Rest of South America Full Gigabit Switches Revenue (undefined) Forecast, by Application 2020 & 2033
- Table 30: Rest of South America Full Gigabit Switches Volume (K) Forecast, by Application 2020 & 2033
- Table 31: Global Full Gigabit Switches Revenue undefined Forecast, by Application 2020 & 2033
- Table 32: Global Full Gigabit Switches Volume K Forecast, by Application 2020 & 2033
- Table 33: Global Full Gigabit Switches Revenue undefined Forecast, by Types 2020 & 2033
- Table 34: Global Full Gigabit Switches Volume K Forecast, by Types 2020 & 2033
- Table 35: Global Full Gigabit Switches Revenue undefined Forecast, by Country 2020 & 2033
- Table 36: Global Full Gigabit Switches Volume K Forecast, by Country 2020 & 2033
- Table 37: United Kingdom Full Gigabit Switches Revenue (undefined) Forecast, by Application 2020 & 2033
- Table 38: United Kingdom Full Gigabit Switches Volume (K) Forecast, by Application 2020 & 2033
- Table 39: Germany Full Gigabit Switches Revenue (undefined) Forecast, by Application 2020 & 2033
- Table 40: Germany Full Gigabit Switches Volume (K) Forecast, by Application 2020 & 2033
- Table 41: France Full Gigabit Switches Revenue (undefined) Forecast, by Application 2020 & 2033
- Table 42: France Full Gigabit Switches Volume (K) Forecast, by Application 2020 & 2033
- Table 43: Italy Full Gigabit Switches Revenue (undefined) Forecast, by Application 2020 & 2033
- Table 44: Italy Full Gigabit Switches Volume (K) Forecast, by Application 2020 & 2033
- Table 45: Spain Full Gigabit Switches Revenue (undefined) Forecast, by Application 2020 & 2033
- Table 46: Spain Full Gigabit Switches Volume (K) Forecast, by Application 2020 & 2033
- Table 47: Russia Full Gigabit Switches Revenue (undefined) Forecast, by Application 2020 & 2033
- Table 48: Russia Full Gigabit Switches Volume (K) Forecast, by Application 2020 & 2033
- Table 49: Benelux Full Gigabit Switches Revenue (undefined) Forecast, by Application 2020 & 2033
- Table 50: Benelux Full Gigabit Switches Volume (K) Forecast, by Application 2020 & 2033
- Table 51: Nordics Full Gigabit Switches Revenue (undefined) Forecast, by Application 2020 & 2033
- Table 52: Nordics Full Gigabit Switches Volume (K) Forecast, by Application 2020 & 2033
- Table 53: Rest of Europe Full Gigabit Switches Revenue (undefined) Forecast, by Application 2020 & 2033
- Table 54: Rest of Europe Full Gigabit Switches Volume (K) Forecast, by Application 2020 & 2033
- Table 55: Global Full Gigabit Switches Revenue undefined Forecast, by Application 2020 & 2033
- Table 56: Global Full Gigabit Switches Volume K Forecast, by Application 2020 & 2033
- Table 57: Global Full Gigabit Switches Revenue undefined Forecast, by Types 2020 & 2033
- Table 58: Global Full Gigabit Switches Volume K Forecast, by Types 2020 & 2033
- Table 59: Global Full Gigabit Switches Revenue undefined Forecast, by Country 2020 & 2033
- Table 60: Global Full Gigabit Switches Volume K Forecast, by Country 2020 & 2033
- Table 61: Turkey Full Gigabit Switches Revenue (undefined) Forecast, by Application 2020 & 2033
- Table 62: Turkey Full Gigabit Switches Volume (K) Forecast, by Application 2020 & 2033
- Table 63: Israel Full Gigabit Switches Revenue (undefined) Forecast, by Application 2020 & 2033
- Table 64: Israel Full Gigabit Switches Volume (K) Forecast, by Application 2020 & 2033
- Table 65: GCC Full Gigabit Switches Revenue (undefined) Forecast, by Application 2020 & 2033
- Table 66: GCC Full Gigabit Switches Volume (K) Forecast, by Application 2020 & 2033
- Table 67: North Africa Full Gigabit Switches Revenue (undefined) Forecast, by Application 2020 & 2033
- Table 68: North Africa Full Gigabit Switches Volume (K) Forecast, by Application 2020 & 2033
- Table 69: South Africa Full Gigabit Switches Revenue (undefined) Forecast, by Application 2020 & 2033
- Table 70: South Africa Full Gigabit Switches Volume (K) Forecast, by Application 2020 & 2033
- Table 71: Rest of Middle East & Africa Full Gigabit Switches Revenue (undefined) Forecast, by Application 2020 & 2033
- Table 72: Rest of Middle East & Africa Full Gigabit Switches Volume (K) Forecast, by Application 2020 & 2033
- Table 73: Global Full Gigabit Switches Revenue undefined Forecast, by Application 2020 & 2033
- Table 74: Global Full Gigabit Switches Volume K Forecast, by Application 2020 & 2033
- Table 75: Global Full Gigabit Switches Revenue undefined Forecast, by Types 2020 & 2033
- Table 76: Global Full Gigabit Switches Volume K Forecast, by Types 2020 & 2033
- Table 77: Global Full Gigabit Switches Revenue undefined Forecast, by Country 2020 & 2033
- Table 78: Global Full Gigabit Switches Volume K Forecast, by Country 2020 & 2033
- Table 79: China Full Gigabit Switches Revenue (undefined) Forecast, by Application 2020 & 2033
- Table 80: China Full Gigabit Switches Volume (K) Forecast, by Application 2020 & 2033
- Table 81: India Full Gigabit Switches Revenue (undefined) Forecast, by Application 2020 & 2033
- Table 82: India Full Gigabit Switches Volume (K) Forecast, by Application 2020 & 2033
- Table 83: Japan Full Gigabit Switches Revenue (undefined) Forecast, by Application 2020 & 2033
- Table 84: Japan Full Gigabit Switches Volume (K) Forecast, by Application 2020 & 2033
- Table 85: South Korea Full Gigabit Switches Revenue (undefined) Forecast, by Application 2020 & 2033
- Table 86: South Korea Full Gigabit Switches Volume (K) Forecast, by Application 2020 & 2033
- Table 87: ASEAN Full Gigabit Switches Revenue (undefined) Forecast, by Application 2020 & 2033
- Table 88: ASEAN Full Gigabit Switches Volume (K) Forecast, by Application 2020 & 2033
- Table 89: Oceania Full Gigabit Switches Revenue (undefined) Forecast, by Application 2020 & 2033
- Table 90: Oceania Full Gigabit Switches Volume (K) Forecast, by Application 2020 & 2033
- Table 91: Rest of Asia Pacific Full Gigabit Switches Revenue (undefined) Forecast, by Application 2020 & 2033
- Table 92: Rest of Asia Pacific Full Gigabit Switches Volume (K) Forecast, by Application 2020 & 2033
Frequently Asked Questions
1. What is the projected Compound Annual Growth Rate (CAGR) of the Full Gigabit Switches?
The projected CAGR is approximately 7.1%.
2. Which companies are prominent players in the Full Gigabit Switches?
Key companies in the market include NETGEAR, TRENDnet, TP-Link Technologies, EnGenius Technologies, Cisco Systems, Aruba, Zyxel Networks, D-Link, CommScope.
3. What are the main segments of the Full Gigabit Switches?
The market segments include Application, Types.
4. Can you provide details about the market size?
The market size is estimated to be USD XXX N/A as of 2022.
5. What are some drivers contributing to market growth?
N/A
6. What are the notable trends driving market growth?
N/A
7. Are there any restraints impacting market growth?
N/A
8. Can you provide examples of recent developments in the market?
N/A
9. What pricing options are available for accessing the report?
Pricing options include single-user, multi-user, and enterprise licenses priced at USD 3950.00, USD 5925.00, and USD 7900.00 respectively.
10. Is the market size provided in terms of value or volume?
The market size is provided in terms of value, measured in N/A and volume, measured in K.
11. Are there any specific market keywords associated with the report?
Yes, the market keyword associated with the report is "Full Gigabit Switches," which aids in identifying and referencing the specific market segment covered.
12. How do I determine which pricing option suits my needs best?
The pricing options vary based on user requirements and access needs. Individual users may opt for single-user licenses, while businesses requiring broader access may choose multi-user or enterprise licenses for cost-effective access to the report.
13. Are there any additional resources or data provided in the Full Gigabit Switches report?
While the report offers comprehensive insights, it's advisable to review the specific contents or supplementary materials provided to ascertain if additional resources or data are available.
14. How can I stay updated on further developments or reports in the Full Gigabit Switches?
To stay informed about further developments, trends, and reports in the Full Gigabit Switches, consider subscribing to industry newsletters, following relevant companies and organizations, or regularly checking reputable industry news sources and publications.
Methodology
Step 1 - Identification of Relevant Samples Size from Population Database


Step 2 - Approaches for Defining Global Market Size (Value, Volume* & Price*)

Note*: In applicable scenarios
Step 3 - Data Sources
Primary Research
- Web Analytics
- Survey Reports
- Research Institute
- Latest Research Reports
- Opinion Leaders
Secondary Research
- Annual Reports
- White Paper
- Latest Press Release
- Industry Association
- Paid Database
- Investor Presentations

Step 4 - Data Triangulation
Involves using different sources of information in order to increase the validity of a study
These sources are likely to be stakeholders in a program - participants, other researchers, program staff, other community members, and so on.
Then we put all data in single framework & apply various statistical tools to find out the dynamic on the market.
During the analysis stage, feedback from the stakeholder groups would be compared to determine areas of agreement as well as areas of divergence