
Key Insights
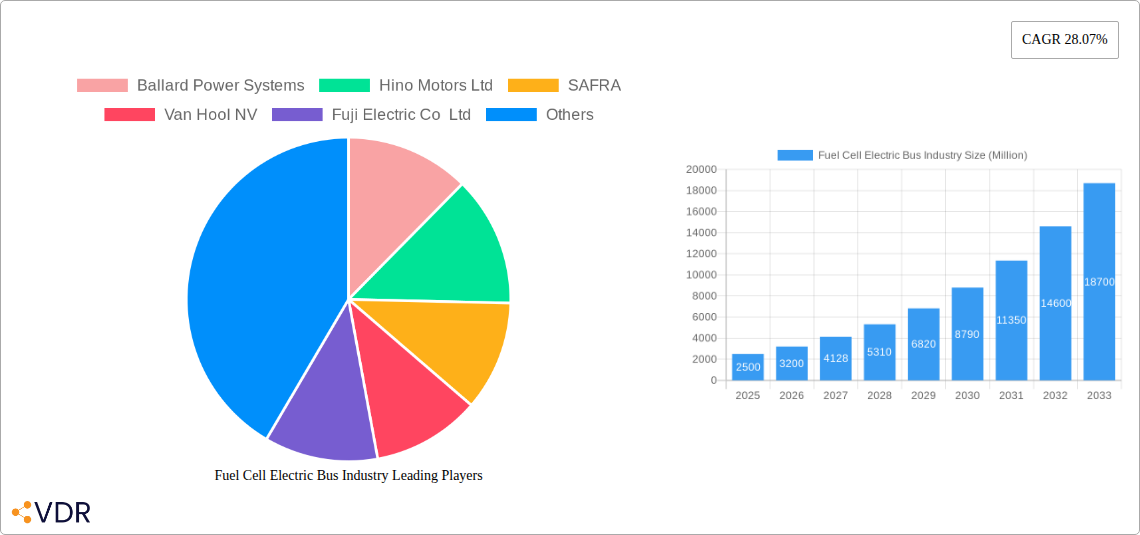
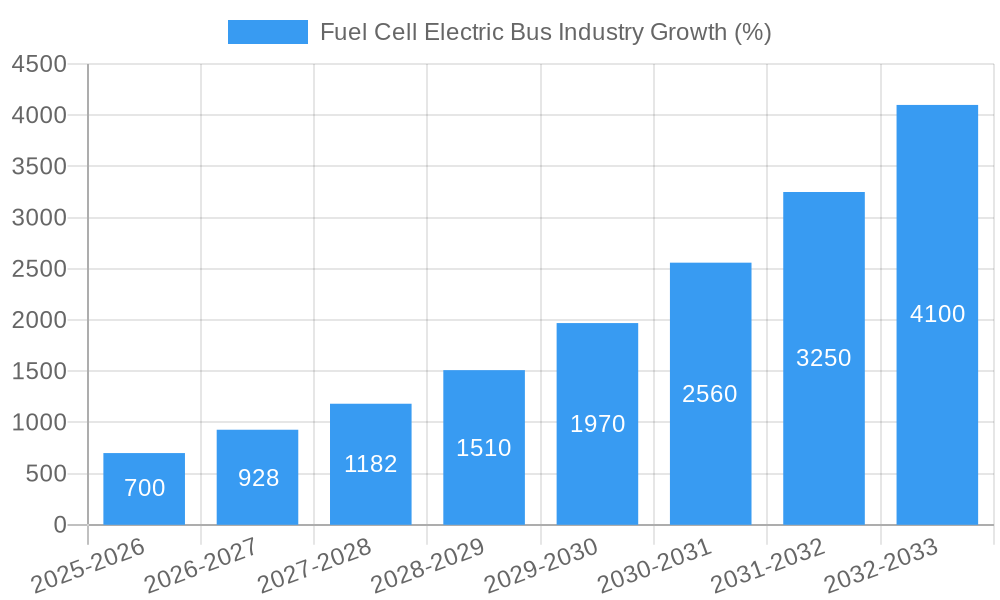
The fuel cell electric bus (FCEB) market is experiencing robust growth, driven by increasing environmental concerns, stringent emission regulations, and the pursuit of sustainable public transportation. A compound annual growth rate (CAGR) of 28.07% from 2019-2033 indicates a significant market expansion. This growth is fueled by several key factors: the rising adoption of hydrogen fuel cell technology as a cleaner alternative to diesel buses, government incentives and subsidies promoting the deployment of zero-emission vehicles, and advancements in fuel cell technology leading to improved efficiency and cost reductions. The market segmentation reveals a dynamic landscape, with both intercity and intracity applications contributing significantly to overall demand. The distinction between new hydrogen buses and retrofitted hydrogen buses highlights different approaches to market penetration, with new builds potentially dominating due to optimized design and integration, while retrofitting offers a pathway for existing fleets to transition to cleaner technologies. Major players like Ballard Power Systems, Hino Motors, and others are actively shaping the market through technological innovation and strategic partnerships. The regional distribution reflects varied adoption rates, with North America and Europe likely leading initially due to established infrastructure and supportive policies, while Asia-Pacific is poised for significant growth in the coming years.
The competitive landscape is characterized by a mix of established automotive manufacturers, fuel cell technology providers, and specialized bus manufacturers. Successful players will need to focus on technological advancements, cost competitiveness, and the development of comprehensive hydrogen infrastructure to support the wider adoption of FCEBs. Challenges remain, including the high initial investment costs associated with fuel cell technology, the limited availability of hydrogen refueling stations, and the need for robust safety standards. However, ongoing research and development, coupled with supportive government policies, are expected to address these challenges and pave the way for continued market expansion. The forecast period (2025-2033) will likely see a substantial increase in FCEB deployment, transforming public transportation landscapes globally and contributing to the overall decarbonization efforts in the transportation sector. The market is expected to see a significant shift towards larger scale deployment as technology matures and infrastructure develops.
Fuel Cell Electric Bus Industry: A Comprehensive Market Report (2019-2033)
This comprehensive report provides an in-depth analysis of the Fuel Cell Electric Bus (FCEB) industry, encompassing market dynamics, growth trends, regional dominance, product landscape, key players, and future outlook. The study period covers 2019-2033, with a base year of 2025 and a forecast period of 2025-2033. The report delves into both parent markets (electric bus market) and child markets (hydrogen fuel cell technology, bus manufacturing) to offer a holistic perspective. The total market size is projected to reach xx Million units by 2033.
Fuel Cell Electric Bus Industry Market Dynamics & Structure
The FCEB market is characterized by moderate concentration, with key players like Ballard Power Systems, Hino Motors Ltd, and others actively shaping the landscape. Technological innovation, particularly in fuel cell efficiency and hydrogen storage, is a crucial driver. Stringent emission regulations globally are pushing adoption, while the availability of competitive, cleaner-energy alternatives like battery-electric buses presents a significant challenge. End-user demographics – primarily urban transit authorities and private operators – are evolving, prioritizing sustainability and cost-effectiveness. M&A activity in the sector is expected to remain moderate, with strategic partnerships focusing on technology integration and market expansion.
- Market Concentration: Moderately concentrated, with top 5 players holding xx% market share (2025).
- Technological Innovation: Focus on improving fuel cell durability, reducing hydrogen storage costs, and enhancing energy density.
- Regulatory Framework: Stringent emission norms in major markets are driving demand for zero-emission buses.
- Competitive Substitutes: Battery electric buses (BEBs) pose significant competition.
- End-User Demographics: Primarily urban transit authorities and private bus operators, increasingly focused on sustainability and Total Cost of Ownership (TCO).
- M&A Trends: Moderate level of activity, primarily focused on technology licensing and joint ventures.
Fuel Cell Electric Bus Industry Growth Trends & Insights
The FCEB market is experiencing significant growth, driven by increasing environmental concerns and government support for clean transportation initiatives. From 2019 to 2024, the market witnessed a Compound Annual Growth Rate (CAGR) of xx%, with a projected CAGR of xx% from 2025 to 2033. Market penetration is expected to increase from xx% in 2025 to xx% by 2033, driven by advancements in fuel cell technology, falling hydrogen production costs, and the expansion of hydrogen refueling infrastructure. Technological disruptions, such as advancements in solid-oxide fuel cells (SOFCs), will shape future growth trajectories. Shifting consumer preferences toward sustainable transportation solutions further bolster market expansion.
Dominant Regions, Countries, or Segments in Fuel Cell Electric Bus Industry
The FCEB market is showing significant growth across regions, with Europe and certain regions of Asia leading the way due to proactive government support and substantial funding for hydrogen infrastructure development. Within the application segments, intracity bus operations represent the largest market share currently, however, the intercity segment is projected to experience faster growth, driven by increasing long-haul transportation needs.
- Leading Region: Europe, driven by strong government incentives and early adoption of hydrogen technologies.
- Leading Application: Intracity, currently holding the largest market share.
- Fastest Growing Application: Intercity, fueled by increasing long-distance transportation requirements and improvements in fuel cell range.
- Leading Bus Type: New hydrogen buses currently dominate the market, though retrofitted buses offer a potential avenue for growth.
- Key Drivers: Government subsidies and tax incentives, stringent emission regulations, and growing public awareness of environmental issues.
Fuel Cell Electric Bus Industry Product Landscape
The FCEB market features a diverse range of bus models, with ongoing innovations focusing on increased fuel efficiency, extended driving ranges, and reduced refueling time. Manufacturers are developing high-capacity fuel cell modules and optimized hydrogen storage systems to enhance performance. Key product differentiation strategies include superior energy density, advanced safety features, and lower lifecycle costs. This has increased competitive advantage for the major players.
Key Drivers, Barriers & Challenges in Fuel Cell Electric Bus Industry
Key Drivers:
- Growing environmental concerns and stringent emission regulations.
- Government incentives and subsidies for clean transportation.
- Advancements in fuel cell technology, leading to increased efficiency and reduced costs.
Challenges:
- High initial investment costs associated with FCEBs and hydrogen infrastructure.
- Limited availability of hydrogen refueling stations, hindering widespread adoption.
- Competition from battery-electric buses and other alternative fuels.
- Supply chain vulnerabilities related to the availability of rare earth metals.
- This may lead to 20% production decline in the near future.
Emerging Opportunities in Fuel Cell Electric Bus Industry
Emerging opportunities lie in expanding the market into developing economies, focusing on targeted applications such as airport transit and intercity routes with longer ranges. The development of innovative business models, such as fuel-cell-as-a-service, could stimulate wider adoption. Additionally, the increasing integration of smart technologies and data analytics into FCEBs presents further growth potential.
Growth Accelerators in the Fuel Cell Electric Bus Industry
Long-term growth will be propelled by continued technological advancements, including improvements in fuel cell durability and hydrogen storage technologies. Strategic partnerships between fuel cell manufacturers, bus builders, and energy providers will create a robust ecosystem for FCEB deployment. Government policies promoting hydrogen infrastructure development and investment in research and development are pivotal growth catalysts.
Key Players Shaping the Fuel Cell Electric Bus Industry Market
- Ballard Power Systems
- Hino Motors Ltd
- SAFRA
- Van Hool NV
- Fuji Electric Co Ltd
- IVECO Group
- EvoBus GmbH
- NovaBus Corporation
- Tata Motors Limited
- MAN Truck & Bus SE
- SunLine Transit Agency
- New Flyer Industries Ltd
- Cummins Inc
- Proton Motor Fuel Cell GmbH
- Nuvera Fuel Cells LLC
Notable Milestones in Fuel Cell Electric Bus Industry Sector
- September 2022: New Flyer unveiled the Xcelsior CHARGE FC fuel cell bus, featuring a Ballard Power Systems fuel cell module.
- September 2022: Guangdong Sino-Synergy Hydrogen Technology Co., Ltd. introduced the first "Hydrogen Fuel Cell Journey Coach" in Europe.
- September 2022: Marcopolo showcased its first hydrogen-powered bus at IAA Transportation 2022.
In-Depth Fuel Cell Electric Bus Industry Market Outlook
The FCEB market holds significant future potential, driven by the increasing urgency to decarbonize public transportation. Strategic opportunities exist in developing innovative business models, expanding hydrogen infrastructure, and fostering international collaborations. Further technological advancements, particularly in fuel cell efficiency and cost reduction, are crucial to accelerating market penetration and achieving widespread adoption. The market is poised for substantial growth in the next decade, offering attractive investment prospects for stakeholders across the value chain.
Fuel Cell Electric Bus Industry Segmentation
-
1. Application
- 1.1. Intercity
- 1.2. Intracity
-
2. Bus Type
- 2.1. New Hydrogen Buses
- 2.2. Retrofitted Hydrogen Buses
Fuel Cell Electric Bus Industry Segmentation By Geography
-
1. North America
- 1.1. United States
- 1.2. Canada
- 1.3. Mexico
- 1.4. Rest of North America
-
2. Europe
- 2.1. Germany
- 2.2. United Kingdom
- 2.3. France
- 2.4. Italy
- 2.5. Spain
- 2.6. Rest of Europe
-
3. Asia Pacific
- 3.1. India
- 3.2. China
- 3.3. South Korea
- 3.4. Japan
- 3.5. Rest of Asia Pacific
-
4. Rest of the World
- 4.1. South America
- 4.2. Middle East and Africa

Fuel Cell Electric Bus Industry REPORT HIGHLIGHTS
| Aspects | Details |
|---|---|
| Study Period | 2019-2033 |
| Base Year | 2024 |
| Estimated Year | 2025 |
| Forecast Period | 2025-2033 |
| Historical Period | 2019-2024 |
| Growth Rate | CAGR of 28.07% from 2019-2033 |
| Segmentation |
|
Table of Contents
- 1. Introduction
- 1.1. Research Scope
- 1.2. Market Segmentation
- 1.3. Research Methodology
- 1.4. Definitions and Assumptions
- 2. Executive Summary
- 2.1. Introduction
- 3. Market Dynamics
- 3.1. Introduction
- 3.2. Market Drivers
- 3.2.1. Increase in Passenger Car Sales Propelling Market Growth
- 3.3. Market Restrains
- 3.3.1. Fluctuation in Raw Material Prices
- 3.4. Market Trends
- 3.4.1. Emission Concerns and Increasing Hydrogen Bus Testing Fueling Market Demand
- 4. Market Factor Analysis
- 4.1. Porters Five Forces
- 4.2. Supply/Value Chain
- 4.3. PESTEL analysis
- 4.4. Market Entropy
- 4.5. Patent/Trademark Analysis
- 5. Global Fuel Cell Electric Bus Industry Analysis, Insights and Forecast, 2019-2031
- 5.1. Market Analysis, Insights and Forecast - by Application
- 5.1.1. Intercity
- 5.1.2. Intracity
- 5.2. Market Analysis, Insights and Forecast - by Bus Type
- 5.2.1. New Hydrogen Buses
- 5.2.2. Retrofitted Hydrogen Buses
- 5.3. Market Analysis, Insights and Forecast - by Region
- 5.3.1. North America
- 5.3.2. Europe
- 5.3.3. Asia Pacific
- 5.3.4. Rest of the World
- 5.1. Market Analysis, Insights and Forecast - by Application
- 6. North America Fuel Cell Electric Bus Industry Analysis, Insights and Forecast, 2019-2031
- 6.1. Market Analysis, Insights and Forecast - by Application
- 6.1.1. Intercity
- 6.1.2. Intracity
- 6.2. Market Analysis, Insights and Forecast - by Bus Type
- 6.2.1. New Hydrogen Buses
- 6.2.2. Retrofitted Hydrogen Buses
- 6.1. Market Analysis, Insights and Forecast - by Application
- 7. Europe Fuel Cell Electric Bus Industry Analysis, Insights and Forecast, 2019-2031
- 7.1. Market Analysis, Insights and Forecast - by Application
- 7.1.1. Intercity
- 7.1.2. Intracity
- 7.2. Market Analysis, Insights and Forecast - by Bus Type
- 7.2.1. New Hydrogen Buses
- 7.2.2. Retrofitted Hydrogen Buses
- 7.1. Market Analysis, Insights and Forecast - by Application
- 8. Asia Pacific Fuel Cell Electric Bus Industry Analysis, Insights and Forecast, 2019-2031
- 8.1. Market Analysis, Insights and Forecast - by Application
- 8.1.1. Intercity
- 8.1.2. Intracity
- 8.2. Market Analysis, Insights and Forecast - by Bus Type
- 8.2.1. New Hydrogen Buses
- 8.2.2. Retrofitted Hydrogen Buses
- 8.1. Market Analysis, Insights and Forecast - by Application
- 9. Rest of the World Fuel Cell Electric Bus Industry Analysis, Insights and Forecast, 2019-2031
- 9.1. Market Analysis, Insights and Forecast - by Application
- 9.1.1. Intercity
- 9.1.2. Intracity
- 9.2. Market Analysis, Insights and Forecast - by Bus Type
- 9.2.1. New Hydrogen Buses
- 9.2.2. Retrofitted Hydrogen Buses
- 9.1. Market Analysis, Insights and Forecast - by Application
- 10. North America Fuel Cell Electric Bus Industry Analysis, Insights and Forecast, 2019-2031
- 10.1. Market Analysis, Insights and Forecast - By Country/Sub-region
- 10.1.1 United States
- 10.1.2 Canada
- 10.1.3 Mexico
- 10.1.4 Rest of North America
- 11. Europe Fuel Cell Electric Bus Industry Analysis, Insights and Forecast, 2019-2031
- 11.1. Market Analysis, Insights and Forecast - By Country/Sub-region
- 11.1.1 Germany
- 11.1.2 United Kingdom
- 11.1.3 France
- 11.1.4 Italy
- 11.1.5 Spain
- 11.1.6 Rest of Europe
- 12. Asia Pacific Fuel Cell Electric Bus Industry Analysis, Insights and Forecast, 2019-2031
- 12.1. Market Analysis, Insights and Forecast - By Country/Sub-region
- 12.1.1 India
- 12.1.2 China
- 12.1.3 South Korea
- 12.1.4 Japan
- 12.1.5 Rest of Asia Pacific
- 13. Rest of the World Fuel Cell Electric Bus Industry Analysis, Insights and Forecast, 2019-2031
- 13.1. Market Analysis, Insights and Forecast - By Country/Sub-region
- 13.1.1 South America
- 13.1.2 Middle East and Africa
- 14. Competitive Analysis
- 14.1. Global Market Share Analysis 2024
- 14.2. Company Profiles
- 14.2.1 Ballard Power Systems
- 14.2.1.1. Overview
- 14.2.1.2. Products
- 14.2.1.3. SWOT Analysis
- 14.2.1.4. Recent Developments
- 14.2.1.5. Financials (Based on Availability)
- 14.2.2 Hino Motors Ltd
- 14.2.2.1. Overview
- 14.2.2.2. Products
- 14.2.2.3. SWOT Analysis
- 14.2.2.4. Recent Developments
- 14.2.2.5. Financials (Based on Availability)
- 14.2.3 SAFRA
- 14.2.3.1. Overview
- 14.2.3.2. Products
- 14.2.3.3. SWOT Analysis
- 14.2.3.4. Recent Developments
- 14.2.3.5. Financials (Based on Availability)
- 14.2.4 Van Hool NV
- 14.2.4.1. Overview
- 14.2.4.2. Products
- 14.2.4.3. SWOT Analysis
- 14.2.4.4. Recent Developments
- 14.2.4.5. Financials (Based on Availability)
- 14.2.5 Fuji Electric Co Ltd
- 14.2.5.1. Overview
- 14.2.5.2. Products
- 14.2.5.3. SWOT Analysis
- 14.2.5.4. Recent Developments
- 14.2.5.5. Financials (Based on Availability)
- 14.2.6 IVECO Group
- 14.2.6.1. Overview
- 14.2.6.2. Products
- 14.2.6.3. SWOT Analysis
- 14.2.6.4. Recent Developments
- 14.2.6.5. Financials (Based on Availability)
- 14.2.7 EvoBus GmbH
- 14.2.7.1. Overview
- 14.2.7.2. Products
- 14.2.7.3. SWOT Analysis
- 14.2.7.4. Recent Developments
- 14.2.7.5. Financials (Based on Availability)
- 14.2.8 NovaBus Corporation
- 14.2.8.1. Overview
- 14.2.8.2. Products
- 14.2.8.3. SWOT Analysis
- 14.2.8.4. Recent Developments
- 14.2.8.5. Financials (Based on Availability)
- 14.2.9 Tata Motors Limited
- 14.2.9.1. Overview
- 14.2.9.2. Products
- 14.2.9.3. SWOT Analysis
- 14.2.9.4. Recent Developments
- 14.2.9.5. Financials (Based on Availability)
- 14.2.10 MAN Truck & Bus SE
- 14.2.10.1. Overview
- 14.2.10.2. Products
- 14.2.10.3. SWOT Analysis
- 14.2.10.4. Recent Developments
- 14.2.10.5. Financials (Based on Availability)
- 14.2.11 SunLine Transit Agency *List Not Exhaustive
- 14.2.11.1. Overview
- 14.2.11.2. Products
- 14.2.11.3. SWOT Analysis
- 14.2.11.4. Recent Developments
- 14.2.11.5. Financials (Based on Availability)
- 14.2.12 New Flyer Industries Ltd
- 14.2.12.1. Overview
- 14.2.12.2. Products
- 14.2.12.3. SWOT Analysis
- 14.2.12.4. Recent Developments
- 14.2.12.5. Financials (Based on Availability)
- 14.2.13 Cummins Inc
- 14.2.13.1. Overview
- 14.2.13.2. Products
- 14.2.13.3. SWOT Analysis
- 14.2.13.4. Recent Developments
- 14.2.13.5. Financials (Based on Availability)
- 14.2.14 Proton Motor Fuel Cell GmbH
- 14.2.14.1. Overview
- 14.2.14.2. Products
- 14.2.14.3. SWOT Analysis
- 14.2.14.4. Recent Developments
- 14.2.14.5. Financials (Based on Availability)
- 14.2.15 Nuvera Fuel Cells LLC
- 14.2.15.1. Overview
- 14.2.15.2. Products
- 14.2.15.3. SWOT Analysis
- 14.2.15.4. Recent Developments
- 14.2.15.5. Financials (Based on Availability)
- 14.2.1 Ballard Power Systems
List of Figures
- Figure 1: Global Fuel Cell Electric Bus Industry Revenue Breakdown (Million, %) by Region 2024 & 2032
- Figure 2: North America Fuel Cell Electric Bus Industry Revenue (Million), by Country 2024 & 2032
- Figure 3: North America Fuel Cell Electric Bus Industry Revenue Share (%), by Country 2024 & 2032
- Figure 4: Europe Fuel Cell Electric Bus Industry Revenue (Million), by Country 2024 & 2032
- Figure 5: Europe Fuel Cell Electric Bus Industry Revenue Share (%), by Country 2024 & 2032
- Figure 6: Asia Pacific Fuel Cell Electric Bus Industry Revenue (Million), by Country 2024 & 2032
- Figure 7: Asia Pacific Fuel Cell Electric Bus Industry Revenue Share (%), by Country 2024 & 2032
- Figure 8: Rest of the World Fuel Cell Electric Bus Industry Revenue (Million), by Country 2024 & 2032
- Figure 9: Rest of the World Fuel Cell Electric Bus Industry Revenue Share (%), by Country 2024 & 2032
- Figure 10: North America Fuel Cell Electric Bus Industry Revenue (Million), by Application 2024 & 2032
- Figure 11: North America Fuel Cell Electric Bus Industry Revenue Share (%), by Application 2024 & 2032
- Figure 12: North America Fuel Cell Electric Bus Industry Revenue (Million), by Bus Type 2024 & 2032
- Figure 13: North America Fuel Cell Electric Bus Industry Revenue Share (%), by Bus Type 2024 & 2032
- Figure 14: North America Fuel Cell Electric Bus Industry Revenue (Million), by Country 2024 & 2032
- Figure 15: North America Fuel Cell Electric Bus Industry Revenue Share (%), by Country 2024 & 2032
- Figure 16: Europe Fuel Cell Electric Bus Industry Revenue (Million), by Application 2024 & 2032
- Figure 17: Europe Fuel Cell Electric Bus Industry Revenue Share (%), by Application 2024 & 2032
- Figure 18: Europe Fuel Cell Electric Bus Industry Revenue (Million), by Bus Type 2024 & 2032
- Figure 19: Europe Fuel Cell Electric Bus Industry Revenue Share (%), by Bus Type 2024 & 2032
- Figure 20: Europe Fuel Cell Electric Bus Industry Revenue (Million), by Country 2024 & 2032
- Figure 21: Europe Fuel Cell Electric Bus Industry Revenue Share (%), by Country 2024 & 2032
- Figure 22: Asia Pacific Fuel Cell Electric Bus Industry Revenue (Million), by Application 2024 & 2032
- Figure 23: Asia Pacific Fuel Cell Electric Bus Industry Revenue Share (%), by Application 2024 & 2032
- Figure 24: Asia Pacific Fuel Cell Electric Bus Industry Revenue (Million), by Bus Type 2024 & 2032
- Figure 25: Asia Pacific Fuel Cell Electric Bus Industry Revenue Share (%), by Bus Type 2024 & 2032
- Figure 26: Asia Pacific Fuel Cell Electric Bus Industry Revenue (Million), by Country 2024 & 2032
- Figure 27: Asia Pacific Fuel Cell Electric Bus Industry Revenue Share (%), by Country 2024 & 2032
- Figure 28: Rest of the World Fuel Cell Electric Bus Industry Revenue (Million), by Application 2024 & 2032
- Figure 29: Rest of the World Fuel Cell Electric Bus Industry Revenue Share (%), by Application 2024 & 2032
- Figure 30: Rest of the World Fuel Cell Electric Bus Industry Revenue (Million), by Bus Type 2024 & 2032
- Figure 31: Rest of the World Fuel Cell Electric Bus Industry Revenue Share (%), by Bus Type 2024 & 2032
- Figure 32: Rest of the World Fuel Cell Electric Bus Industry Revenue (Million), by Country 2024 & 2032
- Figure 33: Rest of the World Fuel Cell Electric Bus Industry Revenue Share (%), by Country 2024 & 2032
List of Tables
- Table 1: Global Fuel Cell Electric Bus Industry Revenue Million Forecast, by Region 2019 & 2032
- Table 2: Global Fuel Cell Electric Bus Industry Revenue Million Forecast, by Application 2019 & 2032
- Table 3: Global Fuel Cell Electric Bus Industry Revenue Million Forecast, by Bus Type 2019 & 2032
- Table 4: Global Fuel Cell Electric Bus Industry Revenue Million Forecast, by Region 2019 & 2032
- Table 5: Global Fuel Cell Electric Bus Industry Revenue Million Forecast, by Country 2019 & 2032
- Table 6: United States Fuel Cell Electric Bus Industry Revenue (Million) Forecast, by Application 2019 & 2032
- Table 7: Canada Fuel Cell Electric Bus Industry Revenue (Million) Forecast, by Application 2019 & 2032
- Table 8: Mexico Fuel Cell Electric Bus Industry Revenue (Million) Forecast, by Application 2019 & 2032
- Table 9: Rest of North America Fuel Cell Electric Bus Industry Revenue (Million) Forecast, by Application 2019 & 2032
- Table 10: Global Fuel Cell Electric Bus Industry Revenue Million Forecast, by Country 2019 & 2032
- Table 11: Germany Fuel Cell Electric Bus Industry Revenue (Million) Forecast, by Application 2019 & 2032
- Table 12: United Kingdom Fuel Cell Electric Bus Industry Revenue (Million) Forecast, by Application 2019 & 2032
- Table 13: France Fuel Cell Electric Bus Industry Revenue (Million) Forecast, by Application 2019 & 2032
- Table 14: Italy Fuel Cell Electric Bus Industry Revenue (Million) Forecast, by Application 2019 & 2032
- Table 15: Spain Fuel Cell Electric Bus Industry Revenue (Million) Forecast, by Application 2019 & 2032
- Table 16: Rest of Europe Fuel Cell Electric Bus Industry Revenue (Million) Forecast, by Application 2019 & 2032
- Table 17: Global Fuel Cell Electric Bus Industry Revenue Million Forecast, by Country 2019 & 2032
- Table 18: India Fuel Cell Electric Bus Industry Revenue (Million) Forecast, by Application 2019 & 2032
- Table 19: China Fuel Cell Electric Bus Industry Revenue (Million) Forecast, by Application 2019 & 2032
- Table 20: South Korea Fuel Cell Electric Bus Industry Revenue (Million) Forecast, by Application 2019 & 2032
- Table 21: Japan Fuel Cell Electric Bus Industry Revenue (Million) Forecast, by Application 2019 & 2032
- Table 22: Rest of Asia Pacific Fuel Cell Electric Bus Industry Revenue (Million) Forecast, by Application 2019 & 2032
- Table 23: Global Fuel Cell Electric Bus Industry Revenue Million Forecast, by Country 2019 & 2032
- Table 24: South America Fuel Cell Electric Bus Industry Revenue (Million) Forecast, by Application 2019 & 2032
- Table 25: Middle East and Africa Fuel Cell Electric Bus Industry Revenue (Million) Forecast, by Application 2019 & 2032
- Table 26: Global Fuel Cell Electric Bus Industry Revenue Million Forecast, by Application 2019 & 2032
- Table 27: Global Fuel Cell Electric Bus Industry Revenue Million Forecast, by Bus Type 2019 & 2032
- Table 28: Global Fuel Cell Electric Bus Industry Revenue Million Forecast, by Country 2019 & 2032
- Table 29: United States Fuel Cell Electric Bus Industry Revenue (Million) Forecast, by Application 2019 & 2032
- Table 30: Canada Fuel Cell Electric Bus Industry Revenue (Million) Forecast, by Application 2019 & 2032
- Table 31: Mexico Fuel Cell Electric Bus Industry Revenue (Million) Forecast, by Application 2019 & 2032
- Table 32: Rest of North America Fuel Cell Electric Bus Industry Revenue (Million) Forecast, by Application 2019 & 2032
- Table 33: Global Fuel Cell Electric Bus Industry Revenue Million Forecast, by Application 2019 & 2032
- Table 34: Global Fuel Cell Electric Bus Industry Revenue Million Forecast, by Bus Type 2019 & 2032
- Table 35: Global Fuel Cell Electric Bus Industry Revenue Million Forecast, by Country 2019 & 2032
- Table 36: Germany Fuel Cell Electric Bus Industry Revenue (Million) Forecast, by Application 2019 & 2032
- Table 37: United Kingdom Fuel Cell Electric Bus Industry Revenue (Million) Forecast, by Application 2019 & 2032
- Table 38: France Fuel Cell Electric Bus Industry Revenue (Million) Forecast, by Application 2019 & 2032
- Table 39: Italy Fuel Cell Electric Bus Industry Revenue (Million) Forecast, by Application 2019 & 2032
- Table 40: Spain Fuel Cell Electric Bus Industry Revenue (Million) Forecast, by Application 2019 & 2032
- Table 41: Rest of Europe Fuel Cell Electric Bus Industry Revenue (Million) Forecast, by Application 2019 & 2032
- Table 42: Global Fuel Cell Electric Bus Industry Revenue Million Forecast, by Application 2019 & 2032
- Table 43: Global Fuel Cell Electric Bus Industry Revenue Million Forecast, by Bus Type 2019 & 2032
- Table 44: Global Fuel Cell Electric Bus Industry Revenue Million Forecast, by Country 2019 & 2032
- Table 45: India Fuel Cell Electric Bus Industry Revenue (Million) Forecast, by Application 2019 & 2032
- Table 46: China Fuel Cell Electric Bus Industry Revenue (Million) Forecast, by Application 2019 & 2032
- Table 47: South Korea Fuel Cell Electric Bus Industry Revenue (Million) Forecast, by Application 2019 & 2032
- Table 48: Japan Fuel Cell Electric Bus Industry Revenue (Million) Forecast, by Application 2019 & 2032
- Table 49: Rest of Asia Pacific Fuel Cell Electric Bus Industry Revenue (Million) Forecast, by Application 2019 & 2032
- Table 50: Global Fuel Cell Electric Bus Industry Revenue Million Forecast, by Application 2019 & 2032
- Table 51: Global Fuel Cell Electric Bus Industry Revenue Million Forecast, by Bus Type 2019 & 2032
- Table 52: Global Fuel Cell Electric Bus Industry Revenue Million Forecast, by Country 2019 & 2032
- Table 53: South America Fuel Cell Electric Bus Industry Revenue (Million) Forecast, by Application 2019 & 2032
- Table 54: Middle East and Africa Fuel Cell Electric Bus Industry Revenue (Million) Forecast, by Application 2019 & 2032
Frequently Asked Questions
1. What is the projected Compound Annual Growth Rate (CAGR) of the Fuel Cell Electric Bus Industry?
The projected CAGR is approximately 28.07%.
2. Which companies are prominent players in the Fuel Cell Electric Bus Industry?
Key companies in the market include Ballard Power Systems, Hino Motors Ltd, SAFRA, Van Hool NV, Fuji Electric Co Ltd, IVECO Group, EvoBus GmbH, NovaBus Corporation, Tata Motors Limited, MAN Truck & Bus SE, SunLine Transit Agency *List Not Exhaustive, New Flyer Industries Ltd, Cummins Inc, Proton Motor Fuel Cell GmbH, Nuvera Fuel Cells LLC.
3. What are the main segments of the Fuel Cell Electric Bus Industry?
The market segments include Application, Bus Type.
4. Can you provide details about the market size?
The market size is estimated to be USD XX Million as of 2022.
5. What are some drivers contributing to market growth?
Increase in Passenger Car Sales Propelling Market Growth.
6. What are the notable trends driving market growth?
Emission Concerns and Increasing Hydrogen Bus Testing Fueling Market Demand.
7. Are there any restraints impacting market growth?
Fluctuation in Raw Material Prices.
8. Can you provide examples of recent developments in the market?
In September 2022, The Xcelsior CHARGE FC fuel cell bus model from New Flyer, which features a fuel cell module from Ballard Power Systems and a Siemens ELFA 3 driveline, was unveiled . The model is similar to the Xcelsior CHARGE H2, and it comes in both 40-foot and 60-foot lengths. Both of these models pass the Federal Transit Administration Model Bus Testing Program in Altoona, Pennsylvania.
9. What pricing options are available for accessing the report?
Pricing options include single-user, multi-user, and enterprise licenses priced at USD 4750, USD 5250, and USD 8750 respectively.
10. Is the market size provided in terms of value or volume?
The market size is provided in terms of value, measured in Million.
11. Are there any specific market keywords associated with the report?
Yes, the market keyword associated with the report is "Fuel Cell Electric Bus Industry," which aids in identifying and referencing the specific market segment covered.
12. How do I determine which pricing option suits my needs best?
The pricing options vary based on user requirements and access needs. Individual users may opt for single-user licenses, while businesses requiring broader access may choose multi-user or enterprise licenses for cost-effective access to the report.
13. Are there any additional resources or data provided in the Fuel Cell Electric Bus Industry report?
While the report offers comprehensive insights, it's advisable to review the specific contents or supplementary materials provided to ascertain if additional resources or data are available.
14. How can I stay updated on further developments or reports in the Fuel Cell Electric Bus Industry?
To stay informed about further developments, trends, and reports in the Fuel Cell Electric Bus Industry, consider subscribing to industry newsletters, following relevant companies and organizations, or regularly checking reputable industry news sources and publications.
Methodology
Step 1 - Identification of Relevant Samples Size from Population Database


Step 2 - Approaches for Defining Global Market Size (Value, Volume* & Price*)

Note*: In applicable scenarios
Step 3 - Data Sources
Primary Research
- Web Analytics
- Survey Reports
- Research Institute
- Latest Research Reports
- Opinion Leaders
Secondary Research
- Annual Reports
- White Paper
- Latest Press Release
- Industry Association
- Paid Database
- Investor Presentations

Step 4 - Data Triangulation
Involves using different sources of information in order to increase the validity of a study
These sources are likely to be stakeholders in a program - participants, other researchers, program staff, other community members, and so on.
Then we put all data in single framework & apply various statistical tools to find out the dynamic on the market.
During the analysis stage, feedback from the stakeholder groups would be compared to determine areas of agreement as well as areas of divergence


