

Key Insights
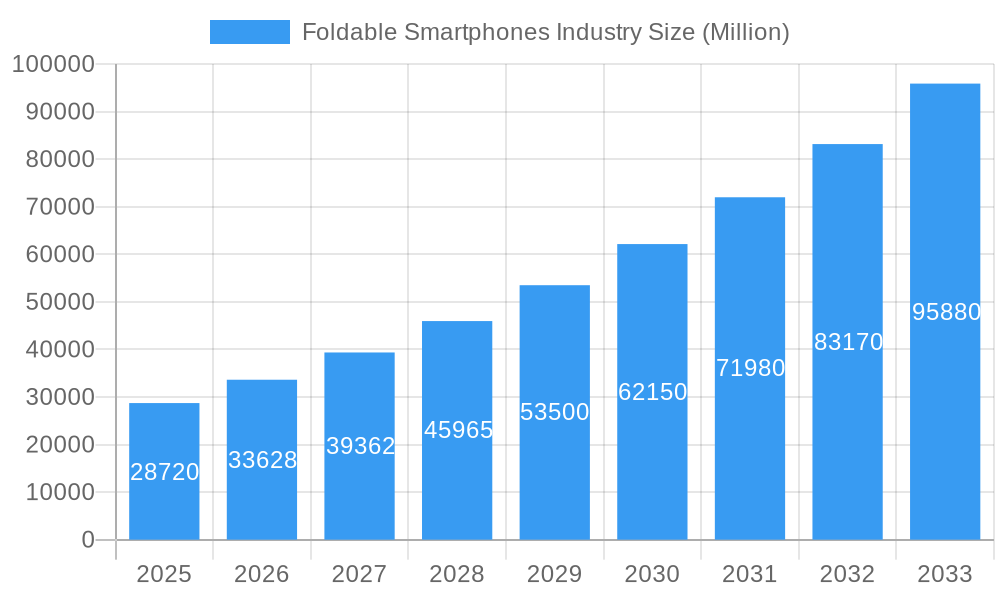
The foldable smartphone market, valued at $28.72 billion in 2025, is experiencing robust growth, projected to expand at a Compound Annual Growth Rate (CAGR) of 17.13% from 2025 to 2033. This surge is driven by several key factors. Firstly, advancements in flexible display technology are making foldable devices more durable and reliable, addressing previous concerns about screen fragility. Secondly, consumers are increasingly drawn to the innovative form factor, seeking devices that offer a larger screen experience within a compact and portable design. This is particularly appealing to users who value both productivity and portability, making foldable phones attractive for both professional and personal use. Thirdly, major players like Samsung, Xiaomi, and Apple are heavily investing in R&D and marketing, fueling market expansion and driving down prices, making these premium devices more accessible to a wider consumer base. Competition is intense, with established players and emerging vendors vying for market share through innovative designs, features, and pricing strategies. The market segmentation by functionality (inward and outward folding) reflects differing user preferences and technological advancements within the sector. Challenges remain, however, such as the higher price point compared to traditional smartphones, and the need for ongoing improvements in software optimization to fully leverage the unique capabilities of foldable screens.
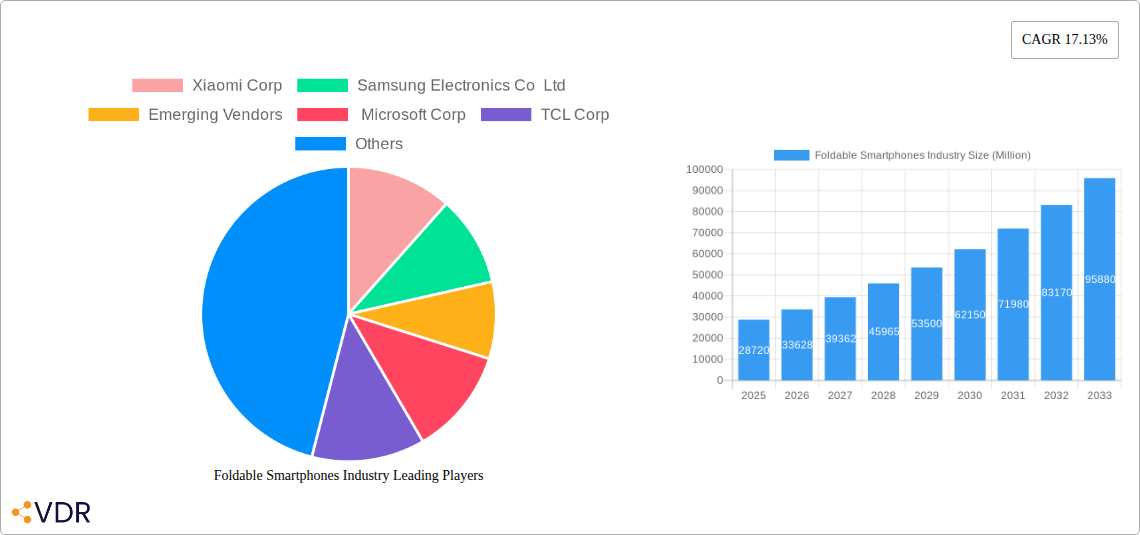
Foldable Smartphones Industry Market Size (In Billion)
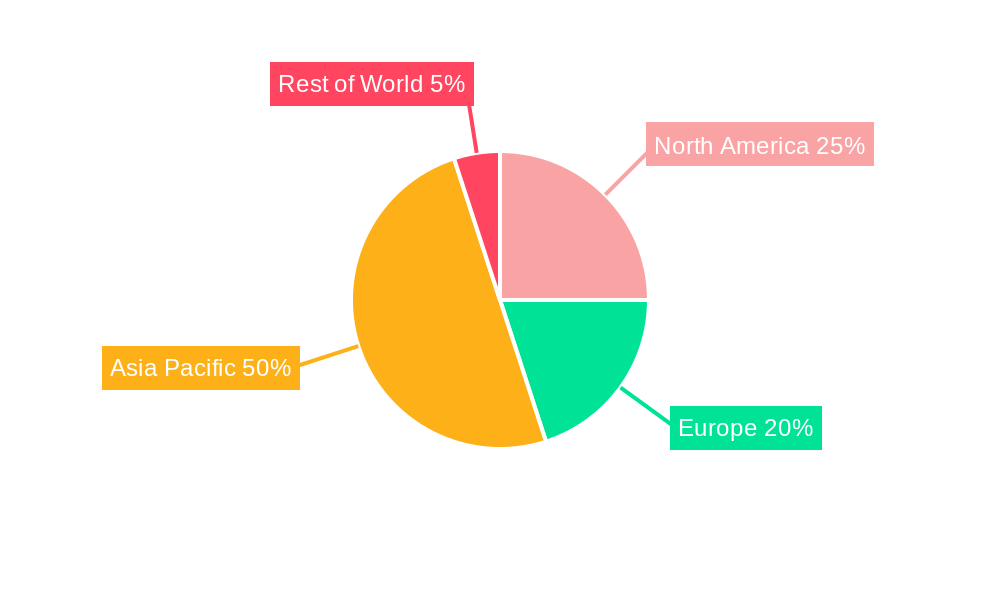
The market's regional distribution is likely to see Asia Pacific maintain a significant lead, given the strong presence of major manufacturers and a rapidly growing consumer base with high adoption rates for new technologies. North America and EMEA (Europe, the Middle East, and Africa) are expected to witness substantial growth as well, driven by increasing consumer awareness and the availability of more affordable foldable phone options. Over the forecast period, the market is poised for continued expansion, with improvements in battery technology and further refinement of foldable screen durability contributing to its ongoing evolution and wider adoption. The competitive landscape will remain dynamic, with continuous innovation and strategic partnerships shaping the trajectory of this rapidly expanding market segment.
Foldable Smartphones Industry Company Market Share
Foldable Smartphones Industry: A Comprehensive Market Report (2019-2033)
This comprehensive report provides a detailed analysis of the foldable smartphones industry, encompassing market dynamics, growth trends, competitive landscape, and future outlook. The study period spans from 2019 to 2033, with a focus on the base year 2025 and a forecast period from 2025 to 2033. The report examines both the parent market (smartphones) and the child market (foldable smartphones), providing valuable insights for industry professionals, investors, and stakeholders. Expected shipments are presented in Million units.
Foldable Smartphones Industry Market Dynamics & Structure
This section analyzes the market concentration, technological innovation, regulatory landscape, competitive substitutes, end-user demographics, and mergers & acquisitions (M&A) activities within the foldable smartphone market. The analysis covers the period from 2019 to 2024, offering a historical perspective for informed decision-making. We project xx% market share for Samsung Electronics Co Ltd and xx% for Xiaomi Corp in 2025.
- Market Concentration: High concentration with a few dominant players like Samsung and Xiaomi, but increasing participation from emerging vendors.
- Technological Innovation: Continuous advancements in flexible displays, hinges, and processors drive market growth. Innovation barriers include high manufacturing costs and durability concerns.
- Regulatory Frameworks: Varying regulations across different regions influence market access and adoption.
- Competitive Product Substitutes: Traditional smartphones remain a significant substitute.
- End-User Demographics: Primarily targeting high-income consumers initially, with potential for wider adoption as prices decrease.
- M&A Trends: Consolidation is likely as larger players acquire smaller companies to gain technological expertise or market share. XX M&A deals are predicted in the foldable smartphone sector between 2025 and 2033.
Foldable Smartphones Industry Growth Trends & Insights
The foldable smartphone market is poised for significant expansion, with a projected Compound Annual Growth Rate (CAGR) of 20-25% during the forecast period (2025-2033). This robust growth trajectory is underpinned by continuous technological innovation in display technology and hinge mechanisms, a growing appetite among consumers for novel mobile experiences, and an increasingly competitive pricing landscape. We anticipate market penetration to climb from approximately 8-10% in 2025 to a substantial 25-30% by 2033. This section delves into the evolving market size, the accelerating adoption rates, the transformative impact of technological breakthroughs, and the dynamic shifts in consumer behavior that are shaping the foldable smartphone sector from its nascent stages in 2019 to its projected maturity by 2033. A detailed analysis will explore the nuanced preferences of consumers gravitating towards foldable devices and the profound influence of cutting-edge technological advancements.
Dominant Regions, Countries, or Segments in Foldable Smartphones Industry
This section identifies the leading region, country, and segment (Inward Fold and Outward Fold) driving market growth. North America and Asia are expected to be the dominant regions, with China and the US showing the highest growth.
- Key Drivers for Growth: Strong consumer demand for innovative devices in mature markets and increasing affordability in emerging economies.
- Inward Fold Segment: xx Million units expected in 2025, driven by compact design and portability.
- Outward Fold Segment: xx Million units projected for 2025, driven by larger screen sizes for immersive viewing.
Foldable Smartphones Industry Product Landscape
The report analyzes foldable smartphone product innovations, focusing on unique selling propositions and technological advancements. This includes details on display technologies (e.g., AMOLED, flexible OLED), hinge mechanisms, processor advancements, and camera capabilities.
Key Drivers, Barriers & Challenges in Foldable Smartphones Industry
This section provides an in-depth analysis of the principal factors propelling the foldable smartphone market forward, alongside the significant hurdles and challenges that need to be overcome for sustained growth.
Key Drivers:
- Technological Prowess: Ongoing advancements in ultra-thin glass (UTG) for flexible displays and sophisticated, durable hinge designs are central to enhancing user experience and device longevity.
- Consumer Desire for Innovation: A clear and growing demand from consumers for unique and versatile form factors that offer enhanced productivity and entertainment capabilities.
- Strategic Ecosystem Development: Crucial collaborations and partnerships between smartphone manufacturers, component suppliers, and software developers are vital for creating a cohesive and appealing foldable ecosystem.
- Improving Affordability: As manufacturing processes mature and economies of scale are realized, the introduction of more competitively priced models will broaden market access.
Key Barriers & Challenges:
- Premium Pricing Obstacles: The current high manufacturing costs contribute to elevated retail prices, which can be a significant deterrent for a wider consumer base.
- Durability and Reliability Concerns: Despite improvements, ongoing consumer and industry scrutiny regarding the long-term durability and everyday reliability of foldable displays and hinges remains a critical challenge.
- Supply Chain Volatility: Disruptions in the global supply chain, including the availability and cost of specialized components, can impact production volumes, product availability, and ultimately, market growth. These issues are estimated to potentially reduce the global market size by 5-7% in 2026.
- Software Optimization: Ensuring seamless and optimized user experiences across a variety of foldable form factors and screen sizes requires continued software development and adaptation.
Emerging Opportunities in Foldable Smartphones Industry
The foldable smartphone landscape is ripe with emerging opportunities. Beyond the expansion into untapped markets, particularly developing economies seeking next-generation mobile solutions, significant potential lies in innovative applications. The integration of augmented reality (AR) experiences, enhanced multitasking capabilities, and unique productivity tools are set to redefine user interaction. Furthermore, evolving consumer preferences are increasingly leaning towards devices that offer a blend of portability and expansive screen real estate, creating a fertile ground for further product diversification and feature innovation.
Growth Accelerators in the Foldable Smartphones Industry Industry
The long-term growth trajectory of the foldable smartphone market is anticipated to be significantly amplified by several key factors. Breakthroughs in battery technology will be crucial for supporting the power demands of larger, flexible displays and advanced functionalities. The strategic introduction of more affordable foldable models across various price segments will democratize access and broaden consumer adoption. Expansion into new and diverse market segments, including enterprise solutions and specialized professional devices, will also contribute to sustained growth. Moreover, continued strategic alliances and deep collaborations between industry players will foster innovation, streamline production, and accelerate the overall market expansion.
Key Players Shaping the Foldable Smartphones Industry Market
- Major Manufacturers:
- Xiaomi Corp
- Samsung Electronics Co Ltd
- Huawei Technologies Co Ltd
- Google (Expected Entry)
- Established Brands with Foldable Offerings:
- Motorola Mobility LLC (Lenovo Group Limited)
- TCL Corp
- Lenovo Group Ltd
- LG Electronics Inc (Though exited the smartphone market, their past contributions are notable)
- Sony Corp (Potential future entrant)
- Apple Inc (High anticipation for a future entry)
- Specialized and Emerging Players:
- Royole Corp (Pioneer in the space)
- Energizer Holdings Inc
- ZTE Corporation
- Component and Technology Innovators: (While not direct smartphone manufacturers, their contributions are critical)
- Corning Incorporated (Gorilla Glass for foldables)
- Samsung Display
- LG Display
Notable Milestones in Foldable Smartphones Industry Sector
- August 2022: Samsung Electronics launched the Galaxy Z Flip4 (USD 999.99) and Galaxy Z Fold4 (USD 1,799.99), solidifying its leadership in the premium segment.
- November 2022: Huawei introduced the Pocket S, a budget-friendly flip-style foldable phone (USD 819-1025), expanding market accessibility.
In-Depth Foldable Smartphones Industry Market Outlook
The foldable smartphone market is poised for significant growth in the coming years. Continued technological advancements, increasing affordability, and expansion into new markets will drive market expansion. Strategic partnerships and collaborations will play a crucial role in shaping the future of this dynamic sector. The market is expected to reach xx Million units by 2033.
Foldable Smartphones Industry Segmentation
-
1. Functionality Types
- 1.1. Inward Fold
- 1.2. Outward Fold
-
2. Geography
- 2.1. Americas
- 2.2. EMEA
- 2.3. Asia Pacific
Foldable Smartphones Industry Segmentation By Geography
-
1. North America
- 1.1. United States
- 1.2. Canada
- 1.3. Mexico
-
2. Europe
- 2.1. Germany
- 2.2. United Kingdom
- 2.3. France
- 2.4. Italy
- 2.5. Spain
- 2.6. Rest of Europe
-
3. Asia Pacific
- 3.1. China
- 3.2. Japan
- 3.3. India
- 3.4. Australia
- 3.5. South Korea
- 3.6. Rest of Asia Pacific
-
4. South America
- 4.1. Brazil
- 4.2. Argentina
- 4.3. Rest of South America
-
5. MEA
- 5.1. UAE
- 5.2. South Africa
- 5.3. Saudi Arabia
- 5.4. Rest Of MEA
Foldable Smartphones Industry Regional Market Share
Geographic Coverage of Foldable Smartphones Industry
Foldable Smartphones Industry REPORT HIGHLIGHTS
| Aspects | Details |
|---|---|
| Study Period | 2020-2034 |
| Base Year | 2025 |
| Estimated Year | 2026 |
| Forecast Period | 2026-2034 |
| Historical Period | 2020-2025 |
| Growth Rate | CAGR of 17.13% from 2020-2034 |
| Segmentation |
|
Table of Contents
- 1. Introduction
- 1.1. Research Scope
- 1.2. Market Segmentation
- 1.3. Research Methodology
- 1.4. Definitions and Assumptions
- 2. Executive Summary
- 2.1. Introduction
- 3. Market Dynamics
- 3.1. Introduction
- 3.2. Market Drivers
- 3.2.1. Miniaturization of the Display Technology Products; Growing Demand of Multi-Screen Smartphone
- 3.3. Market Restrains
- 3.3.1. Complexity in the Manufacturing Process with Countable Number of Folds; Huge Price Tags with Products from Prominent Vendors
- 3.4. Market Trends
- 3.4.1. Growing Demand of Multi-Screen Smartphone
- 4. Market Factor Analysis
- 4.1. Porters Five Forces
- 4.2. Supply/Value Chain
- 4.3. PESTEL analysis
- 4.4. Market Entropy
- 4.5. Patent/Trademark Analysis
- 5. Global Foldable Smartphones Industry Analysis, Insights and Forecast, 2020-2032
- 5.1. Market Analysis, Insights and Forecast - by Functionality Types
- 5.1.1. Inward Fold
- 5.1.2. Outward Fold
- 5.2. Market Analysis, Insights and Forecast - by Geography
- 5.2.1. Americas
- 5.2.2. EMEA
- 5.2.3. Asia Pacific
- 5.3. Market Analysis, Insights and Forecast - by Region
- 5.3.1. North America
- 5.3.2. Europe
- 5.3.3. Asia Pacific
- 5.3.4. South America
- 5.3.5. MEA
- 5.1. Market Analysis, Insights and Forecast - by Functionality Types
- 6. North America Foldable Smartphones Industry Analysis, Insights and Forecast, 2020-2032
- 6.1. Market Analysis, Insights and Forecast - by Functionality Types
- 6.1.1. Inward Fold
- 6.1.2. Outward Fold
- 6.2. Market Analysis, Insights and Forecast - by Geography
- 6.2.1. Americas
- 6.2.2. EMEA
- 6.2.3. Asia Pacific
- 6.1. Market Analysis, Insights and Forecast - by Functionality Types
- 7. Europe Foldable Smartphones Industry Analysis, Insights and Forecast, 2020-2032
- 7.1. Market Analysis, Insights and Forecast - by Functionality Types
- 7.1.1. Inward Fold
- 7.1.2. Outward Fold
- 7.2. Market Analysis, Insights and Forecast - by Geography
- 7.2.1. Americas
- 7.2.2. EMEA
- 7.2.3. Asia Pacific
- 7.1. Market Analysis, Insights and Forecast - by Functionality Types
- 8. Asia Pacific Foldable Smartphones Industry Analysis, Insights and Forecast, 2020-2032
- 8.1. Market Analysis, Insights and Forecast - by Functionality Types
- 8.1.1. Inward Fold
- 8.1.2. Outward Fold
- 8.2. Market Analysis, Insights and Forecast - by Geography
- 8.2.1. Americas
- 8.2.2. EMEA
- 8.2.3. Asia Pacific
- 8.1. Market Analysis, Insights and Forecast - by Functionality Types
- 9. South America Foldable Smartphones Industry Analysis, Insights and Forecast, 2020-2032
- 9.1. Market Analysis, Insights and Forecast - by Functionality Types
- 9.1.1. Inward Fold
- 9.1.2. Outward Fold
- 9.2. Market Analysis, Insights and Forecast - by Geography
- 9.2.1. Americas
- 9.2.2. EMEA
- 9.2.3. Asia Pacific
- 9.1. Market Analysis, Insights and Forecast - by Functionality Types
- 10. MEA Foldable Smartphones Industry Analysis, Insights and Forecast, 2020-2032
- 10.1. Market Analysis, Insights and Forecast - by Functionality Types
- 10.1.1. Inward Fold
- 10.1.2. Outward Fold
- 10.2. Market Analysis, Insights and Forecast - by Geography
- 10.2.1. Americas
- 10.2.2. EMEA
- 10.2.3. Asia Pacific
- 10.1. Market Analysis, Insights and Forecast - by Functionality Types
- 11. Competitive Analysis
- 11.1. Global Market Share Analysis 2025
- 11.2. Company Profiles
- 11.2.1 Xiaomi Corp
- 11.2.1.1. Overview
- 11.2.1.2. Products
- 11.2.1.3. SWOT Analysis
- 11.2.1.4. Recent Developments
- 11.2.1.5. Financials (Based on Availability)
- 11.2.2 Samsung Electronics Co Ltd
- 11.2.2.1. Overview
- 11.2.2.2. Products
- 11.2.2.3. SWOT Analysis
- 11.2.2.4. Recent Developments
- 11.2.2.5. Financials (Based on Availability)
- 11.2.3 Emerging Vendors
- 11.2.3.1. Overview
- 11.2.3.2. Products
- 11.2.3.3. SWOT Analysis
- 11.2.3.4. Recent Developments
- 11.2.3.5. Financials (Based on Availability)
- 11.2.4 Microsoft Corp
- 11.2.4.1. Overview
- 11.2.4.2. Products
- 11.2.4.3. SWOT Analysis
- 11.2.4.4. Recent Developments
- 11.2.4.5. Financials (Based on Availability)
- 11.2.5 TCL Corp
- 11.2.5.1. Overview
- 11.2.5.2. Products
- 11.2.5.3. SWOT Analysis
- 11.2.5.4. Recent Developments
- 11.2.5.5. Financials (Based on Availability)
- 11.2.6 Lenovo Group Ltd
- 11.2.6.1. Overview
- 11.2.6.2. Products
- 11.2.6.3. SWOT Analysis
- 11.2.6.4. Recent Developments
- 11.2.6.5. Financials (Based on Availability)
- 11.2.7 LG Electronics Inc
- 11.2.7.1. Overview
- 11.2.7.2. Products
- 11.2.7.3. SWOT Analysis
- 11.2.7.4. Recent Developments
- 11.2.7.5. Financials (Based on Availability)
- 11.2.8 Sony Corp
- 11.2.8.1. Overview
- 11.2.8.2. Products
- 11.2.8.3. SWOT Analysis
- 11.2.8.4. Recent Developments
- 11.2.8.5. Financials (Based on Availability)
- 11.2.9 Apple Inc
- 11.2.9.1. Overview
- 11.2.9.2. Products
- 11.2.9.3. SWOT Analysis
- 11.2.9.4. Recent Developments
- 11.2.9.5. Financials (Based on Availability)
- 11.2.10 Motorola Mobility LLC (Lenovo Group Limited)
- 11.2.10.1. Overview
- 11.2.10.2. Products
- 11.2.10.3. SWOT Analysis
- 11.2.10.4. Recent Developments
- 11.2.10.5. Financials (Based on Availability)
- 11.2.11 Commercialised Vendors (Market Ready)
- 11.2.11.1. Overview
- 11.2.11.2. Products
- 11.2.11.3. SWOT Analysis
- 11.2.11.4. Recent Developments
- 11.2.11.5. Financials (Based on Availability)
- 11.2.12 Royole Corp
- 11.2.12.1. Overview
- 11.2.12.2. Products
- 11.2.12.3. SWOT Analysis
- 11.2.12.4. Recent Developments
- 11.2.12.5. Financials (Based on Availability)
- 11.2.13 Huawei Technologies Co Ltd
- 11.2.13.1. Overview
- 11.2.13.2. Products
- 11.2.13.3. SWOT Analysis
- 11.2.13.4. Recent Developments
- 11.2.13.5. Financials (Based on Availability)
- 11.2.14 Energizer Holdings Inc
- 11.2.14.1. Overview
- 11.2.14.2. Products
- 11.2.14.3. SWOT Analysis
- 11.2.14.4. Recent Developments
- 11.2.14.5. Financials (Based on Availability)
- 11.2.15 ZTE Corporation
- 11.2.15.1. Overview
- 11.2.15.2. Products
- 11.2.15.3. SWOT Analysis
- 11.2.15.4. Recent Developments
- 11.2.15.5. Financials (Based on Availability)
- 11.2.1 Xiaomi Corp
List of Figures
- Figure 1: Global Foldable Smartphones Industry Revenue Breakdown (Million, %) by Region 2025 & 2033
- Figure 2: Global Foldable Smartphones Industry Volume Breakdown (K Unit, %) by Region 2025 & 2033
- Figure 3: North America Foldable Smartphones Industry Revenue (Million), by Functionality Types 2025 & 2033
- Figure 4: North America Foldable Smartphones Industry Volume (K Unit), by Functionality Types 2025 & 2033
- Figure 5: North America Foldable Smartphones Industry Revenue Share (%), by Functionality Types 2025 & 2033
- Figure 6: North America Foldable Smartphones Industry Volume Share (%), by Functionality Types 2025 & 2033
- Figure 7: North America Foldable Smartphones Industry Revenue (Million), by Geography 2025 & 2033
- Figure 8: North America Foldable Smartphones Industry Volume (K Unit), by Geography 2025 & 2033
- Figure 9: North America Foldable Smartphones Industry Revenue Share (%), by Geography 2025 & 2033
- Figure 10: North America Foldable Smartphones Industry Volume Share (%), by Geography 2025 & 2033
- Figure 11: North America Foldable Smartphones Industry Revenue (Million), by Country 2025 & 2033
- Figure 12: North America Foldable Smartphones Industry Volume (K Unit), by Country 2025 & 2033
- Figure 13: North America Foldable Smartphones Industry Revenue Share (%), by Country 2025 & 2033
- Figure 14: North America Foldable Smartphones Industry Volume Share (%), by Country 2025 & 2033
- Figure 15: Europe Foldable Smartphones Industry Revenue (Million), by Functionality Types 2025 & 2033
- Figure 16: Europe Foldable Smartphones Industry Volume (K Unit), by Functionality Types 2025 & 2033
- Figure 17: Europe Foldable Smartphones Industry Revenue Share (%), by Functionality Types 2025 & 2033
- Figure 18: Europe Foldable Smartphones Industry Volume Share (%), by Functionality Types 2025 & 2033
- Figure 19: Europe Foldable Smartphones Industry Revenue (Million), by Geography 2025 & 2033
- Figure 20: Europe Foldable Smartphones Industry Volume (K Unit), by Geography 2025 & 2033
- Figure 21: Europe Foldable Smartphones Industry Revenue Share (%), by Geography 2025 & 2033
- Figure 22: Europe Foldable Smartphones Industry Volume Share (%), by Geography 2025 & 2033
- Figure 23: Europe Foldable Smartphones Industry Revenue (Million), by Country 2025 & 2033
- Figure 24: Europe Foldable Smartphones Industry Volume (K Unit), by Country 2025 & 2033
- Figure 25: Europe Foldable Smartphones Industry Revenue Share (%), by Country 2025 & 2033
- Figure 26: Europe Foldable Smartphones Industry Volume Share (%), by Country 2025 & 2033
- Figure 27: Asia Pacific Foldable Smartphones Industry Revenue (Million), by Functionality Types 2025 & 2033
- Figure 28: Asia Pacific Foldable Smartphones Industry Volume (K Unit), by Functionality Types 2025 & 2033
- Figure 29: Asia Pacific Foldable Smartphones Industry Revenue Share (%), by Functionality Types 2025 & 2033
- Figure 30: Asia Pacific Foldable Smartphones Industry Volume Share (%), by Functionality Types 2025 & 2033
- Figure 31: Asia Pacific Foldable Smartphones Industry Revenue (Million), by Geography 2025 & 2033
- Figure 32: Asia Pacific Foldable Smartphones Industry Volume (K Unit), by Geography 2025 & 2033
- Figure 33: Asia Pacific Foldable Smartphones Industry Revenue Share (%), by Geography 2025 & 2033
- Figure 34: Asia Pacific Foldable Smartphones Industry Volume Share (%), by Geography 2025 & 2033
- Figure 35: Asia Pacific Foldable Smartphones Industry Revenue (Million), by Country 2025 & 2033
- Figure 36: Asia Pacific Foldable Smartphones Industry Volume (K Unit), by Country 2025 & 2033
- Figure 37: Asia Pacific Foldable Smartphones Industry Revenue Share (%), by Country 2025 & 2033
- Figure 38: Asia Pacific Foldable Smartphones Industry Volume Share (%), by Country 2025 & 2033
- Figure 39: South America Foldable Smartphones Industry Revenue (Million), by Functionality Types 2025 & 2033
- Figure 40: South America Foldable Smartphones Industry Volume (K Unit), by Functionality Types 2025 & 2033
- Figure 41: South America Foldable Smartphones Industry Revenue Share (%), by Functionality Types 2025 & 2033
- Figure 42: South America Foldable Smartphones Industry Volume Share (%), by Functionality Types 2025 & 2033
- Figure 43: South America Foldable Smartphones Industry Revenue (Million), by Geography 2025 & 2033
- Figure 44: South America Foldable Smartphones Industry Volume (K Unit), by Geography 2025 & 2033
- Figure 45: South America Foldable Smartphones Industry Revenue Share (%), by Geography 2025 & 2033
- Figure 46: South America Foldable Smartphones Industry Volume Share (%), by Geography 2025 & 2033
- Figure 47: South America Foldable Smartphones Industry Revenue (Million), by Country 2025 & 2033
- Figure 48: South America Foldable Smartphones Industry Volume (K Unit), by Country 2025 & 2033
- Figure 49: South America Foldable Smartphones Industry Revenue Share (%), by Country 2025 & 2033
- Figure 50: South America Foldable Smartphones Industry Volume Share (%), by Country 2025 & 2033
- Figure 51: MEA Foldable Smartphones Industry Revenue (Million), by Functionality Types 2025 & 2033
- Figure 52: MEA Foldable Smartphones Industry Volume (K Unit), by Functionality Types 2025 & 2033
- Figure 53: MEA Foldable Smartphones Industry Revenue Share (%), by Functionality Types 2025 & 2033
- Figure 54: MEA Foldable Smartphones Industry Volume Share (%), by Functionality Types 2025 & 2033
- Figure 55: MEA Foldable Smartphones Industry Revenue (Million), by Geography 2025 & 2033
- Figure 56: MEA Foldable Smartphones Industry Volume (K Unit), by Geography 2025 & 2033
- Figure 57: MEA Foldable Smartphones Industry Revenue Share (%), by Geography 2025 & 2033
- Figure 58: MEA Foldable Smartphones Industry Volume Share (%), by Geography 2025 & 2033
- Figure 59: MEA Foldable Smartphones Industry Revenue (Million), by Country 2025 & 2033
- Figure 60: MEA Foldable Smartphones Industry Volume (K Unit), by Country 2025 & 2033
- Figure 61: MEA Foldable Smartphones Industry Revenue Share (%), by Country 2025 & 2033
- Figure 62: MEA Foldable Smartphones Industry Volume Share (%), by Country 2025 & 2033
List of Tables
- Table 1: Global Foldable Smartphones Industry Revenue Million Forecast, by Functionality Types 2020 & 2033
- Table 2: Global Foldable Smartphones Industry Volume K Unit Forecast, by Functionality Types 2020 & 2033
- Table 3: Global Foldable Smartphones Industry Revenue Million Forecast, by Geography 2020 & 2033
- Table 4: Global Foldable Smartphones Industry Volume K Unit Forecast, by Geography 2020 & 2033
- Table 5: Global Foldable Smartphones Industry Revenue Million Forecast, by Region 2020 & 2033
- Table 6: Global Foldable Smartphones Industry Volume K Unit Forecast, by Region 2020 & 2033
- Table 7: Global Foldable Smartphones Industry Revenue Million Forecast, by Functionality Types 2020 & 2033
- Table 8: Global Foldable Smartphones Industry Volume K Unit Forecast, by Functionality Types 2020 & 2033
- Table 9: Global Foldable Smartphones Industry Revenue Million Forecast, by Geography 2020 & 2033
- Table 10: Global Foldable Smartphones Industry Volume K Unit Forecast, by Geography 2020 & 2033
- Table 11: Global Foldable Smartphones Industry Revenue Million Forecast, by Country 2020 & 2033
- Table 12: Global Foldable Smartphones Industry Volume K Unit Forecast, by Country 2020 & 2033
- Table 13: United States Foldable Smartphones Industry Revenue (Million) Forecast, by Application 2020 & 2033
- Table 14: United States Foldable Smartphones Industry Volume (K Unit) Forecast, by Application 2020 & 2033
- Table 15: Canada Foldable Smartphones Industry Revenue (Million) Forecast, by Application 2020 & 2033
- Table 16: Canada Foldable Smartphones Industry Volume (K Unit) Forecast, by Application 2020 & 2033
- Table 17: Mexico Foldable Smartphones Industry Revenue (Million) Forecast, by Application 2020 & 2033
- Table 18: Mexico Foldable Smartphones Industry Volume (K Unit) Forecast, by Application 2020 & 2033
- Table 19: Global Foldable Smartphones Industry Revenue Million Forecast, by Functionality Types 2020 & 2033
- Table 20: Global Foldable Smartphones Industry Volume K Unit Forecast, by Functionality Types 2020 & 2033
- Table 21: Global Foldable Smartphones Industry Revenue Million Forecast, by Geography 2020 & 2033
- Table 22: Global Foldable Smartphones Industry Volume K Unit Forecast, by Geography 2020 & 2033
- Table 23: Global Foldable Smartphones Industry Revenue Million Forecast, by Country 2020 & 2033
- Table 24: Global Foldable Smartphones Industry Volume K Unit Forecast, by Country 2020 & 2033
- Table 25: Germany Foldable Smartphones Industry Revenue (Million) Forecast, by Application 2020 & 2033
- Table 26: Germany Foldable Smartphones Industry Volume (K Unit) Forecast, by Application 2020 & 2033
- Table 27: United Kingdom Foldable Smartphones Industry Revenue (Million) Forecast, by Application 2020 & 2033
- Table 28: United Kingdom Foldable Smartphones Industry Volume (K Unit) Forecast, by Application 2020 & 2033
- Table 29: France Foldable Smartphones Industry Revenue (Million) Forecast, by Application 2020 & 2033
- Table 30: France Foldable Smartphones Industry Volume (K Unit) Forecast, by Application 2020 & 2033
- Table 31: Italy Foldable Smartphones Industry Revenue (Million) Forecast, by Application 2020 & 2033
- Table 32: Italy Foldable Smartphones Industry Volume (K Unit) Forecast, by Application 2020 & 2033
- Table 33: Spain Foldable Smartphones Industry Revenue (Million) Forecast, by Application 2020 & 2033
- Table 34: Spain Foldable Smartphones Industry Volume (K Unit) Forecast, by Application 2020 & 2033
- Table 35: Rest of Europe Foldable Smartphones Industry Revenue (Million) Forecast, by Application 2020 & 2033
- Table 36: Rest of Europe Foldable Smartphones Industry Volume (K Unit) Forecast, by Application 2020 & 2033
- Table 37: Global Foldable Smartphones Industry Revenue Million Forecast, by Functionality Types 2020 & 2033
- Table 38: Global Foldable Smartphones Industry Volume K Unit Forecast, by Functionality Types 2020 & 2033
- Table 39: Global Foldable Smartphones Industry Revenue Million Forecast, by Geography 2020 & 2033
- Table 40: Global Foldable Smartphones Industry Volume K Unit Forecast, by Geography 2020 & 2033
- Table 41: Global Foldable Smartphones Industry Revenue Million Forecast, by Country 2020 & 2033
- Table 42: Global Foldable Smartphones Industry Volume K Unit Forecast, by Country 2020 & 2033
- Table 43: China Foldable Smartphones Industry Revenue (Million) Forecast, by Application 2020 & 2033
- Table 44: China Foldable Smartphones Industry Volume (K Unit) Forecast, by Application 2020 & 2033
- Table 45: Japan Foldable Smartphones Industry Revenue (Million) Forecast, by Application 2020 & 2033
- Table 46: Japan Foldable Smartphones Industry Volume (K Unit) Forecast, by Application 2020 & 2033
- Table 47: India Foldable Smartphones Industry Revenue (Million) Forecast, by Application 2020 & 2033
- Table 48: India Foldable Smartphones Industry Volume (K Unit) Forecast, by Application 2020 & 2033
- Table 49: Australia Foldable Smartphones Industry Revenue (Million) Forecast, by Application 2020 & 2033
- Table 50: Australia Foldable Smartphones Industry Volume (K Unit) Forecast, by Application 2020 & 2033
- Table 51: South Korea Foldable Smartphones Industry Revenue (Million) Forecast, by Application 2020 & 2033
- Table 52: South Korea Foldable Smartphones Industry Volume (K Unit) Forecast, by Application 2020 & 2033
- Table 53: Rest of Asia Pacific Foldable Smartphones Industry Revenue (Million) Forecast, by Application 2020 & 2033
- Table 54: Rest of Asia Pacific Foldable Smartphones Industry Volume (K Unit) Forecast, by Application 2020 & 2033
- Table 55: Global Foldable Smartphones Industry Revenue Million Forecast, by Functionality Types 2020 & 2033
- Table 56: Global Foldable Smartphones Industry Volume K Unit Forecast, by Functionality Types 2020 & 2033
- Table 57: Global Foldable Smartphones Industry Revenue Million Forecast, by Geography 2020 & 2033
- Table 58: Global Foldable Smartphones Industry Volume K Unit Forecast, by Geography 2020 & 2033
- Table 59: Global Foldable Smartphones Industry Revenue Million Forecast, by Country 2020 & 2033
- Table 60: Global Foldable Smartphones Industry Volume K Unit Forecast, by Country 2020 & 2033
- Table 61: Brazil Foldable Smartphones Industry Revenue (Million) Forecast, by Application 2020 & 2033
- Table 62: Brazil Foldable Smartphones Industry Volume (K Unit) Forecast, by Application 2020 & 2033
- Table 63: Argentina Foldable Smartphones Industry Revenue (Million) Forecast, by Application 2020 & 2033
- Table 64: Argentina Foldable Smartphones Industry Volume (K Unit) Forecast, by Application 2020 & 2033
- Table 65: Rest of South America Foldable Smartphones Industry Revenue (Million) Forecast, by Application 2020 & 2033
- Table 66: Rest of South America Foldable Smartphones Industry Volume (K Unit) Forecast, by Application 2020 & 2033
- Table 67: Global Foldable Smartphones Industry Revenue Million Forecast, by Functionality Types 2020 & 2033
- Table 68: Global Foldable Smartphones Industry Volume K Unit Forecast, by Functionality Types 2020 & 2033
- Table 69: Global Foldable Smartphones Industry Revenue Million Forecast, by Geography 2020 & 2033
- Table 70: Global Foldable Smartphones Industry Volume K Unit Forecast, by Geography 2020 & 2033
- Table 71: Global Foldable Smartphones Industry Revenue Million Forecast, by Country 2020 & 2033
- Table 72: Global Foldable Smartphones Industry Volume K Unit Forecast, by Country 2020 & 2033
- Table 73: UAE Foldable Smartphones Industry Revenue (Million) Forecast, by Application 2020 & 2033
- Table 74: UAE Foldable Smartphones Industry Volume (K Unit) Forecast, by Application 2020 & 2033
- Table 75: South Africa Foldable Smartphones Industry Revenue (Million) Forecast, by Application 2020 & 2033
- Table 76: South Africa Foldable Smartphones Industry Volume (K Unit) Forecast, by Application 2020 & 2033
- Table 77: Saudi Arabia Foldable Smartphones Industry Revenue (Million) Forecast, by Application 2020 & 2033
- Table 78: Saudi Arabia Foldable Smartphones Industry Volume (K Unit) Forecast, by Application 2020 & 2033
- Table 79: Rest Of MEA Foldable Smartphones Industry Revenue (Million) Forecast, by Application 2020 & 2033
- Table 80: Rest Of MEA Foldable Smartphones Industry Volume (K Unit) Forecast, by Application 2020 & 2033
Frequently Asked Questions
1. What is the projected Compound Annual Growth Rate (CAGR) of the Foldable Smartphones Industry?
The projected CAGR is approximately 17.13%.
2. Which companies are prominent players in the Foldable Smartphones Industry?
Key companies in the market include Xiaomi Corp, Samsung Electronics Co Ltd, Emerging Vendors, Microsoft Corp, TCL Corp, Lenovo Group Ltd, LG Electronics Inc, Sony Corp, Apple Inc, Motorola Mobility LLC (Lenovo Group Limited), Commercialised Vendors (Market Ready), Royole Corp, Huawei Technologies Co Ltd, Energizer Holdings Inc, ZTE Corporation.
3. What are the main segments of the Foldable Smartphones Industry?
The market segments include Functionality Types, Geography.
4. Can you provide details about the market size?
The market size is estimated to be USD 28.72 Million as of 2022.
5. What are some drivers contributing to market growth?
Miniaturization of the Display Technology Products; Growing Demand of Multi-Screen Smartphone.
6. What are the notable trends driving market growth?
Growing Demand of Multi-Screen Smartphone.
7. Are there any restraints impacting market growth?
Complexity in the Manufacturing Process with Countable Number of Folds; Huge Price Tags with Products from Prominent Vendors.
8. Can you provide examples of recent developments in the market?
August 2022: Samsung Electronics unveiled its most recent line of premium foldable smartphones. The Galaxy Z Flip4 clamshell smartphone is priced at USD 999.99, while the top-tier Galaxy Z Fold4 with 5G support has a 7.6-inch central screen and starts at USD 1,799.99.
9. What pricing options are available for accessing the report?
Pricing options include single-user, multi-user, and enterprise licenses priced at USD 4750, USD 5250, and USD 8750 respectively.
10. Is the market size provided in terms of value or volume?
The market size is provided in terms of value, measured in Million and volume, measured in K Unit.
11. Are there any specific market keywords associated with the report?
Yes, the market keyword associated with the report is "Foldable Smartphones Industry," which aids in identifying and referencing the specific market segment covered.
12. How do I determine which pricing option suits my needs best?
The pricing options vary based on user requirements and access needs. Individual users may opt for single-user licenses, while businesses requiring broader access may choose multi-user or enterprise licenses for cost-effective access to the report.
13. Are there any additional resources or data provided in the Foldable Smartphones Industry report?
While the report offers comprehensive insights, it's advisable to review the specific contents or supplementary materials provided to ascertain if additional resources or data are available.
14. How can I stay updated on further developments or reports in the Foldable Smartphones Industry?
To stay informed about further developments, trends, and reports in the Foldable Smartphones Industry, consider subscribing to industry newsletters, following relevant companies and organizations, or regularly checking reputable industry news sources and publications.
Methodology
Step 1 - Identification of Relevant Samples Size from Population Database


Step 2 - Approaches for Defining Global Market Size (Value, Volume* & Price*)

Note*: In applicable scenarios
Step 3 - Data Sources
Primary Research
- Web Analytics
- Survey Reports
- Research Institute
- Latest Research Reports
- Opinion Leaders
Secondary Research
- Annual Reports
- White Paper
- Latest Press Release
- Industry Association
- Paid Database
- Investor Presentations

Step 4 - Data Triangulation
Involves using different sources of information in order to increase the validity of a study
These sources are likely to be stakeholders in a program - participants, other researchers, program staff, other community members, and so on.
Then we put all data in single framework & apply various statistical tools to find out the dynamic on the market.
During the analysis stage, feedback from the stakeholder groups would be compared to determine areas of agreement as well as areas of divergence