
Key Insights
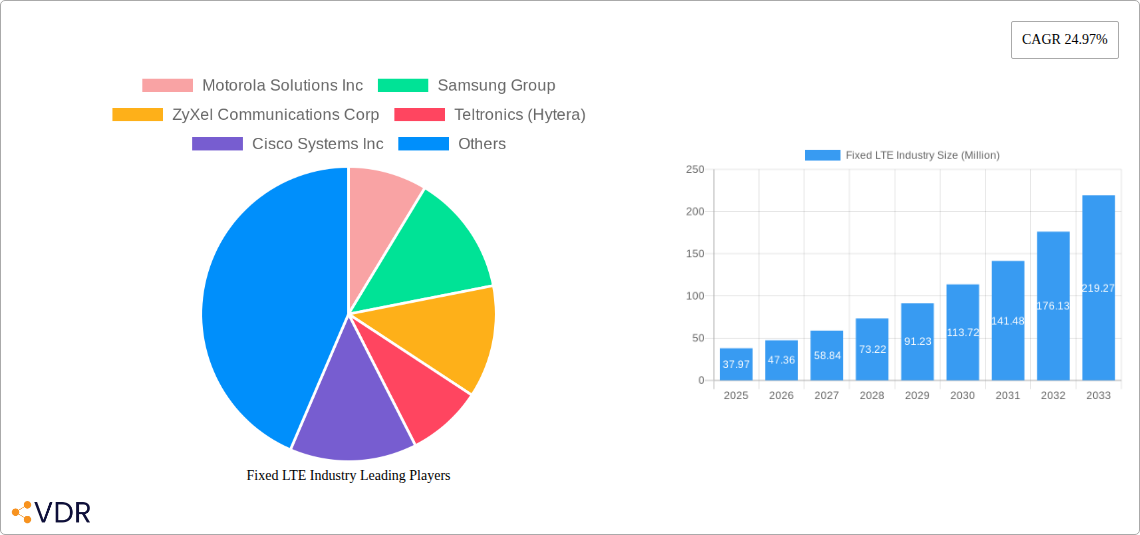
The Fixed LTE market is experiencing robust growth, projected to reach $37.97 million in 2025 and exhibiting a remarkable Compound Annual Growth Rate (CAGR) of 24.97%. This expansion is driven by several key factors. The increasing demand for high-speed internet access in both residential and commercial sectors fuels market growth. The rise of smart homes and businesses necessitates reliable, high-bandwidth connectivity solutions, making Fixed LTE a compelling alternative to traditional wired infrastructure, particularly in areas with limited broadband penetration. Furthermore, technological advancements leading to enhanced performance, improved coverage, and reduced costs of LTE infrastructure are significant drivers. The availability of various solution types, including LTE infrastructure, indoor and outdoor CPEs (Customer Premises Equipment), caters to diverse needs and deployment scenarios, further boosting market adoption.
However, the market also faces some challenges. Competition from other broadband technologies like fiber optics and 5G presents a significant restraint. Regulatory hurdles and the cost of deployment, especially in remote or underserved areas, can also impede market expansion. Despite these challenges, the ongoing digital transformation across various sectors, coupled with increasing affordability and reliability of Fixed LTE solutions, is expected to maintain strong growth momentum throughout the forecast period (2025-2033). The market segmentation by user type (residential and commercial) and solution type (LTE infrastructure, indoor/outdoor CPEs) allows for targeted market penetration strategies for companies like Motorola Solutions, Samsung, ZyXel, and Huawei, who are actively engaged in developing and supplying equipment and services. Geographical expansion into emerging markets in Asia Pacific and South America presents significant growth opportunities.
Fixed LTE Industry Market Report: 2019-2033
This comprehensive report provides a detailed analysis of the Fixed LTE industry, encompassing market dynamics, growth trends, regional insights, competitive landscapes, and future opportunities. The study period covers 2019-2033, with 2025 as the base and estimated year. This report is invaluable for industry professionals, investors, and strategists seeking to understand and capitalize on the evolving Fixed LTE landscape. The report uses Million units as the unit of measure for all values.
Fixed LTE Industry Market Dynamics & Structure
The Fixed LTE market exhibits a moderately concentrated structure with a few key players holding significant market share. Technological innovation, primarily driven by advancements in LTE infrastructure and CPE (Customer Premises Equipment) technologies, is a major growth catalyst. Regulatory frameworks governing spectrum allocation and infrastructure deployment significantly impact market dynamics. Competitive product substitutes, such as fiber optics and satellite broadband, pose challenges. End-user demographics, particularly the increasing demand from residential and commercial sectors, are shaping market growth. Furthermore, M&A activity is expected to continue, leading to industry consolidation.
- Market Concentration: The top 5 players account for approximately xx% of the global market share (2024).
- Technological Innovation: Advancements in 5G and LTE-Advanced technologies are driving higher speeds and capacity.
- Regulatory Landscape: Stringent regulations on spectrum licensing and infrastructure deployment influence market expansion.
- Competitive Substitutes: Fiber optics and satellite broadband offer alternative high-speed internet solutions.
- End-User Demographics: Growing demand from residential and commercial segments fuels market growth.
- M&A Trends: Consolidation through mergers and acquisitions is expected to intensify in the coming years, with approximately xx M&A deals anticipated between 2025 and 2033.
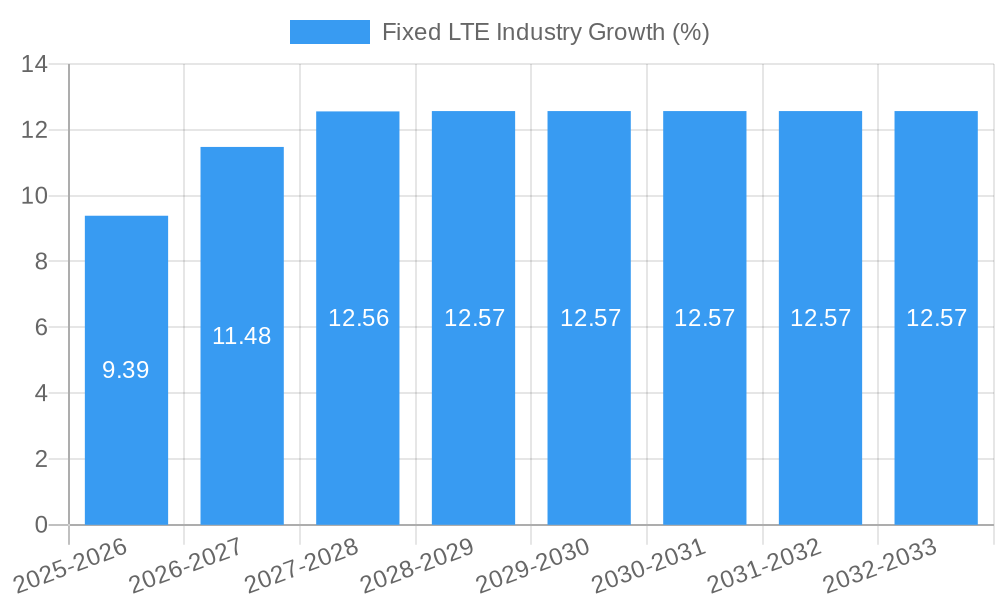
Fixed LTE Industry Growth Trends & Insights
The Fixed LTE market has witnessed robust growth over the historical period (2019-2024). Driven by increasing broadband penetration, rising adoption of smart devices, and the need for reliable high-speed internet access, the market size expanded significantly. The CAGR during this period was xx%. We project continued growth during the forecast period (2025-2033), with a CAGR of xx%. This growth will be fueled by several factors, including the expansion of LTE networks into underserved areas, the increasing affordability of LTE CPE devices, and the growing demand for reliable internet connectivity for remote work and education. Technological disruptions, such as the introduction of advanced LTE technologies and the convergence of LTE with other technologies, will further accelerate market growth. Consumer behavior is shifting towards greater demand for higher bandwidth and seamless connectivity. Market penetration in key regions is expected to increase from xx% in 2025 to xx% by 2033. The transition to more efficient and cost-effective LTE solutions is driving down the overall price points, increasing adoption across various user segments.
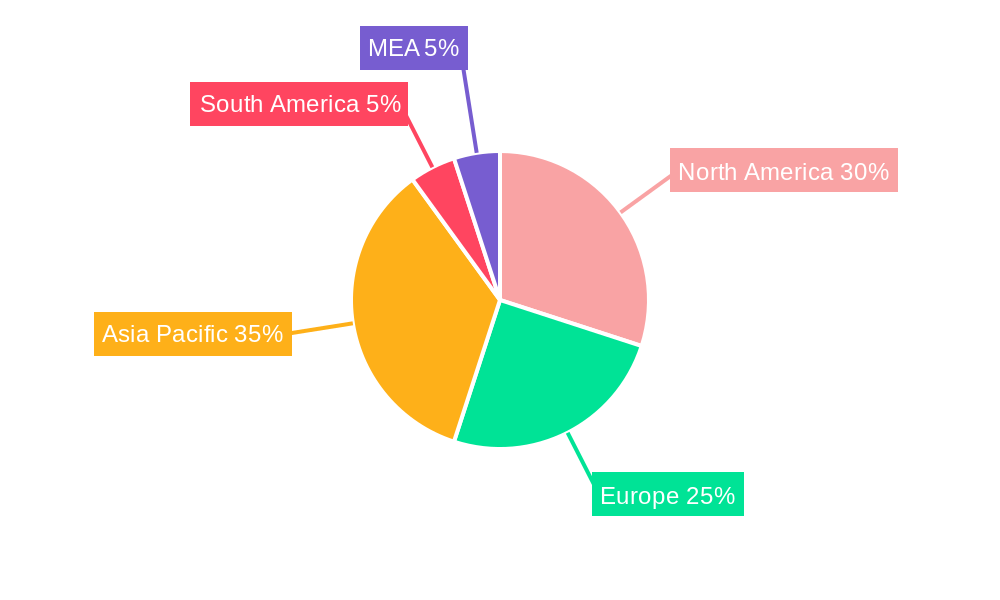
Dominant Regions, Countries, or Segments in Fixed LTE Industry
The North American and European regions currently dominate the Fixed LTE market, with significant contributions from countries like the United States, China, and Germany. The commercial segment accounts for a larger share of the market compared to the residential segment, driven by robust demand from businesses seeking high-bandwidth connections. Within the solutions category, LTE infrastructure solutions hold a larger share of the market compared to other solutions, however, the growth of Other Solution Types (Indoor CPE, Outdoor CPE) is faster.
Key Drivers:
- North America: Strong demand from businesses and residential users, advanced infrastructure development, and favorable regulatory policies.
- Europe: High broadband penetration, increasing adoption of IoT devices, and government initiatives promoting digitalization.
- Commercial Segment: Growing demand for reliable, high-speed internet connectivity for businesses, supporting remote work and digital transformation initiatives.
- LTE Infrastructure: Strong investments in network infrastructure upgrades and expansion, providing enhanced coverage and capacity. Other Solution Types (Indoor CPE, Outdoor CPE): Growing demand for reliable, high-speed internet connectivity in residential, SME, and commercial settings.
Dominance Factors:
- High broadband penetration rates in North America and Europe.
- Extensive LTE infrastructure deployment.
- Favorable government regulations promoting digitalization.
- Strong demand from both residential and commercial customers.
Fixed LTE Industry Product Landscape
The Fixed LTE product landscape is characterized by a wide range of solutions, including LTE infrastructure equipment (base stations, antennas, etc.), indoor and outdoor CPE devices (routers, modems), and related software and services. Recent innovations focus on increasing speed and capacity, improving network reliability, and enhancing security. Key features include advanced antenna technologies, MIMO (Multiple-Input and Multiple-Output) support, and carrier aggregation. These advancements are contributing to better user experiences and supporting the growing demand for high-bandwidth applications. Unique selling propositions include increased data rates, improved coverage, and enhanced security.
Key Drivers, Barriers & Challenges in Fixed LTE Industry
Key Drivers: The primary drivers include increasing demand for high-speed internet access, expanding LTE network coverage, the growing adoption of IoT devices, and government initiatives promoting digital infrastructure development. The increasing affordability of LTE CPE devices is another significant factor.
Challenges and Restraints: Key challenges include the cost of LTE infrastructure deployment, particularly in remote or underserved areas. Competition from alternative broadband technologies like fiber optics and satellite broadband poses a significant challenge. Regulatory hurdles regarding spectrum allocation and licensing can also hinder market growth. Supply chain disruptions can impact the availability and cost of components, influencing pricing and market dynamics.
Emerging Opportunities in Fixed LTE Industry
Emerging opportunities lie in the expansion of Fixed LTE into underserved areas, the integration of LTE with other technologies (such as IoT and 5G), and the development of innovative applications such as smart cities and industrial automation. The increasing demand for high-bandwidth applications in residential and commercial sectors presents significant growth potential.
Growth Accelerators in the Fixed LTE Industry Industry
Technological advancements, such as the development of more energy-efficient and cost-effective LTE infrastructure, are key growth catalysts. Strategic partnerships between telecom operators and technology providers are facilitating the deployment of LTE networks in new areas. Government initiatives promoting digitalization and investments in broadband infrastructure are further accelerating market growth.
Key Players Shaping the Fixed LTE Industry Market
- Motorola Solutions Inc
- Samsung Group
- ZyXel Communications Corp
- Teltronics (Hytera)
- Cisco Systems Inc
- L-com Global Connectivity
- Netgear Inc
- Sagemcom SAS
- Telenet Systems Pvt Ltd
- Huawei Technologies Co Ltd
- ZTE Corporation
- Aztech Group Ltd
- Arris International PLC
- Telrad Networks Ltd
- Shenzhen Zoolan Technology Co Ltd
- AT&T Inc
- Technicolor SA
- Datang Telecom Technology & Industry Group
- Telefonica SA
Notable Milestones in Fixed LTE Industry Sector
- December 2022: South African-based Huge group launched Fixed LTE services for SMEs, targeting 19,000 businesses initially.
- November 2022: Chile's San Antonio Terminal Internacional (STI) planned to implement Nokia's industrial-grade LTE network, enhancing port operations.
- October 2022: Nxtdigital launched NXTSkyFi, a broadband-over-satellite (BOS) solution, focusing on addressing crop management challenges in India.
In-Depth Fixed LTE Industry Market Outlook
The Fixed LTE market is poised for continued growth, driven by ongoing technological advancements, expanding network coverage, and increasing demand for high-speed internet access across residential and commercial segments. Strategic partnerships and investments in infrastructure development will further fuel market expansion. The market is expected to witness significant growth in emerging economies, presenting substantial opportunities for players. The evolution towards 5G and the convergence of LTE with other technologies will create new growth avenues, enhancing the market's long-term potential.
Fixed LTE Industry Segmentation
-
1. Type of User
- 1.1. Residential
- 1.2. Commercial
-
2. Type of Solution
- 2.1. LTE Infrastructure
- 2.2. Other Solution Types (Indoor CPE, Outdoor CPE)
Fixed LTE Industry Segmentation By Geography
-
1. North America
- 1.1. United States
- 1.2. Canada
-
2. Europe
- 2.1. United Kingdom
- 2.2. Germany
- 2.3. France
- 2.4. Rest of the Europe
-
3. Asia Pacific
- 3.1. China
- 3.2. Japan
- 3.3. India
- 3.4. Rest of the Asia Pacific
- 4. Latin America
- 5. Middle East and Africa
Fixed LTE Industry REPORT HIGHLIGHTS
| Aspects | Details |
|---|---|
| Study Period | 2019-2033 |
| Base Year | 2024 |
| Estimated Year | 2025 |
| Forecast Period | 2025-2033 |
| Historical Period | 2019-2024 |
| Growth Rate | CAGR of 24.97% from 2019-2033 |
| Segmentation |
|
Table of Contents
- 1. Introduction
- 1.1. Research Scope
- 1.2. Market Segmentation
- 1.3. Research Methodology
- 1.4. Definitions and Assumptions
- 2. Executive Summary
- 2.1. Introduction
- 3. Market Dynamics
- 3.1. Introduction
- 3.2. Market Drivers
- 3.2.1 Increased Adoption of Public Safety LTE.; Growing Demand For High Speed BroadBand In Rural Areas; Positive Outlook of Fixed LTE Compared to DSL
- 3.2.2 Fiber and Cable
- 3.3. Market Restrains
- 3.3.1. Network Performance Concerns
- 3.4. Market Trends
- 3.4.1. Residential Type of User Expected to Account for Significant Share
- 4. Market Factor Analysis
- 4.1. Porters Five Forces
- 4.2. Supply/Value Chain
- 4.3. PESTEL analysis
- 4.4. Market Entropy
- 4.5. Patent/Trademark Analysis
- 5. Global Fixed LTE Industry Analysis, Insights and Forecast, 2019-2031
- 5.1. Market Analysis, Insights and Forecast - by Type of User
- 5.1.1. Residential
- 5.1.2. Commercial
- 5.2. Market Analysis, Insights and Forecast - by Type of Solution
- 5.2.1. LTE Infrastructure
- 5.2.2. Other Solution Types (Indoor CPE, Outdoor CPE)
- 5.3. Market Analysis, Insights and Forecast - by Region
- 5.3.1. North America
- 5.3.2. Europe
- 5.3.3. Asia Pacific
- 5.3.4. Latin America
- 5.3.5. Middle East and Africa
- 5.1. Market Analysis, Insights and Forecast - by Type of User
- 6. North America Fixed LTE Industry Analysis, Insights and Forecast, 2019-2031
- 6.1. Market Analysis, Insights and Forecast - by Type of User
- 6.1.1. Residential
- 6.1.2. Commercial
- 6.2. Market Analysis, Insights and Forecast - by Type of Solution
- 6.2.1. LTE Infrastructure
- 6.2.2. Other Solution Types (Indoor CPE, Outdoor CPE)
- 6.1. Market Analysis, Insights and Forecast - by Type of User
- 7. Europe Fixed LTE Industry Analysis, Insights and Forecast, 2019-2031
- 7.1. Market Analysis, Insights and Forecast - by Type of User
- 7.1.1. Residential
- 7.1.2. Commercial
- 7.2. Market Analysis, Insights and Forecast - by Type of Solution
- 7.2.1. LTE Infrastructure
- 7.2.2. Other Solution Types (Indoor CPE, Outdoor CPE)
- 7.1. Market Analysis, Insights and Forecast - by Type of User
- 8. Asia Pacific Fixed LTE Industry Analysis, Insights and Forecast, 2019-2031
- 8.1. Market Analysis, Insights and Forecast - by Type of User
- 8.1.1. Residential
- 8.1.2. Commercial
- 8.2. Market Analysis, Insights and Forecast - by Type of Solution
- 8.2.1. LTE Infrastructure
- 8.2.2. Other Solution Types (Indoor CPE, Outdoor CPE)
- 8.1. Market Analysis, Insights and Forecast - by Type of User
- 9. Latin America Fixed LTE Industry Analysis, Insights and Forecast, 2019-2031
- 9.1. Market Analysis, Insights and Forecast - by Type of User
- 9.1.1. Residential
- 9.1.2. Commercial
- 9.2. Market Analysis, Insights and Forecast - by Type of Solution
- 9.2.1. LTE Infrastructure
- 9.2.2. Other Solution Types (Indoor CPE, Outdoor CPE)
- 9.1. Market Analysis, Insights and Forecast - by Type of User
- 10. Middle East and Africa Fixed LTE Industry Analysis, Insights and Forecast, 2019-2031
- 10.1. Market Analysis, Insights and Forecast - by Type of User
- 10.1.1. Residential
- 10.1.2. Commercial
- 10.2. Market Analysis, Insights and Forecast - by Type of Solution
- 10.2.1. LTE Infrastructure
- 10.2.2. Other Solution Types (Indoor CPE, Outdoor CPE)
- 10.1. Market Analysis, Insights and Forecast - by Type of User
- 11. North America Fixed LTE Industry Analysis, Insights and Forecast, 2019-2031
- 11.1. Market Analysis, Insights and Forecast - By Country/Sub-region
- 11.1.1 United States
- 11.1.2 Canada
- 11.1.3 Mexico
- 12. Europe Fixed LTE Industry Analysis, Insights and Forecast, 2019-2031
- 12.1. Market Analysis, Insights and Forecast - By Country/Sub-region
- 12.1.1 Germany
- 12.1.2 United Kingdom
- 12.1.3 France
- 12.1.4 Spain
- 12.1.5 Italy
- 12.1.6 Spain
- 12.1.7 Belgium
- 12.1.8 Netherland
- 12.1.9 Nordics
- 12.1.10 Rest of Europe
- 13. Asia Pacific Fixed LTE Industry Analysis, Insights and Forecast, 2019-2031
- 13.1. Market Analysis, Insights and Forecast - By Country/Sub-region
- 13.1.1 China
- 13.1.2 Japan
- 13.1.3 India
- 13.1.4 South Korea
- 13.1.5 Southeast Asia
- 13.1.6 Australia
- 13.1.7 Indonesia
- 13.1.8 Phillipes
- 13.1.9 Singapore
- 13.1.10 Thailandc
- 13.1.11 Rest of Asia Pacific
- 14. South America Fixed LTE Industry Analysis, Insights and Forecast, 2019-2031
- 14.1. Market Analysis, Insights and Forecast - By Country/Sub-region
- 14.1.1 Brazil
- 14.1.2 Argentina
- 14.1.3 Peru
- 14.1.4 Chile
- 14.1.5 Colombia
- 14.1.6 Ecuador
- 14.1.7 Venezuela
- 14.1.8 Rest of South America
- 15. North America Fixed LTE Industry Analysis, Insights and Forecast, 2019-2031
- 15.1. Market Analysis, Insights and Forecast - By Country/Sub-region
- 15.1.1 United States
- 15.1.2 Canada
- 15.1.3 Mexico
- 16. MEA Fixed LTE Industry Analysis, Insights and Forecast, 2019-2031
- 16.1. Market Analysis, Insights and Forecast - By Country/Sub-region
- 16.1.1 United Arab Emirates
- 16.1.2 Saudi Arabia
- 16.1.3 South Africa
- 16.1.4 Rest of Middle East and Africa
- 17. Competitive Analysis
- 17.1. Global Market Share Analysis 2024
- 17.2. Company Profiles
- 17.2.1 Motorola Solutions Inc
- 17.2.1.1. Overview
- 17.2.1.2. Products
- 17.2.1.3. SWOT Analysis
- 17.2.1.4. Recent Developments
- 17.2.1.5. Financials (Based on Availability)
- 17.2.2 Samsung Group
- 17.2.2.1. Overview
- 17.2.2.2. Products
- 17.2.2.3. SWOT Analysis
- 17.2.2.4. Recent Developments
- 17.2.2.5. Financials (Based on Availability)
- 17.2.3 ZyXel Communications Corp
- 17.2.3.1. Overview
- 17.2.3.2. Products
- 17.2.3.3. SWOT Analysis
- 17.2.3.4. Recent Developments
- 17.2.3.5. Financials (Based on Availability)
- 17.2.4 Teltronics (Hytera)
- 17.2.4.1. Overview
- 17.2.4.2. Products
- 17.2.4.3. SWOT Analysis
- 17.2.4.4. Recent Developments
- 17.2.4.5. Financials (Based on Availability)
- 17.2.5 Cisco Systems Inc
- 17.2.5.1. Overview
- 17.2.5.2. Products
- 17.2.5.3. SWOT Analysis
- 17.2.5.4. Recent Developments
- 17.2.5.5. Financials (Based on Availability)
- 17.2.6 L-com Global Connectivity
- 17.2.6.1. Overview
- 17.2.6.2. Products
- 17.2.6.3. SWOT Analysis
- 17.2.6.4. Recent Developments
- 17.2.6.5. Financials (Based on Availability)
- 17.2.7 Netgear Inc
- 17.2.7.1. Overview
- 17.2.7.2. Products
- 17.2.7.3. SWOT Analysis
- 17.2.7.4. Recent Developments
- 17.2.7.5. Financials (Based on Availability)
- 17.2.8 Sagemcom SAS
- 17.2.8.1. Overview
- 17.2.8.2. Products
- 17.2.8.3. SWOT Analysis
- 17.2.8.4. Recent Developments
- 17.2.8.5. Financials (Based on Availability)
- 17.2.9 Telenet Systems Pvt Ltd
- 17.2.9.1. Overview
- 17.2.9.2. Products
- 17.2.9.3. SWOT Analysis
- 17.2.9.4. Recent Developments
- 17.2.9.5. Financials (Based on Availability)
- 17.2.10 Huawei Technologies Co Ltd
- 17.2.10.1. Overview
- 17.2.10.2. Products
- 17.2.10.3. SWOT Analysis
- 17.2.10.4. Recent Developments
- 17.2.10.5. Financials (Based on Availability)
- 17.2.11 ZTE Corporation
- 17.2.11.1. Overview
- 17.2.11.2. Products
- 17.2.11.3. SWOT Analysis
- 17.2.11.4. Recent Developments
- 17.2.11.5. Financials (Based on Availability)
- 17.2.12 Aztech Group Ltd
- 17.2.12.1. Overview
- 17.2.12.2. Products
- 17.2.12.3. SWOT Analysis
- 17.2.12.4. Recent Developments
- 17.2.12.5. Financials (Based on Availability)
- 17.2.13 Arris International PLC
- 17.2.13.1. Overview
- 17.2.13.2. Products
- 17.2.13.3. SWOT Analysis
- 17.2.13.4. Recent Developments
- 17.2.13.5. Financials (Based on Availability)
- 17.2.14 Telrad Networks Ltd
- 17.2.14.1. Overview
- 17.2.14.2. Products
- 17.2.14.3. SWOT Analysis
- 17.2.14.4. Recent Developments
- 17.2.14.5. Financials (Based on Availability)
- 17.2.15 Shenzhen Zoolan Technology Co Ltd
- 17.2.15.1. Overview
- 17.2.15.2. Products
- 17.2.15.3. SWOT Analysis
- 17.2.15.4. Recent Developments
- 17.2.15.5. Financials (Based on Availability)
- 17.2.16 AT&T Inc
- 17.2.16.1. Overview
- 17.2.16.2. Products
- 17.2.16.3. SWOT Analysis
- 17.2.16.4. Recent Developments
- 17.2.16.5. Financials (Based on Availability)
- 17.2.17 Technicolor SA
- 17.2.17.1. Overview
- 17.2.17.2. Products
- 17.2.17.3. SWOT Analysis
- 17.2.17.4. Recent Developments
- 17.2.17.5. Financials (Based on Availability)
- 17.2.18 Datang Telecom Technology & Industry Group*List Not Exhaustive
- 17.2.18.1. Overview
- 17.2.18.2. Products
- 17.2.18.3. SWOT Analysis
- 17.2.18.4. Recent Developments
- 17.2.18.5. Financials (Based on Availability)
- 17.2.19 Telefonica SA
- 17.2.19.1. Overview
- 17.2.19.2. Products
- 17.2.19.3. SWOT Analysis
- 17.2.19.4. Recent Developments
- 17.2.19.5. Financials (Based on Availability)
- 17.2.1 Motorola Solutions Inc
List of Figures
- Figure 1: Global Fixed LTE Industry Revenue Breakdown (Million, %) by Region 2024 & 2032
- Figure 2: North America Fixed LTE Industry Revenue (Million), by Country 2024 & 2032
- Figure 3: North America Fixed LTE Industry Revenue Share (%), by Country 2024 & 2032
- Figure 4: Europe Fixed LTE Industry Revenue (Million), by Country 2024 & 2032
- Figure 5: Europe Fixed LTE Industry Revenue Share (%), by Country 2024 & 2032
- Figure 6: Asia Pacific Fixed LTE Industry Revenue (Million), by Country 2024 & 2032
- Figure 7: Asia Pacific Fixed LTE Industry Revenue Share (%), by Country 2024 & 2032
- Figure 8: South America Fixed LTE Industry Revenue (Million), by Country 2024 & 2032
- Figure 9: South America Fixed LTE Industry Revenue Share (%), by Country 2024 & 2032
- Figure 10: North America Fixed LTE Industry Revenue (Million), by Country 2024 & 2032
- Figure 11: North America Fixed LTE Industry Revenue Share (%), by Country 2024 & 2032
- Figure 12: MEA Fixed LTE Industry Revenue (Million), by Country 2024 & 2032
- Figure 13: MEA Fixed LTE Industry Revenue Share (%), by Country 2024 & 2032
- Figure 14: North America Fixed LTE Industry Revenue (Million), by Type of User 2024 & 2032
- Figure 15: North America Fixed LTE Industry Revenue Share (%), by Type of User 2024 & 2032
- Figure 16: North America Fixed LTE Industry Revenue (Million), by Type of Solution 2024 & 2032
- Figure 17: North America Fixed LTE Industry Revenue Share (%), by Type of Solution 2024 & 2032
- Figure 18: North America Fixed LTE Industry Revenue (Million), by Country 2024 & 2032
- Figure 19: North America Fixed LTE Industry Revenue Share (%), by Country 2024 & 2032
- Figure 20: Europe Fixed LTE Industry Revenue (Million), by Type of User 2024 & 2032
- Figure 21: Europe Fixed LTE Industry Revenue Share (%), by Type of User 2024 & 2032
- Figure 22: Europe Fixed LTE Industry Revenue (Million), by Type of Solution 2024 & 2032
- Figure 23: Europe Fixed LTE Industry Revenue Share (%), by Type of Solution 2024 & 2032
- Figure 24: Europe Fixed LTE Industry Revenue (Million), by Country 2024 & 2032
- Figure 25: Europe Fixed LTE Industry Revenue Share (%), by Country 2024 & 2032
- Figure 26: Asia Pacific Fixed LTE Industry Revenue (Million), by Type of User 2024 & 2032
- Figure 27: Asia Pacific Fixed LTE Industry Revenue Share (%), by Type of User 2024 & 2032
- Figure 28: Asia Pacific Fixed LTE Industry Revenue (Million), by Type of Solution 2024 & 2032
- Figure 29: Asia Pacific Fixed LTE Industry Revenue Share (%), by Type of Solution 2024 & 2032
- Figure 30: Asia Pacific Fixed LTE Industry Revenue (Million), by Country 2024 & 2032
- Figure 31: Asia Pacific Fixed LTE Industry Revenue Share (%), by Country 2024 & 2032
- Figure 32: Latin America Fixed LTE Industry Revenue (Million), by Type of User 2024 & 2032
- Figure 33: Latin America Fixed LTE Industry Revenue Share (%), by Type of User 2024 & 2032
- Figure 34: Latin America Fixed LTE Industry Revenue (Million), by Type of Solution 2024 & 2032
- Figure 35: Latin America Fixed LTE Industry Revenue Share (%), by Type of Solution 2024 & 2032
- Figure 36: Latin America Fixed LTE Industry Revenue (Million), by Country 2024 & 2032
- Figure 37: Latin America Fixed LTE Industry Revenue Share (%), by Country 2024 & 2032
- Figure 38: Middle East and Africa Fixed LTE Industry Revenue (Million), by Type of User 2024 & 2032
- Figure 39: Middle East and Africa Fixed LTE Industry Revenue Share (%), by Type of User 2024 & 2032
- Figure 40: Middle East and Africa Fixed LTE Industry Revenue (Million), by Type of Solution 2024 & 2032
- Figure 41: Middle East and Africa Fixed LTE Industry Revenue Share (%), by Type of Solution 2024 & 2032
- Figure 42: Middle East and Africa Fixed LTE Industry Revenue (Million), by Country 2024 & 2032
- Figure 43: Middle East and Africa Fixed LTE Industry Revenue Share (%), by Country 2024 & 2032
List of Tables
- Table 1: Global Fixed LTE Industry Revenue Million Forecast, by Region 2019 & 2032
- Table 2: Global Fixed LTE Industry Revenue Million Forecast, by Type of User 2019 & 2032
- Table 3: Global Fixed LTE Industry Revenue Million Forecast, by Type of Solution 2019 & 2032
- Table 4: Global Fixed LTE Industry Revenue Million Forecast, by Region 2019 & 2032
- Table 5: Global Fixed LTE Industry Revenue Million Forecast, by Country 2019 & 2032
- Table 6: United States Fixed LTE Industry Revenue (Million) Forecast, by Application 2019 & 2032
- Table 7: Canada Fixed LTE Industry Revenue (Million) Forecast, by Application 2019 & 2032
- Table 8: Mexico Fixed LTE Industry Revenue (Million) Forecast, by Application 2019 & 2032
- Table 9: Global Fixed LTE Industry Revenue Million Forecast, by Country 2019 & 2032
- Table 10: Germany Fixed LTE Industry Revenue (Million) Forecast, by Application 2019 & 2032
- Table 11: United Kingdom Fixed LTE Industry Revenue (Million) Forecast, by Application 2019 & 2032
- Table 12: France Fixed LTE Industry Revenue (Million) Forecast, by Application 2019 & 2032
- Table 13: Spain Fixed LTE Industry Revenue (Million) Forecast, by Application 2019 & 2032
- Table 14: Italy Fixed LTE Industry Revenue (Million) Forecast, by Application 2019 & 2032
- Table 15: Spain Fixed LTE Industry Revenue (Million) Forecast, by Application 2019 & 2032
- Table 16: Belgium Fixed LTE Industry Revenue (Million) Forecast, by Application 2019 & 2032
- Table 17: Netherland Fixed LTE Industry Revenue (Million) Forecast, by Application 2019 & 2032
- Table 18: Nordics Fixed LTE Industry Revenue (Million) Forecast, by Application 2019 & 2032
- Table 19: Rest of Europe Fixed LTE Industry Revenue (Million) Forecast, by Application 2019 & 2032
- Table 20: Global Fixed LTE Industry Revenue Million Forecast, by Country 2019 & 2032
- Table 21: China Fixed LTE Industry Revenue (Million) Forecast, by Application 2019 & 2032
- Table 22: Japan Fixed LTE Industry Revenue (Million) Forecast, by Application 2019 & 2032
- Table 23: India Fixed LTE Industry Revenue (Million) Forecast, by Application 2019 & 2032
- Table 24: South Korea Fixed LTE Industry Revenue (Million) Forecast, by Application 2019 & 2032
- Table 25: Southeast Asia Fixed LTE Industry Revenue (Million) Forecast, by Application 2019 & 2032
- Table 26: Australia Fixed LTE Industry Revenue (Million) Forecast, by Application 2019 & 2032
- Table 27: Indonesia Fixed LTE Industry Revenue (Million) Forecast, by Application 2019 & 2032
- Table 28: Phillipes Fixed LTE Industry Revenue (Million) Forecast, by Application 2019 & 2032
- Table 29: Singapore Fixed LTE Industry Revenue (Million) Forecast, by Application 2019 & 2032
- Table 30: Thailandc Fixed LTE Industry Revenue (Million) Forecast, by Application 2019 & 2032
- Table 31: Rest of Asia Pacific Fixed LTE Industry Revenue (Million) Forecast, by Application 2019 & 2032
- Table 32: Global Fixed LTE Industry Revenue Million Forecast, by Country 2019 & 2032
- Table 33: Brazil Fixed LTE Industry Revenue (Million) Forecast, by Application 2019 & 2032
- Table 34: Argentina Fixed LTE Industry Revenue (Million) Forecast, by Application 2019 & 2032
- Table 35: Peru Fixed LTE Industry Revenue (Million) Forecast, by Application 2019 & 2032
- Table 36: Chile Fixed LTE Industry Revenue (Million) Forecast, by Application 2019 & 2032
- Table 37: Colombia Fixed LTE Industry Revenue (Million) Forecast, by Application 2019 & 2032
- Table 38: Ecuador Fixed LTE Industry Revenue (Million) Forecast, by Application 2019 & 2032
- Table 39: Venezuela Fixed LTE Industry Revenue (Million) Forecast, by Application 2019 & 2032
- Table 40: Rest of South America Fixed LTE Industry Revenue (Million) Forecast, by Application 2019 & 2032
- Table 41: Global Fixed LTE Industry Revenue Million Forecast, by Country 2019 & 2032
- Table 42: United States Fixed LTE Industry Revenue (Million) Forecast, by Application 2019 & 2032
- Table 43: Canada Fixed LTE Industry Revenue (Million) Forecast, by Application 2019 & 2032
- Table 44: Mexico Fixed LTE Industry Revenue (Million) Forecast, by Application 2019 & 2032
- Table 45: Global Fixed LTE Industry Revenue Million Forecast, by Country 2019 & 2032
- Table 46: United Arab Emirates Fixed LTE Industry Revenue (Million) Forecast, by Application 2019 & 2032
- Table 47: Saudi Arabia Fixed LTE Industry Revenue (Million) Forecast, by Application 2019 & 2032
- Table 48: South Africa Fixed LTE Industry Revenue (Million) Forecast, by Application 2019 & 2032
- Table 49: Rest of Middle East and Africa Fixed LTE Industry Revenue (Million) Forecast, by Application 2019 & 2032
- Table 50: Global Fixed LTE Industry Revenue Million Forecast, by Type of User 2019 & 2032
- Table 51: Global Fixed LTE Industry Revenue Million Forecast, by Type of Solution 2019 & 2032
- Table 52: Global Fixed LTE Industry Revenue Million Forecast, by Country 2019 & 2032
- Table 53: United States Fixed LTE Industry Revenue (Million) Forecast, by Application 2019 & 2032
- Table 54: Canada Fixed LTE Industry Revenue (Million) Forecast, by Application 2019 & 2032
- Table 55: Global Fixed LTE Industry Revenue Million Forecast, by Type of User 2019 & 2032
- Table 56: Global Fixed LTE Industry Revenue Million Forecast, by Type of Solution 2019 & 2032
- Table 57: Global Fixed LTE Industry Revenue Million Forecast, by Country 2019 & 2032
- Table 58: United Kingdom Fixed LTE Industry Revenue (Million) Forecast, by Application 2019 & 2032
- Table 59: Germany Fixed LTE Industry Revenue (Million) Forecast, by Application 2019 & 2032
- Table 60: France Fixed LTE Industry Revenue (Million) Forecast, by Application 2019 & 2032
- Table 61: Rest of the Europe Fixed LTE Industry Revenue (Million) Forecast, by Application 2019 & 2032
- Table 62: Global Fixed LTE Industry Revenue Million Forecast, by Type of User 2019 & 2032
- Table 63: Global Fixed LTE Industry Revenue Million Forecast, by Type of Solution 2019 & 2032
- Table 64: Global Fixed LTE Industry Revenue Million Forecast, by Country 2019 & 2032
- Table 65: China Fixed LTE Industry Revenue (Million) Forecast, by Application 2019 & 2032
- Table 66: Japan Fixed LTE Industry Revenue (Million) Forecast, by Application 2019 & 2032
- Table 67: India Fixed LTE Industry Revenue (Million) Forecast, by Application 2019 & 2032
- Table 68: Rest of the Asia Pacific Fixed LTE Industry Revenue (Million) Forecast, by Application 2019 & 2032
- Table 69: Global Fixed LTE Industry Revenue Million Forecast, by Type of User 2019 & 2032
- Table 70: Global Fixed LTE Industry Revenue Million Forecast, by Type of Solution 2019 & 2032
- Table 71: Global Fixed LTE Industry Revenue Million Forecast, by Country 2019 & 2032
- Table 72: Global Fixed LTE Industry Revenue Million Forecast, by Type of User 2019 & 2032
- Table 73: Global Fixed LTE Industry Revenue Million Forecast, by Type of Solution 2019 & 2032
- Table 74: Global Fixed LTE Industry Revenue Million Forecast, by Country 2019 & 2032
Frequently Asked Questions
1. What is the projected Compound Annual Growth Rate (CAGR) of the Fixed LTE Industry?
The projected CAGR is approximately 24.97%.
2. Which companies are prominent players in the Fixed LTE Industry?
Key companies in the market include Motorola Solutions Inc, Samsung Group, ZyXel Communications Corp, Teltronics (Hytera), Cisco Systems Inc, L-com Global Connectivity, Netgear Inc, Sagemcom SAS, Telenet Systems Pvt Ltd, Huawei Technologies Co Ltd, ZTE Corporation, Aztech Group Ltd, Arris International PLC, Telrad Networks Ltd, Shenzhen Zoolan Technology Co Ltd, AT&T Inc, Technicolor SA, Datang Telecom Technology & Industry Group*List Not Exhaustive, Telefonica SA.
3. What are the main segments of the Fixed LTE Industry?
The market segments include Type of User, Type of Solution.
4. Can you provide details about the market size?
The market size is estimated to be USD 37.97 Million as of 2022.
5. What are some drivers contributing to market growth?
Increased Adoption of Public Safety LTE.; Growing Demand For High Speed BroadBand In Rural Areas; Positive Outlook of Fixed LTE Compared to DSL. Fiber and Cable.
6. What are the notable trends driving market growth?
Residential Type of User Expected to Account for Significant Share.
7. Are there any restraints impacting market growth?
Network Performance Concerns.
8. Can you provide examples of recent developments in the market?
December 2022 - South African-based Huge group formed a new business group to offer Fixed LTE services to SMEs (Small and Small-Medium Enterprises). The company has designed smaller internet packages suitable for work-from-home scenarios and large packages to serve big organizations. The group already has a combined customer base of 19000 19 000 businesses and SMEs and plans to expand this further.
9. What pricing options are available for accessing the report?
Pricing options include single-user, multi-user, and enterprise licenses priced at USD 4750, USD 5250, and USD 8750 respectively.
10. Is the market size provided in terms of value or volume?
The market size is provided in terms of value, measured in Million.
11. Are there any specific market keywords associated with the report?
Yes, the market keyword associated with the report is "Fixed LTE Industry," which aids in identifying and referencing the specific market segment covered.
12. How do I determine which pricing option suits my needs best?
The pricing options vary based on user requirements and access needs. Individual users may opt for single-user licenses, while businesses requiring broader access may choose multi-user or enterprise licenses for cost-effective access to the report.
13. Are there any additional resources or data provided in the Fixed LTE Industry report?
While the report offers comprehensive insights, it's advisable to review the specific contents or supplementary materials provided to ascertain if additional resources or data are available.
14. How can I stay updated on further developments or reports in the Fixed LTE Industry?
To stay informed about further developments, trends, and reports in the Fixed LTE Industry, consider subscribing to industry newsletters, following relevant companies and organizations, or regularly checking reputable industry news sources and publications.
Methodology
Step 1 - Identification of Relevant Samples Size from Population Database


Step 2 - Approaches for Defining Global Market Size (Value, Volume* & Price*)

Note*: In applicable scenarios
Step 3 - Data Sources
Primary Research
- Web Analytics
- Survey Reports
- Research Institute
- Latest Research Reports
- Opinion Leaders
Secondary Research
- Annual Reports
- White Paper
- Latest Press Release
- Industry Association
- Paid Database
- Investor Presentations

Step 4 - Data Triangulation
Involves using different sources of information in order to increase the validity of a study
These sources are likely to be stakeholders in a program - participants, other researchers, program staff, other community members, and so on.
Then we put all data in single framework & apply various statistical tools to find out the dynamic on the market.
During the analysis stage, feedback from the stakeholder groups would be compared to determine areas of agreement as well as areas of divergence


