

Key Insights
The global fire-rated busway market is poised for significant expansion, propelled by escalating demand for advanced electrical safety solutions in commercial and industrial sectors. Driven by stringent fire safety regulations and the widespread adoption of energy-efficient electrical systems, the market is segmented by voltage rating (low, medium, high), installation type (vertical, horizontal), and end-user industry (data centers, healthcare, manufacturing). With an estimated market size of 8.98 billion in the base year 2025 and a projected Compound Annual Growth Rate (CAGR) of 1.58, the market is set for substantial growth. Fire-rated busways offer distinct advantages, including space efficiency, high current capacity, and superior fire protection over conventional wiring, fueling this positive trajectory. Leading industry players are actively investing in R&D to enhance product features and broaden their market presence. Innovations in insulation materials and intelligent monitoring systems further bolster the appeal and growth of fire-rated busways.
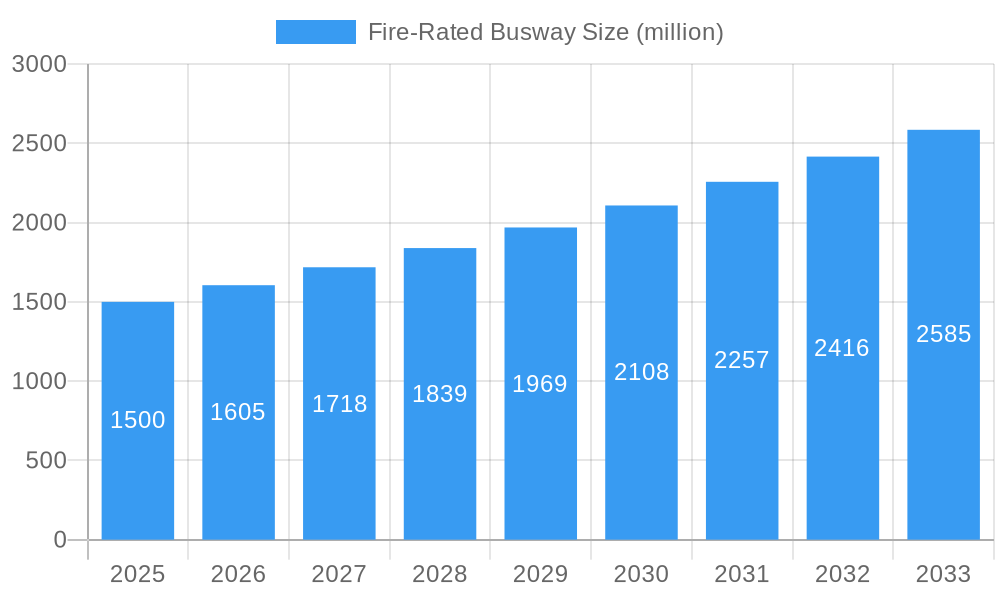
Fire-Rated Busway Market Size (In Billion)
Despite the promising outlook, the market encounters challenges such as high initial investment costs and the requirement for specialized installation expertise, which may temper adoption, especially for smaller enterprises. Nevertheless, the long-term advantages of enhanced fire safety and operational efficiency are anticipated to overcome these hurdles, ensuring sustained market growth. Future market development will likely be shaped by increased fire safety awareness, advancements in intelligent building technologies, and more rigorous building codes mandating sophisticated fire protection systems, thereby increasing the demand for fire-rated busways.
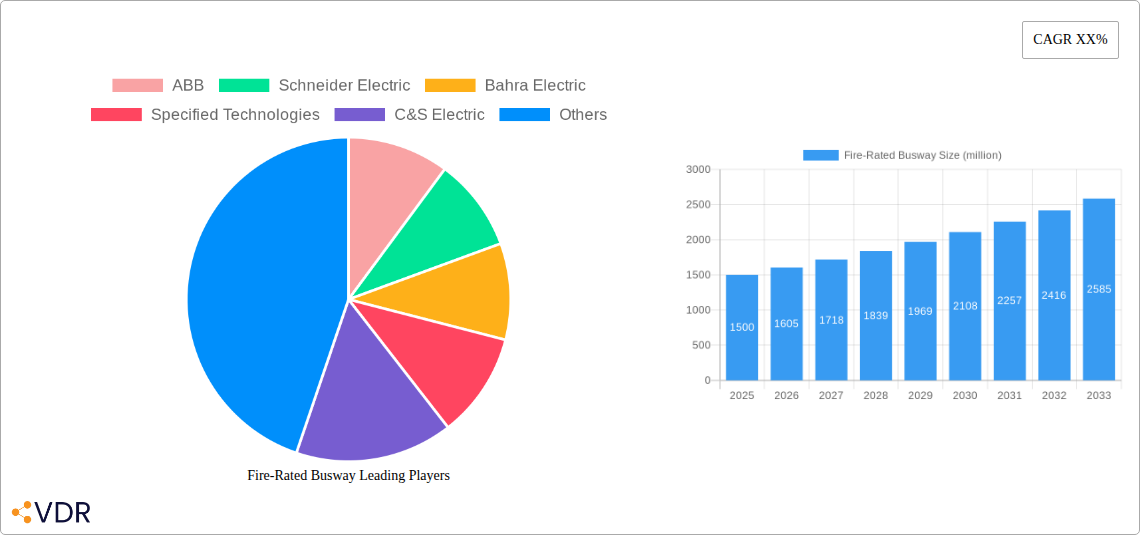
Fire-Rated Busway Company Market Share
Fire-Rated Busway Market Report: 2019-2033
This comprehensive report provides an in-depth analysis of the global Fire-Rated Busway market, encompassing historical data (2019-2024), current estimates (2025), and future projections (2025-2033). The report meticulously examines market dynamics, growth trends, regional dominance, product innovation, key players, and emerging opportunities within the electrical power distribution and industrial automation sectors. With a focus on key players like ABB, Schneider Electric, and GE, this report is essential for industry professionals, investors, and strategic decision-makers seeking to navigate this rapidly evolving market. The total market size in 2025 is estimated at $XX million.
Fire-Rated Busway Market Dynamics & Structure
The fire-rated busway market is characterized by moderate concentration, with key players holding significant market share. ABB, Schneider Electric, and GE collectively account for an estimated XX% of the global market in 2025. Technological innovation, driven by increasing demand for enhanced safety and reliability in power distribution systems, is a key driver. Stringent safety regulations across various industries, particularly in data centers and healthcare facilities, significantly influence market growth. The market faces competition from alternative power distribution solutions, such as cable trays, but fire-rated busways maintain a competitive edge due to their superior fire protection capabilities. M&A activity has been relatively modest in recent years, with approximately XX deals recorded between 2019 and 2024, mostly focused on consolidating regional players.
- Market Concentration: Oligopolistic, with top three players holding XX% market share in 2025.
- Technological Innovation: Focus on improved fire resistance, enhanced thermal management, and smart monitoring capabilities.
- Regulatory Frameworks: Stringent safety standards drive adoption, particularly in North America and Europe.
- Competitive Substitutes: Cable trays and other traditional power distribution systems pose moderate competition.
- End-User Demographics: Data centers, healthcare facilities, industrial manufacturing plants, and commercial buildings are key end-users.
- M&A Trends: Low level of M&A activity (XX deals from 2019-2024), indicating a stable market landscape with consolidation opportunities.
Fire-Rated Busway Growth Trends & Insights
The global fire-rated busway market experienced steady growth during the historical period (2019-2024), with a CAGR of XX%. This growth is projected to accelerate during the forecast period (2025-2033), reaching a CAGR of XX%, driven by increasing infrastructure development, rising industrialization in emerging economies, and growing adoption in data centers. Technological advancements, including the integration of smart sensors and remote monitoring systems, are enhancing the functionality and appeal of fire-rated busways. The market penetration rate in key regions like North America and Europe is high, while significant growth potential exists in developing markets of Asia-Pacific and the Middle East. Consumer behavior shifts towards prioritizing safety and reliability in critical power systems further bolster market growth. Market size is expected to reach $XX million by 2033.
Dominant Regions, Countries, or Segments in Fire-Rated Busway
North America currently holds the largest market share in the fire-rated busway sector, driven by robust infrastructure spending, stringent safety regulations, and a high concentration of data centers and industrial facilities. Europe follows closely, demonstrating strong growth due to similar factors. However, the Asia-Pacific region is anticipated to exhibit the fastest growth rate during the forecast period, fueled by rapid industrialization, urbanization, and increasing investments in power infrastructure projects. The market segment within industrial manufacturing plants is expected to contribute largely.
- North America: Strong regulatory environment, high infrastructure spending, substantial data center presence.
- Europe: Similar drivers to North America, with emphasis on energy efficiency and renewable energy integration.
- Asia-Pacific: Fastest-growing region, driven by rapid industrialization, urbanization, and rising power demand.
- Middle East & Africa: Significant growth potential fueled by infrastructure development and industrial expansion.
Fire-Rated Busway Product Landscape
Fire-rated busways offer various configurations, including insulated and non-insulated types, catering to diverse application needs. Recent innovations focus on improved fire resistance ratings, enhanced thermal performance, and integrated monitoring systems for predictive maintenance. Unique selling propositions include superior safety, reliability, and space-saving designs compared to traditional power distribution methods. Technological advancements involve using advanced materials and intelligent sensor integration to optimize efficiency and safety.
Key Drivers, Barriers & Challenges in Fire-Rated Busway
Key Drivers:
- Growing demand for enhanced safety and reliability in power distribution.
- Stringent safety regulations across various industries.
- Increasing investments in infrastructure development globally.
- Rising adoption of fire-rated busways in data centers and healthcare facilities.
Key Challenges & Restraints:
- High initial investment costs compared to traditional solutions.
- Complex installation processes requiring specialized expertise.
- Potential supply chain disruptions impacting material availability and costs.
- Competition from alternative power distribution systems.
Emerging Opportunities in Fire-Rated Busway
Untapped markets in developing economies present substantial growth opportunities. The integration of smart technologies, such as IoT sensors and AI-driven predictive maintenance, offers significant potential for enhanced product value and market expansion. Furthermore, evolving consumer preferences towards sustainable and environmentally friendly solutions will drive demand for energy-efficient fire-rated busway systems.
Growth Accelerators in the Fire-Rated Busway Industry
Technological advancements in fire-resistant materials and smart monitoring systems will drive innovation and market growth. Strategic partnerships between manufacturers and system integrators will enhance market penetration and create integrated solutions. Expansion into emerging markets and developing tailored solutions for specific industry applications will further fuel market expansion.
Key Players Shaping the Fire-Rated Busway Market
- ABB
- Schneider Electric
- Bahra Electric
- Specified Technologies
- C&S Electric
- Davis Malaysia
- EAE Elektrik
- GE
Notable Milestones in Fire-Rated Busway Sector
- 2020: Introduction of a new fire-rated busway system with enhanced thermal management by ABB.
- 2022: Schneider Electric acquires a regional fire-rated busway manufacturer, expanding its market presence.
- 2023: Launch of a smart fire-rated busway with integrated monitoring capabilities by GE.
- 2024: Publication of updated safety standards for fire-rated busways in several countries.
In-Depth Fire-Rated Busway Market Outlook
The fire-rated busway market is poised for robust growth in the coming years, driven by sustained technological innovation, increasing infrastructure development, and heightened safety concerns across various industries. Strategic opportunities lie in developing advanced, smart solutions for niche applications, expanding into untapped markets, and forming strategic alliances to optimize supply chain efficiency and distribution channels. The market is expected to experience significant expansion, creating lucrative opportunities for industry players and investors alike.
Fire-Rated Busway Segmentation
-
1. Application
- 1.1. Petrochemical
- 1.2. Metallurgy
- 1.3. Building
- 1.4. Other
-
2. Types
- 2.1. Aluminium Busbar
- 2.2. Copper Busbar
Fire-Rated Busway Segmentation By Geography
-
1. North America
- 1.1. United States
- 1.2. Canada
- 1.3. Mexico
-
2. South America
- 2.1. Brazil
- 2.2. Argentina
- 2.3. Rest of South America
-
3. Europe
- 3.1. United Kingdom
- 3.2. Germany
- 3.3. France
- 3.4. Italy
- 3.5. Spain
- 3.6. Russia
- 3.7. Benelux
- 3.8. Nordics
- 3.9. Rest of Europe
-
4. Middle East & Africa
- 4.1. Turkey
- 4.2. Israel
- 4.3. GCC
- 4.4. North Africa
- 4.5. South Africa
- 4.6. Rest of Middle East & Africa
-
5. Asia Pacific
- 5.1. China
- 5.2. India
- 5.3. Japan
- 5.4. South Korea
- 5.5. ASEAN
- 5.6. Oceania
- 5.7. Rest of Asia Pacific

Fire-Rated Busway Regional Market Share
Geographic Coverage of Fire-Rated Busway
Fire-Rated Busway REPORT HIGHLIGHTS
| Aspects | Details |
|---|---|
| Study Period | 2020-2034 |
| Base Year | 2025 |
| Estimated Year | 2026 |
| Forecast Period | 2026-2034 |
| Historical Period | 2020-2025 |
| Growth Rate | CAGR of 1.58% from 2020-2034 |
| Segmentation |
|
Table of Contents
- 1. Introduction
- 1.1. Research Scope
- 1.2. Market Segmentation
- 1.3. Research Objective
- 1.4. Definitions and Assumptions
- 2. Executive Summary
- 2.1. Market Snapshot
- 3. Market Dynamics
- 3.1. Market Drivers
- 3.2. Market Restrains
- 3.3. Market Trends
- 3.4. Market Opportunities
- 4. Market Factor Analysis
- 4.1. Porters Five Forces
- 4.1.1. Bargaining Power of Suppliers
- 4.1.2. Bargaining Power of Buyers
- 4.1.3. Threat of New Entrants
- 4.1.4. Threat of Substitutes
- 4.1.5. Competitive Rivalry
- 4.2. PESTEL analysis
- 4.3. BCG Analysis
- 4.3.1. Stars (High Growth, High Market Share)
- 4.3.2. Cash Cows (Low Growth, High Market Share)
- 4.3.3. Question Mark (High Growth, Low Market Share)
- 4.3.4. Dogs (Low Growth, Low Market Share)
- 4.4. Ansoff Matrix Analysis
- 4.5. Supply Chain Analysis
- 4.6. Regulatory Landscape
- 4.7. Current Market Potential and Opportunity Assessment (TAM–SAM–SOM Framework)
- 4.8. VDR Analyst Note
- 4.1. Porters Five Forces
- 5. Market Analysis, Insights and Forecast 2021-2033
- 5.1. Market Analysis, Insights and Forecast - by Application
- 5.1.1. Petrochemical
- 5.1.2. Metallurgy
- 5.1.3. Building
- 5.1.4. Other
- 5.2. Market Analysis, Insights and Forecast - by Types
- 5.2.1. Aluminium Busbar
- 5.2.2. Copper Busbar
- 5.3. Market Analysis, Insights and Forecast - by Region
- 5.3.1. North America
- 5.3.2. South America
- 5.3.3. Europe
- 5.3.4. Middle East & Africa
- 5.3.5. Asia Pacific
- 5.1. Market Analysis, Insights and Forecast - by Application
- 6. Global Fire-Rated Busway Analysis, Insights and Forecast, 2021-2033
- 6.1. Market Analysis, Insights and Forecast - by Application
- 6.1.1. Petrochemical
- 6.1.2. Metallurgy
- 6.1.3. Building
- 6.1.4. Other
- 6.2. Market Analysis, Insights and Forecast - by Types
- 6.2.1. Aluminium Busbar
- 6.2.2. Copper Busbar
- 6.1. Market Analysis, Insights and Forecast - by Application
- 7. North America Fire-Rated Busway Analysis, Insights and Forecast, 2021-2033
- 7.1. Market Analysis, Insights and Forecast - by Application
- 7.1.1. Petrochemical
- 7.1.2. Metallurgy
- 7.1.3. Building
- 7.1.4. Other
- 7.2. Market Analysis, Insights and Forecast - by Types
- 7.2.1. Aluminium Busbar
- 7.2.2. Copper Busbar
- 7.1. Market Analysis, Insights and Forecast - by Application
- 8. South America Fire-Rated Busway Analysis, Insights and Forecast, 2021-2033
- 8.1. Market Analysis, Insights and Forecast - by Application
- 8.1.1. Petrochemical
- 8.1.2. Metallurgy
- 8.1.3. Building
- 8.1.4. Other
- 8.2. Market Analysis, Insights and Forecast - by Types
- 8.2.1. Aluminium Busbar
- 8.2.2. Copper Busbar
- 8.1. Market Analysis, Insights and Forecast - by Application
- 9. Europe Fire-Rated Busway Analysis, Insights and Forecast, 2021-2033
- 9.1. Market Analysis, Insights and Forecast - by Application
- 9.1.1. Petrochemical
- 9.1.2. Metallurgy
- 9.1.3. Building
- 9.1.4. Other
- 9.2. Market Analysis, Insights and Forecast - by Types
- 9.2.1. Aluminium Busbar
- 9.2.2. Copper Busbar
- 9.1. Market Analysis, Insights and Forecast - by Application
- 10. Middle East & Africa Fire-Rated Busway Analysis, Insights and Forecast, 2021-2033
- 10.1. Market Analysis, Insights and Forecast - by Application
- 10.1.1. Petrochemical
- 10.1.2. Metallurgy
- 10.1.3. Building
- 10.1.4. Other
- 10.2. Market Analysis, Insights and Forecast - by Types
- 10.2.1. Aluminium Busbar
- 10.2.2. Copper Busbar
- 10.1. Market Analysis, Insights and Forecast - by Application
- 11. Asia Pacific Fire-Rated Busway Analysis, Insights and Forecast, 2021-2033
- 11.1. Market Analysis, Insights and Forecast - by Application
- 11.1.1. Petrochemical
- 11.1.2. Metallurgy
- 11.1.3. Building
- 11.1.4. Other
- 11.2. Market Analysis, Insights and Forecast - by Types
- 11.2.1. Aluminium Busbar
- 11.2.2. Copper Busbar
- 11.1. Market Analysis, Insights and Forecast - by Application
- 12. Competitive Analysis
- 12.1. Company Profiles
- 12.1.1 ABB
- 12.1.1.1. Company Overview
- 12.1.1.2. Products
- 12.1.1.3. Company Financials
- 12.1.1.4. SWOT Analysis
- 12.1.2 Schneider Electric
- 12.1.2.1. Company Overview
- 12.1.2.2. Products
- 12.1.2.3. Company Financials
- 12.1.2.4. SWOT Analysis
- 12.1.3 Bahra Electric
- 12.1.3.1. Company Overview
- 12.1.3.2. Products
- 12.1.3.3. Company Financials
- 12.1.3.4. SWOT Analysis
- 12.1.4 Specified Technologies
- 12.1.4.1. Company Overview
- 12.1.4.2. Products
- 12.1.4.3. Company Financials
- 12.1.4.4. SWOT Analysis
- 12.1.5 C&S Electric
- 12.1.5.1. Company Overview
- 12.1.5.2. Products
- 12.1.5.3. Company Financials
- 12.1.5.4. SWOT Analysis
- 12.1.6 Davis Malaysia
- 12.1.6.1. Company Overview
- 12.1.6.2. Products
- 12.1.6.3. Company Financials
- 12.1.6.4. SWOT Analysis
- 12.1.7 EAE Elektrik
- 12.1.7.1. Company Overview
- 12.1.7.2. Products
- 12.1.7.3. Company Financials
- 12.1.7.4. SWOT Analysis
- 12.1.8 GE
- 12.1.8.1. Company Overview
- 12.1.8.2. Products
- 12.1.8.3. Company Financials
- 12.1.8.4. SWOT Analysis
- 12.1.1 ABB
- 12.2. Market Entropy
- 12.2.1 Company's Key Areas Served
- 12.2.2 Recent Developments
- 12.3. Company Market Share Analysis 2025
- 12.3.1 Top 5 Companies Market Share Analysis
- 12.3.2 Top 3 Companies Market Share Analysis
- 12.4. List of Potential Customers
- 13. Research Methodology
List of Figures
- Figure 1: Global Fire-Rated Busway Revenue Breakdown (billion, %) by Region 2025 & 2033
- Figure 2: North America Fire-Rated Busway Revenue (billion), by Application 2025 & 2033
- Figure 3: North America Fire-Rated Busway Revenue Share (%), by Application 2025 & 2033
- Figure 4: North America Fire-Rated Busway Revenue (billion), by Types 2025 & 2033
- Figure 5: North America Fire-Rated Busway Revenue Share (%), by Types 2025 & 2033
- Figure 6: North America Fire-Rated Busway Revenue (billion), by Country 2025 & 2033
- Figure 7: North America Fire-Rated Busway Revenue Share (%), by Country 2025 & 2033
- Figure 8: South America Fire-Rated Busway Revenue (billion), by Application 2025 & 2033
- Figure 9: South America Fire-Rated Busway Revenue Share (%), by Application 2025 & 2033
- Figure 10: South America Fire-Rated Busway Revenue (billion), by Types 2025 & 2033
- Figure 11: South America Fire-Rated Busway Revenue Share (%), by Types 2025 & 2033
- Figure 12: South America Fire-Rated Busway Revenue (billion), by Country 2025 & 2033
- Figure 13: South America Fire-Rated Busway Revenue Share (%), by Country 2025 & 2033
- Figure 14: Europe Fire-Rated Busway Revenue (billion), by Application 2025 & 2033
- Figure 15: Europe Fire-Rated Busway Revenue Share (%), by Application 2025 & 2033
- Figure 16: Europe Fire-Rated Busway Revenue (billion), by Types 2025 & 2033
- Figure 17: Europe Fire-Rated Busway Revenue Share (%), by Types 2025 & 2033
- Figure 18: Europe Fire-Rated Busway Revenue (billion), by Country 2025 & 2033
- Figure 19: Europe Fire-Rated Busway Revenue Share (%), by Country 2025 & 2033
- Figure 20: Middle East & Africa Fire-Rated Busway Revenue (billion), by Application 2025 & 2033
- Figure 21: Middle East & Africa Fire-Rated Busway Revenue Share (%), by Application 2025 & 2033
- Figure 22: Middle East & Africa Fire-Rated Busway Revenue (billion), by Types 2025 & 2033
- Figure 23: Middle East & Africa Fire-Rated Busway Revenue Share (%), by Types 2025 & 2033
- Figure 24: Middle East & Africa Fire-Rated Busway Revenue (billion), by Country 2025 & 2033
- Figure 25: Middle East & Africa Fire-Rated Busway Revenue Share (%), by Country 2025 & 2033
- Figure 26: Asia Pacific Fire-Rated Busway Revenue (billion), by Application 2025 & 2033
- Figure 27: Asia Pacific Fire-Rated Busway Revenue Share (%), by Application 2025 & 2033
- Figure 28: Asia Pacific Fire-Rated Busway Revenue (billion), by Types 2025 & 2033
- Figure 29: Asia Pacific Fire-Rated Busway Revenue Share (%), by Types 2025 & 2033
- Figure 30: Asia Pacific Fire-Rated Busway Revenue (billion), by Country 2025 & 2033
- Figure 31: Asia Pacific Fire-Rated Busway Revenue Share (%), by Country 2025 & 2033
List of Tables
- Table 1: Global Fire-Rated Busway Revenue billion Forecast, by Application 2020 & 2033
- Table 2: Global Fire-Rated Busway Revenue billion Forecast, by Types 2020 & 2033
- Table 3: Global Fire-Rated Busway Revenue billion Forecast, by Region 2020 & 2033
- Table 4: Global Fire-Rated Busway Revenue billion Forecast, by Application 2020 & 2033
- Table 5: Global Fire-Rated Busway Revenue billion Forecast, by Types 2020 & 2033
- Table 6: Global Fire-Rated Busway Revenue billion Forecast, by Country 2020 & 2033
- Table 7: United States Fire-Rated Busway Revenue (billion) Forecast, by Application 2020 & 2033
- Table 8: Canada Fire-Rated Busway Revenue (billion) Forecast, by Application 2020 & 2033
- Table 9: Mexico Fire-Rated Busway Revenue (billion) Forecast, by Application 2020 & 2033
- Table 10: Global Fire-Rated Busway Revenue billion Forecast, by Application 2020 & 2033
- Table 11: Global Fire-Rated Busway Revenue billion Forecast, by Types 2020 & 2033
- Table 12: Global Fire-Rated Busway Revenue billion Forecast, by Country 2020 & 2033
- Table 13: Brazil Fire-Rated Busway Revenue (billion) Forecast, by Application 2020 & 2033
- Table 14: Argentina Fire-Rated Busway Revenue (billion) Forecast, by Application 2020 & 2033
- Table 15: Rest of South America Fire-Rated Busway Revenue (billion) Forecast, by Application 2020 & 2033
- Table 16: Global Fire-Rated Busway Revenue billion Forecast, by Application 2020 & 2033
- Table 17: Global Fire-Rated Busway Revenue billion Forecast, by Types 2020 & 2033
- Table 18: Global Fire-Rated Busway Revenue billion Forecast, by Country 2020 & 2033
- Table 19: United Kingdom Fire-Rated Busway Revenue (billion) Forecast, by Application 2020 & 2033
- Table 20: Germany Fire-Rated Busway Revenue (billion) Forecast, by Application 2020 & 2033
- Table 21: France Fire-Rated Busway Revenue (billion) Forecast, by Application 2020 & 2033
- Table 22: Italy Fire-Rated Busway Revenue (billion) Forecast, by Application 2020 & 2033
- Table 23: Spain Fire-Rated Busway Revenue (billion) Forecast, by Application 2020 & 2033
- Table 24: Russia Fire-Rated Busway Revenue (billion) Forecast, by Application 2020 & 2033
- Table 25: Benelux Fire-Rated Busway Revenue (billion) Forecast, by Application 2020 & 2033
- Table 26: Nordics Fire-Rated Busway Revenue (billion) Forecast, by Application 2020 & 2033
- Table 27: Rest of Europe Fire-Rated Busway Revenue (billion) Forecast, by Application 2020 & 2033
- Table 28: Global Fire-Rated Busway Revenue billion Forecast, by Application 2020 & 2033
- Table 29: Global Fire-Rated Busway Revenue billion Forecast, by Types 2020 & 2033
- Table 30: Global Fire-Rated Busway Revenue billion Forecast, by Country 2020 & 2033
- Table 31: Turkey Fire-Rated Busway Revenue (billion) Forecast, by Application 2020 & 2033
- Table 32: Israel Fire-Rated Busway Revenue (billion) Forecast, by Application 2020 & 2033
- Table 33: GCC Fire-Rated Busway Revenue (billion) Forecast, by Application 2020 & 2033
- Table 34: North Africa Fire-Rated Busway Revenue (billion) Forecast, by Application 2020 & 2033
- Table 35: South Africa Fire-Rated Busway Revenue (billion) Forecast, by Application 2020 & 2033
- Table 36: Rest of Middle East & Africa Fire-Rated Busway Revenue (billion) Forecast, by Application 2020 & 2033
- Table 37: Global Fire-Rated Busway Revenue billion Forecast, by Application 2020 & 2033
- Table 38: Global Fire-Rated Busway Revenue billion Forecast, by Types 2020 & 2033
- Table 39: Global Fire-Rated Busway Revenue billion Forecast, by Country 2020 & 2033
- Table 40: China Fire-Rated Busway Revenue (billion) Forecast, by Application 2020 & 2033
- Table 41: India Fire-Rated Busway Revenue (billion) Forecast, by Application 2020 & 2033
- Table 42: Japan Fire-Rated Busway Revenue (billion) Forecast, by Application 2020 & 2033
- Table 43: South Korea Fire-Rated Busway Revenue (billion) Forecast, by Application 2020 & 2033
- Table 44: ASEAN Fire-Rated Busway Revenue (billion) Forecast, by Application 2020 & 2033
- Table 45: Oceania Fire-Rated Busway Revenue (billion) Forecast, by Application 2020 & 2033
- Table 46: Rest of Asia Pacific Fire-Rated Busway Revenue (billion) Forecast, by Application 2020 & 2033
Frequently Asked Questions
1. What is the projected Compound Annual Growth Rate (CAGR) of the Fire-Rated Busway?
The projected CAGR is approximately 1.58%.
2. Which companies are prominent players in the Fire-Rated Busway?
Key companies in the market include ABB, Schneider Electric, Bahra Electric, Specified Technologies, C&S Electric, Davis Malaysia, EAE Elektrik, GE.
3. What are the main segments of the Fire-Rated Busway?
The market segments include Application, Types.
4. Can you provide details about the market size?
The market size is estimated to be USD 8.98 billion as of 2022.
5. What are some drivers contributing to market growth?
N/A
6. What are the notable trends driving market growth?
N/A
7. Are there any restraints impacting market growth?
N/A
8. Can you provide examples of recent developments in the market?
N/A
9. What pricing options are available for accessing the report?
Pricing options include single-user, multi-user, and enterprise licenses priced at USD 3650.00, USD 5475.00, and USD 7300.00 respectively.
10. Is the market size provided in terms of value or volume?
The market size is provided in terms of value, measured in billion.
11. Are there any specific market keywords associated with the report?
Yes, the market keyword associated with the report is "Fire-Rated Busway," which aids in identifying and referencing the specific market segment covered.
12. How do I determine which pricing option suits my needs best?
The pricing options vary based on user requirements and access needs. Individual users may opt for single-user licenses, while businesses requiring broader access may choose multi-user or enterprise licenses for cost-effective access to the report.
13. Are there any additional resources or data provided in the Fire-Rated Busway report?
While the report offers comprehensive insights, it's advisable to review the specific contents or supplementary materials provided to ascertain if additional resources or data are available.
14. How can I stay updated on further developments or reports in the Fire-Rated Busway?
To stay informed about further developments, trends, and reports in the Fire-Rated Busway, consider subscribing to industry newsletters, following relevant companies and organizations, or regularly checking reputable industry news sources and publications.
Methodology
Step 1 - Identification of Relevant Samples Size from Population Database


Step 2 - Approaches for Defining Global Market Size (Value, Volume* & Price*)

Note*: In applicable scenarios
Step 3 - Data Sources
Primary Research
- Web Analytics
- Survey Reports
- Research Institute
- Latest Research Reports
- Opinion Leaders
Secondary Research
- Annual Reports
- White Paper
- Latest Press Release
- Industry Association
- Paid Database
- Investor Presentations

Step 4 - Data Triangulation
Involves using different sources of information in order to increase the validity of a study
These sources are likely to be stakeholders in a program - participants, other researchers, program staff, other community members, and so on.
Then we put all data in single framework & apply various statistical tools to find out the dynamic on the market.
During the analysis stage, feedback from the stakeholder groups would be compared to determine areas of agreement as well as areas of divergence