
Key Insights
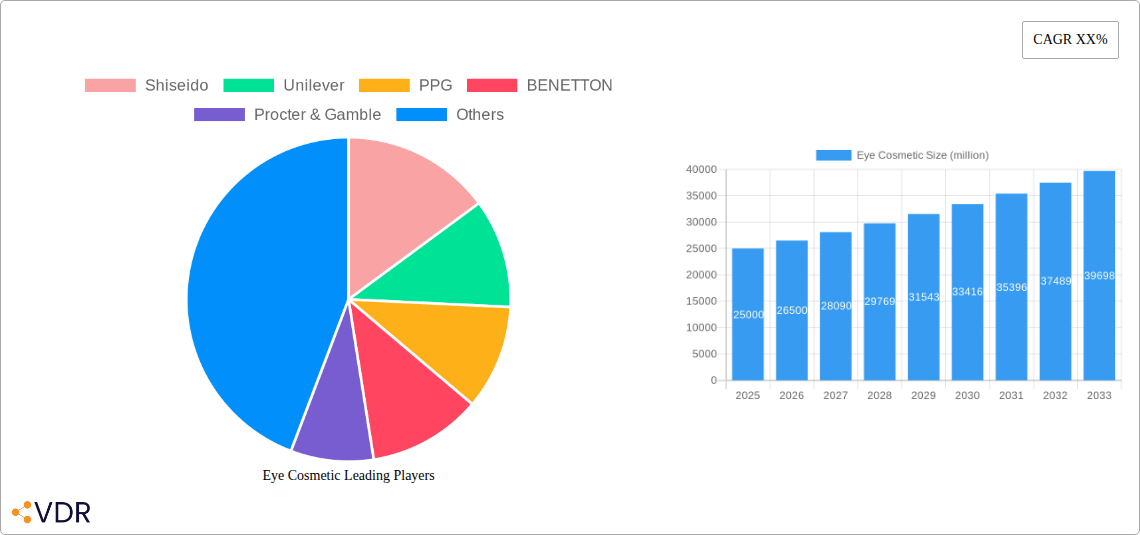
The global eye cosmetic market is experiencing robust growth, driven by several key factors. The rising popularity of makeup among both men and women, fueled by social media trends and increased disposable incomes, particularly in emerging economies, is a significant contributor. Furthermore, innovation in product formulations, such as lengthening mascaras, vibrant eyeshadow palettes, and long-lasting eyeliners, continues to attract consumers seeking enhanced aesthetic appeal and convenience. The market is segmented by product type (mascara, eyeliner, eyeshadow, eyebrow pencils, etc.), distribution channel (online, offline), and geography. Major players like L'Oreal, Shiseido, Unilever, and Procter & Gamble are constantly investing in research and development, leading to the introduction of high-quality, innovative products that cater to diverse consumer preferences and needs. This competitive landscape fosters continuous improvement and expansion of product offerings. We estimate the market size in 2025 to be approximately $25 billion, with a Compound Annual Growth Rate (CAGR) of 6% projected for the 2025-2033 forecast period.
However, the market also faces certain challenges. Fluctuations in raw material prices and economic downturns can impact consumer spending on non-essential items like cosmetics. Furthermore, growing awareness of the potential harmful effects of certain cosmetic ingredients is driving demand for natural and organic alternatives, compelling manufacturers to adapt their product formulations and marketing strategies. Regulatory changes and stricter safety standards in different regions also present challenges to market expansion. Despite these restraints, the long-term outlook for the eye cosmetic market remains positive, fueled by ongoing innovation, increasing consumer demand, and the expansion into new geographic markets. The increasing use of e-commerce platforms for purchasing cosmetics is further strengthening market growth.
Eye Cosmetic Market Report: 2019-2033
This comprehensive report provides a detailed analysis of the global eye cosmetic market, encompassing market dynamics, growth trends, regional performance, product landscape, and key players. The study period covers 2019-2033, with a base year of 2025 and a forecast period of 2025-2033. This report is essential for industry professionals, investors, and strategic decision-makers seeking a deep understanding of this dynamic market. It leverages extensive data and analysis to provide actionable insights and future projections. The parent market is Cosmetics and Personal Care, while the child market is Eye Makeup.
Eye Cosmetic Market Dynamics & Structure
The global eye cosmetic market, valued at xx million units in 2024, is characterized by a moderately concentrated structure with key players like L'Oréal, Shiseido, and Procter & Gamble holding significant market share. Technological innovation, particularly in formulations (e.g., long-lasting mascaras, smudge-proof eyeliners), packaging, and application methods, is a key growth driver. Stringent regulatory frameworks concerning ingredient safety and labeling influence product development and market access. Competitive substitutes include skincare products offering similar aesthetic effects (e.g., anti-aging serums). The market is primarily driven by the millennial and Gen Z demographics, known for their high spending on beauty and personal care. M&A activity has been moderate, with xx deals recorded between 2019-2024, primarily focused on expanding product portfolios and geographical reach.
- Market Concentration: L'Oréal and Shiseido hold a combined market share of approximately xx%.
- Innovation Drivers: Focus on natural ingredients, sustainable packaging, and personalized formulations.
- Regulatory Landscape: Stringent regulations concerning ingredient safety and labeling in various regions.
- Competitive Substitutes: Skincare products with aesthetic benefits (e.g., eye creams).
- End-User Demographics: High demand from millennials and Gen Z.
- M&A Trends: xx M&A deals between 2019 and 2024, primarily focused on expansion.
Eye Cosmetic Growth Trends & Insights
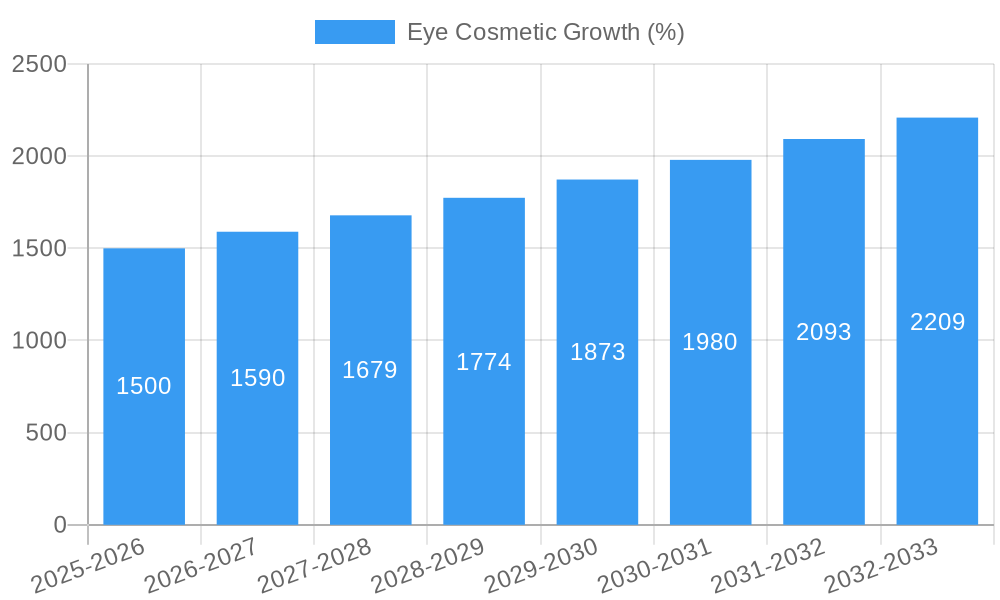
The eye cosmetic market exhibited a CAGR of xx% during the historical period (2019-2024), driven by factors such as rising disposable incomes, increasing awareness of beauty trends through social media, and the expansion of e-commerce channels. Market penetration has increased steadily, with the adoption rate of eye cosmetics particularly high in developing economies. Technological disruptions, such as the rise of AI-powered beauty tools and personalized product recommendations, are reshaping consumer experiences and driving market growth. Consumer behavior is shifting towards more natural and sustainable products, influencing product formulation and branding strategies. The market is projected to reach xx million units by 2025 and maintain a CAGR of xx% from 2025-2033.
- Market Size Evolution: xx million units in 2024, projected to reach xx million units by 2033.
- Adoption Rates: High adoption rates in developing economies, driven by increased awareness and affordability.
- Technological Disruptions: AI-powered beauty tools and personalized product recommendations.
- Consumer Behavior Shifts: Growing demand for natural, organic, and sustainable products.
Dominant Regions, Countries, or Segments in Eye Cosmetic
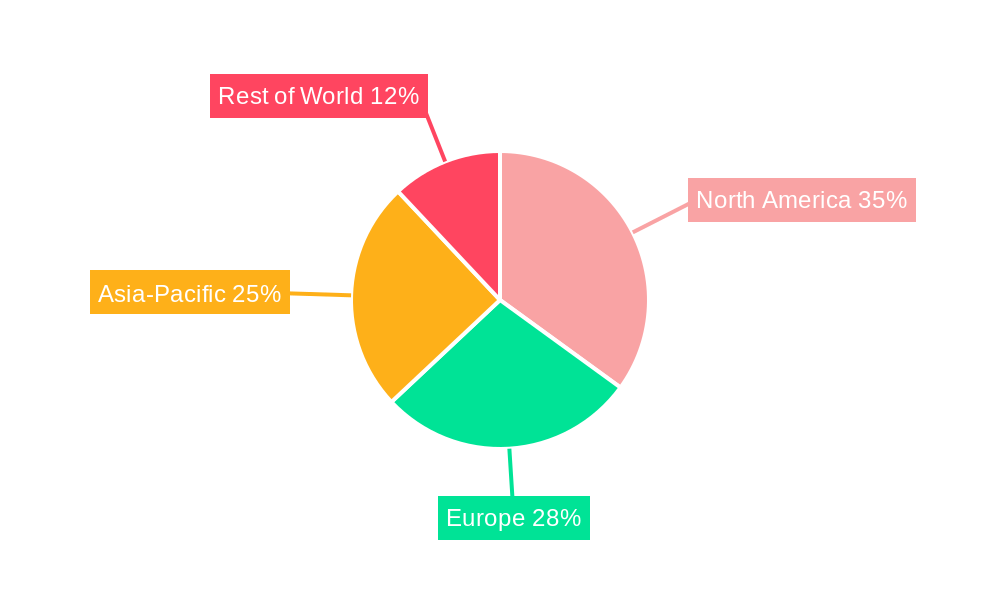
North America and Asia Pacific currently dominate the eye cosmetic market, accounting for a combined xx% market share in 2024. North America's dominance is attributed to high consumer spending on beauty products, advanced retail infrastructure, and strong brand presence of major players. The Asia Pacific region's rapid growth is fueled by increasing disposable incomes, a burgeoning middle class, and a strong preference for vibrant makeup styles. Within these regions, countries like the US, China, Japan, and South Korea are key contributors. Specific segments within the eye cosmetic market (e.g., mascara, eyeliner, eyeshadow) also contribute variably to the overall growth.
- Key Drivers (North America): High consumer spending, advanced retail infrastructure, strong brand presence.
- Key Drivers (Asia Pacific): Rising disposable incomes, burgeoning middle class, strong preference for vibrant makeup.
- Dominant Countries: US, China, Japan, South Korea.
- Segmental Growth: Mascara and eyeliner are high-growth segments.
Eye Cosmetic Product Landscape
The eye cosmetic market offers a diverse range of products, from conventional mascaras and eyeliners to innovative formulations incorporating advanced technologies like long-lasting pigments, waterproof textures, and skin-enhancing ingredients. Emphasis is on multi-functional products offering both cosmetic and skincare benefits. Unique selling propositions (USPs) include advanced application techniques, such as magnetic lashes and innovative brush designs, and naturally sourced ingredients, catering to increasing consumer demand for clean beauty. Technological advancements focus on improving product performance and enhancing consumer experience.
Key Drivers, Barriers & Challenges in Eye Cosmetic
Key Drivers: Rising disposable incomes in emerging markets, increasing awareness of beauty trends via social media, and the growth of e-commerce platforms. Technological advancements in product formulation and packaging are also driving innovation.
Key Challenges: Fluctuating raw material prices impacting production costs, stringent regulatory requirements concerning ingredient safety, and intense competition from established and emerging brands. Supply chain disruptions can also impact product availability and market stability. These factors collectively pose significant challenges for the industry.
Emerging Opportunities in Eye Cosmetic
Untapped markets in developing economies present significant growth potential. The increasing demand for personalized and customized products is creating opportunities for niche brands offering tailored solutions. Furthermore, the growing interest in sustainable and ethically sourced ingredients opens doors for brands aligning with environmentally conscious consumer preferences. Innovative applications, like augmented reality (AR) tools for virtual makeup try-ons, are enhancing the consumer experience and driving engagement.
Growth Accelerators in the Eye Cosmetic Industry
Technological breakthroughs in product formulations, such as self-adjusting mascaras or long-lasting pigments, continuously fuel growth. Strategic partnerships between cosmetic brands and technology companies enable the integration of innovative solutions like AR and AI. Market expansion strategies into untapped regions and the development of targeted products for niche consumer segments further enhance growth prospects.
Key Players Shaping the Eye Cosmetic Market
- Shiseido
- Unilever
- PPG
- BENETTON
- Procter & Gamble
- L'Oréal
Notable Milestones in Eye Cosmetic Sector
- 2020: Launch of several innovative mascaras featuring lengthening and volumizing formulas.
- 2021: Increased focus on sustainable and ethical sourcing of ingredients.
- 2022: Several key players invest in AR/VR technology for virtual makeup try-ons.
- 2023: Significant rise in online sales of eye cosmetics via e-commerce platforms.
In-Depth Eye Cosmetic Market Outlook
The eye cosmetic market is poised for continued growth, driven by technological innovation, expanding consumer bases in emerging economies, and the increasing preference for personalized and sustainable beauty solutions. Strategic opportunities lie in leveraging technological advancements, expanding into untapped markets, and focusing on sustainable and ethical sourcing practices. The market's future is bright, with substantial growth potential for both established and emerging players willing to adapt to evolving consumer demands and market trends.
Eye Cosmetic Segmentation
-
1. Application
- 1.1. Online Sales
- 1.2. Offline Sales
-
2. Types
- 2.1. Eye Shadow Powder
- 2.2. Eyeliner
- 2.3. Eye Shadow Cream
- 2.4. Other
Eye Cosmetic Segmentation By Geography
-
1. North America
- 1.1. United States
- 1.2. Canada
- 1.3. Mexico
-
2. South America
- 2.1. Brazil
- 2.2. Argentina
- 2.3. Rest of South America
-
3. Europe
- 3.1. United Kingdom
- 3.2. Germany
- 3.3. France
- 3.4. Italy
- 3.5. Spain
- 3.6. Russia
- 3.7. Benelux
- 3.8. Nordics
- 3.9. Rest of Europe
-
4. Middle East & Africa
- 4.1. Turkey
- 4.2. Israel
- 4.3. GCC
- 4.4. North Africa
- 4.5. South Africa
- 4.6. Rest of Middle East & Africa
-
5. Asia Pacific
- 5.1. China
- 5.2. India
- 5.3. Japan
- 5.4. South Korea
- 5.5. ASEAN
- 5.6. Oceania
- 5.7. Rest of Asia Pacific
Eye Cosmetic REPORT HIGHLIGHTS
| Aspects | Details |
|---|---|
| Study Period | 2019-2033 |
| Base Year | 2024 |
| Estimated Year | 2025 |
| Forecast Period | 2025-2033 |
| Historical Period | 2019-2024 |
| Growth Rate | CAGR of XX% from 2019-2033 |
| Segmentation |
|
Table of Contents
- 1. Introduction
- 1.1. Research Scope
- 1.2. Market Segmentation
- 1.3. Research Methodology
- 1.4. Definitions and Assumptions
- 2. Executive Summary
- 2.1. Introduction
- 3. Market Dynamics
- 3.1. Introduction
- 3.2. Market Drivers
- 3.3. Market Restrains
- 3.4. Market Trends
- 4. Market Factor Analysis
- 4.1. Porters Five Forces
- 4.2. Supply/Value Chain
- 4.3. PESTEL analysis
- 4.4. Market Entropy
- 4.5. Patent/Trademark Analysis
- 5. Global Eye Cosmetic Analysis, Insights and Forecast, 2019-2031
- 5.1. Market Analysis, Insights and Forecast - by Application
- 5.1.1. Online Sales
- 5.1.2. Offline Sales
- 5.2. Market Analysis, Insights and Forecast - by Types
- 5.2.1. Eye Shadow Powder
- 5.2.2. Eyeliner
- 5.2.3. Eye Shadow Cream
- 5.2.4. Other
- 5.3. Market Analysis, Insights and Forecast - by Region
- 5.3.1. North America
- 5.3.2. South America
- 5.3.3. Europe
- 5.3.4. Middle East & Africa
- 5.3.5. Asia Pacific
- 5.1. Market Analysis, Insights and Forecast - by Application
- 6. North America Eye Cosmetic Analysis, Insights and Forecast, 2019-2031
- 6.1. Market Analysis, Insights and Forecast - by Application
- 6.1.1. Online Sales
- 6.1.2. Offline Sales
- 6.2. Market Analysis, Insights and Forecast - by Types
- 6.2.1. Eye Shadow Powder
- 6.2.2. Eyeliner
- 6.2.3. Eye Shadow Cream
- 6.2.4. Other
- 6.1. Market Analysis, Insights and Forecast - by Application
- 7. South America Eye Cosmetic Analysis, Insights and Forecast, 2019-2031
- 7.1. Market Analysis, Insights and Forecast - by Application
- 7.1.1. Online Sales
- 7.1.2. Offline Sales
- 7.2. Market Analysis, Insights and Forecast - by Types
- 7.2.1. Eye Shadow Powder
- 7.2.2. Eyeliner
- 7.2.3. Eye Shadow Cream
- 7.2.4. Other
- 7.1. Market Analysis, Insights and Forecast - by Application
- 8. Europe Eye Cosmetic Analysis, Insights and Forecast, 2019-2031
- 8.1. Market Analysis, Insights and Forecast - by Application
- 8.1.1. Online Sales
- 8.1.2. Offline Sales
- 8.2. Market Analysis, Insights and Forecast - by Types
- 8.2.1. Eye Shadow Powder
- 8.2.2. Eyeliner
- 8.2.3. Eye Shadow Cream
- 8.2.4. Other
- 8.1. Market Analysis, Insights and Forecast - by Application
- 9. Middle East & Africa Eye Cosmetic Analysis, Insights and Forecast, 2019-2031
- 9.1. Market Analysis, Insights and Forecast - by Application
- 9.1.1. Online Sales
- 9.1.2. Offline Sales
- 9.2. Market Analysis, Insights and Forecast - by Types
- 9.2.1. Eye Shadow Powder
- 9.2.2. Eyeliner
- 9.2.3. Eye Shadow Cream
- 9.2.4. Other
- 9.1. Market Analysis, Insights and Forecast - by Application
- 10. Asia Pacific Eye Cosmetic Analysis, Insights and Forecast, 2019-2031
- 10.1. Market Analysis, Insights and Forecast - by Application
- 10.1.1. Online Sales
- 10.1.2. Offline Sales
- 10.2. Market Analysis, Insights and Forecast - by Types
- 10.2.1. Eye Shadow Powder
- 10.2.2. Eyeliner
- 10.2.3. Eye Shadow Cream
- 10.2.4. Other
- 10.1. Market Analysis, Insights and Forecast - by Application
- 11. Competitive Analysis
- 11.1. Global Market Share Analysis 2024
- 11.2. Company Profiles
- 11.2.1 Shiseido
- 11.2.1.1. Overview
- 11.2.1.2. Products
- 11.2.1.3. SWOT Analysis
- 11.2.1.4. Recent Developments
- 11.2.1.5. Financials (Based on Availability)
- 11.2.2 Unilever
- 11.2.2.1. Overview
- 11.2.2.2. Products
- 11.2.2.3. SWOT Analysis
- 11.2.2.4. Recent Developments
- 11.2.2.5. Financials (Based on Availability)
- 11.2.3 PPG
- 11.2.3.1. Overview
- 11.2.3.2. Products
- 11.2.3.3. SWOT Analysis
- 11.2.3.4. Recent Developments
- 11.2.3.5. Financials (Based on Availability)
- 11.2.4 BENETTON
- 11.2.4.1. Overview
- 11.2.4.2. Products
- 11.2.4.3. SWOT Analysis
- 11.2.4.4. Recent Developments
- 11.2.4.5. Financials (Based on Availability)
- 11.2.5 Procter & Gamble
- 11.2.5.1. Overview
- 11.2.5.2. Products
- 11.2.5.3. SWOT Analysis
- 11.2.5.4. Recent Developments
- 11.2.5.5. Financials (Based on Availability)
- 11.2.6 L'Oreal
- 11.2.6.1. Overview
- 11.2.6.2. Products
- 11.2.6.3. SWOT Analysis
- 11.2.6.4. Recent Developments
- 11.2.6.5. Financials (Based on Availability)
- 11.2.1 Shiseido
List of Figures
- Figure 1: Global Eye Cosmetic Revenue Breakdown (million, %) by Region 2024 & 2032
- Figure 2: Global Eye Cosmetic Volume Breakdown (K, %) by Region 2024 & 2032
- Figure 3: North America Eye Cosmetic Revenue (million), by Application 2024 & 2032
- Figure 4: North America Eye Cosmetic Volume (K), by Application 2024 & 2032
- Figure 5: North America Eye Cosmetic Revenue Share (%), by Application 2024 & 2032
- Figure 6: North America Eye Cosmetic Volume Share (%), by Application 2024 & 2032
- Figure 7: North America Eye Cosmetic Revenue (million), by Types 2024 & 2032
- Figure 8: North America Eye Cosmetic Volume (K), by Types 2024 & 2032
- Figure 9: North America Eye Cosmetic Revenue Share (%), by Types 2024 & 2032
- Figure 10: North America Eye Cosmetic Volume Share (%), by Types 2024 & 2032
- Figure 11: North America Eye Cosmetic Revenue (million), by Country 2024 & 2032
- Figure 12: North America Eye Cosmetic Volume (K), by Country 2024 & 2032
- Figure 13: North America Eye Cosmetic Revenue Share (%), by Country 2024 & 2032
- Figure 14: North America Eye Cosmetic Volume Share (%), by Country 2024 & 2032
- Figure 15: South America Eye Cosmetic Revenue (million), by Application 2024 & 2032
- Figure 16: South America Eye Cosmetic Volume (K), by Application 2024 & 2032
- Figure 17: South America Eye Cosmetic Revenue Share (%), by Application 2024 & 2032
- Figure 18: South America Eye Cosmetic Volume Share (%), by Application 2024 & 2032
- Figure 19: South America Eye Cosmetic Revenue (million), by Types 2024 & 2032
- Figure 20: South America Eye Cosmetic Volume (K), by Types 2024 & 2032
- Figure 21: South America Eye Cosmetic Revenue Share (%), by Types 2024 & 2032
- Figure 22: South America Eye Cosmetic Volume Share (%), by Types 2024 & 2032
- Figure 23: South America Eye Cosmetic Revenue (million), by Country 2024 & 2032
- Figure 24: South America Eye Cosmetic Volume (K), by Country 2024 & 2032
- Figure 25: South America Eye Cosmetic Revenue Share (%), by Country 2024 & 2032
- Figure 26: South America Eye Cosmetic Volume Share (%), by Country 2024 & 2032
- Figure 27: Europe Eye Cosmetic Revenue (million), by Application 2024 & 2032
- Figure 28: Europe Eye Cosmetic Volume (K), by Application 2024 & 2032
- Figure 29: Europe Eye Cosmetic Revenue Share (%), by Application 2024 & 2032
- Figure 30: Europe Eye Cosmetic Volume Share (%), by Application 2024 & 2032
- Figure 31: Europe Eye Cosmetic Revenue (million), by Types 2024 & 2032
- Figure 32: Europe Eye Cosmetic Volume (K), by Types 2024 & 2032
- Figure 33: Europe Eye Cosmetic Revenue Share (%), by Types 2024 & 2032
- Figure 34: Europe Eye Cosmetic Volume Share (%), by Types 2024 & 2032
- Figure 35: Europe Eye Cosmetic Revenue (million), by Country 2024 & 2032
- Figure 36: Europe Eye Cosmetic Volume (K), by Country 2024 & 2032
- Figure 37: Europe Eye Cosmetic Revenue Share (%), by Country 2024 & 2032
- Figure 38: Europe Eye Cosmetic Volume Share (%), by Country 2024 & 2032
- Figure 39: Middle East & Africa Eye Cosmetic Revenue (million), by Application 2024 & 2032
- Figure 40: Middle East & Africa Eye Cosmetic Volume (K), by Application 2024 & 2032
- Figure 41: Middle East & Africa Eye Cosmetic Revenue Share (%), by Application 2024 & 2032
- Figure 42: Middle East & Africa Eye Cosmetic Volume Share (%), by Application 2024 & 2032
- Figure 43: Middle East & Africa Eye Cosmetic Revenue (million), by Types 2024 & 2032
- Figure 44: Middle East & Africa Eye Cosmetic Volume (K), by Types 2024 & 2032
- Figure 45: Middle East & Africa Eye Cosmetic Revenue Share (%), by Types 2024 & 2032
- Figure 46: Middle East & Africa Eye Cosmetic Volume Share (%), by Types 2024 & 2032
- Figure 47: Middle East & Africa Eye Cosmetic Revenue (million), by Country 2024 & 2032
- Figure 48: Middle East & Africa Eye Cosmetic Volume (K), by Country 2024 & 2032
- Figure 49: Middle East & Africa Eye Cosmetic Revenue Share (%), by Country 2024 & 2032
- Figure 50: Middle East & Africa Eye Cosmetic Volume Share (%), by Country 2024 & 2032
- Figure 51: Asia Pacific Eye Cosmetic Revenue (million), by Application 2024 & 2032
- Figure 52: Asia Pacific Eye Cosmetic Volume (K), by Application 2024 & 2032
- Figure 53: Asia Pacific Eye Cosmetic Revenue Share (%), by Application 2024 & 2032
- Figure 54: Asia Pacific Eye Cosmetic Volume Share (%), by Application 2024 & 2032
- Figure 55: Asia Pacific Eye Cosmetic Revenue (million), by Types 2024 & 2032
- Figure 56: Asia Pacific Eye Cosmetic Volume (K), by Types 2024 & 2032
- Figure 57: Asia Pacific Eye Cosmetic Revenue Share (%), by Types 2024 & 2032
- Figure 58: Asia Pacific Eye Cosmetic Volume Share (%), by Types 2024 & 2032
- Figure 59: Asia Pacific Eye Cosmetic Revenue (million), by Country 2024 & 2032
- Figure 60: Asia Pacific Eye Cosmetic Volume (K), by Country 2024 & 2032
- Figure 61: Asia Pacific Eye Cosmetic Revenue Share (%), by Country 2024 & 2032
- Figure 62: Asia Pacific Eye Cosmetic Volume Share (%), by Country 2024 & 2032
List of Tables
- Table 1: Global Eye Cosmetic Revenue million Forecast, by Region 2019 & 2032
- Table 2: Global Eye Cosmetic Volume K Forecast, by Region 2019 & 2032
- Table 3: Global Eye Cosmetic Revenue million Forecast, by Application 2019 & 2032
- Table 4: Global Eye Cosmetic Volume K Forecast, by Application 2019 & 2032
- Table 5: Global Eye Cosmetic Revenue million Forecast, by Types 2019 & 2032
- Table 6: Global Eye Cosmetic Volume K Forecast, by Types 2019 & 2032
- Table 7: Global Eye Cosmetic Revenue million Forecast, by Region 2019 & 2032
- Table 8: Global Eye Cosmetic Volume K Forecast, by Region 2019 & 2032
- Table 9: Global Eye Cosmetic Revenue million Forecast, by Application 2019 & 2032
- Table 10: Global Eye Cosmetic Volume K Forecast, by Application 2019 & 2032
- Table 11: Global Eye Cosmetic Revenue million Forecast, by Types 2019 & 2032
- Table 12: Global Eye Cosmetic Volume K Forecast, by Types 2019 & 2032
- Table 13: Global Eye Cosmetic Revenue million Forecast, by Country 2019 & 2032
- Table 14: Global Eye Cosmetic Volume K Forecast, by Country 2019 & 2032
- Table 15: United States Eye Cosmetic Revenue (million) Forecast, by Application 2019 & 2032
- Table 16: United States Eye Cosmetic Volume (K) Forecast, by Application 2019 & 2032
- Table 17: Canada Eye Cosmetic Revenue (million) Forecast, by Application 2019 & 2032
- Table 18: Canada Eye Cosmetic Volume (K) Forecast, by Application 2019 & 2032
- Table 19: Mexico Eye Cosmetic Revenue (million) Forecast, by Application 2019 & 2032
- Table 20: Mexico Eye Cosmetic Volume (K) Forecast, by Application 2019 & 2032
- Table 21: Global Eye Cosmetic Revenue million Forecast, by Application 2019 & 2032
- Table 22: Global Eye Cosmetic Volume K Forecast, by Application 2019 & 2032
- Table 23: Global Eye Cosmetic Revenue million Forecast, by Types 2019 & 2032
- Table 24: Global Eye Cosmetic Volume K Forecast, by Types 2019 & 2032
- Table 25: Global Eye Cosmetic Revenue million Forecast, by Country 2019 & 2032
- Table 26: Global Eye Cosmetic Volume K Forecast, by Country 2019 & 2032
- Table 27: Brazil Eye Cosmetic Revenue (million) Forecast, by Application 2019 & 2032
- Table 28: Brazil Eye Cosmetic Volume (K) Forecast, by Application 2019 & 2032
- Table 29: Argentina Eye Cosmetic Revenue (million) Forecast, by Application 2019 & 2032
- Table 30: Argentina Eye Cosmetic Volume (K) Forecast, by Application 2019 & 2032
- Table 31: Rest of South America Eye Cosmetic Revenue (million) Forecast, by Application 2019 & 2032
- Table 32: Rest of South America Eye Cosmetic Volume (K) Forecast, by Application 2019 & 2032
- Table 33: Global Eye Cosmetic Revenue million Forecast, by Application 2019 & 2032
- Table 34: Global Eye Cosmetic Volume K Forecast, by Application 2019 & 2032
- Table 35: Global Eye Cosmetic Revenue million Forecast, by Types 2019 & 2032
- Table 36: Global Eye Cosmetic Volume K Forecast, by Types 2019 & 2032
- Table 37: Global Eye Cosmetic Revenue million Forecast, by Country 2019 & 2032
- Table 38: Global Eye Cosmetic Volume K Forecast, by Country 2019 & 2032
- Table 39: United Kingdom Eye Cosmetic Revenue (million) Forecast, by Application 2019 & 2032
- Table 40: United Kingdom Eye Cosmetic Volume (K) Forecast, by Application 2019 & 2032
- Table 41: Germany Eye Cosmetic Revenue (million) Forecast, by Application 2019 & 2032
- Table 42: Germany Eye Cosmetic Volume (K) Forecast, by Application 2019 & 2032
- Table 43: France Eye Cosmetic Revenue (million) Forecast, by Application 2019 & 2032
- Table 44: France Eye Cosmetic Volume (K) Forecast, by Application 2019 & 2032
- Table 45: Italy Eye Cosmetic Revenue (million) Forecast, by Application 2019 & 2032
- Table 46: Italy Eye Cosmetic Volume (K) Forecast, by Application 2019 & 2032
- Table 47: Spain Eye Cosmetic Revenue (million) Forecast, by Application 2019 & 2032
- Table 48: Spain Eye Cosmetic Volume (K) Forecast, by Application 2019 & 2032
- Table 49: Russia Eye Cosmetic Revenue (million) Forecast, by Application 2019 & 2032
- Table 50: Russia Eye Cosmetic Volume (K) Forecast, by Application 2019 & 2032
- Table 51: Benelux Eye Cosmetic Revenue (million) Forecast, by Application 2019 & 2032
- Table 52: Benelux Eye Cosmetic Volume (K) Forecast, by Application 2019 & 2032
- Table 53: Nordics Eye Cosmetic Revenue (million) Forecast, by Application 2019 & 2032
- Table 54: Nordics Eye Cosmetic Volume (K) Forecast, by Application 2019 & 2032
- Table 55: Rest of Europe Eye Cosmetic Revenue (million) Forecast, by Application 2019 & 2032
- Table 56: Rest of Europe Eye Cosmetic Volume (K) Forecast, by Application 2019 & 2032
- Table 57: Global Eye Cosmetic Revenue million Forecast, by Application 2019 & 2032
- Table 58: Global Eye Cosmetic Volume K Forecast, by Application 2019 & 2032
- Table 59: Global Eye Cosmetic Revenue million Forecast, by Types 2019 & 2032
- Table 60: Global Eye Cosmetic Volume K Forecast, by Types 2019 & 2032
- Table 61: Global Eye Cosmetic Revenue million Forecast, by Country 2019 & 2032
- Table 62: Global Eye Cosmetic Volume K Forecast, by Country 2019 & 2032
- Table 63: Turkey Eye Cosmetic Revenue (million) Forecast, by Application 2019 & 2032
- Table 64: Turkey Eye Cosmetic Volume (K) Forecast, by Application 2019 & 2032
- Table 65: Israel Eye Cosmetic Revenue (million) Forecast, by Application 2019 & 2032
- Table 66: Israel Eye Cosmetic Volume (K) Forecast, by Application 2019 & 2032
- Table 67: GCC Eye Cosmetic Revenue (million) Forecast, by Application 2019 & 2032
- Table 68: GCC Eye Cosmetic Volume (K) Forecast, by Application 2019 & 2032
- Table 69: North Africa Eye Cosmetic Revenue (million) Forecast, by Application 2019 & 2032
- Table 70: North Africa Eye Cosmetic Volume (K) Forecast, by Application 2019 & 2032
- Table 71: South Africa Eye Cosmetic Revenue (million) Forecast, by Application 2019 & 2032
- Table 72: South Africa Eye Cosmetic Volume (K) Forecast, by Application 2019 & 2032
- Table 73: Rest of Middle East & Africa Eye Cosmetic Revenue (million) Forecast, by Application 2019 & 2032
- Table 74: Rest of Middle East & Africa Eye Cosmetic Volume (K) Forecast, by Application 2019 & 2032
- Table 75: Global Eye Cosmetic Revenue million Forecast, by Application 2019 & 2032
- Table 76: Global Eye Cosmetic Volume K Forecast, by Application 2019 & 2032
- Table 77: Global Eye Cosmetic Revenue million Forecast, by Types 2019 & 2032
- Table 78: Global Eye Cosmetic Volume K Forecast, by Types 2019 & 2032
- Table 79: Global Eye Cosmetic Revenue million Forecast, by Country 2019 & 2032
- Table 80: Global Eye Cosmetic Volume K Forecast, by Country 2019 & 2032
- Table 81: China Eye Cosmetic Revenue (million) Forecast, by Application 2019 & 2032
- Table 82: China Eye Cosmetic Volume (K) Forecast, by Application 2019 & 2032
- Table 83: India Eye Cosmetic Revenue (million) Forecast, by Application 2019 & 2032
- Table 84: India Eye Cosmetic Volume (K) Forecast, by Application 2019 & 2032
- Table 85: Japan Eye Cosmetic Revenue (million) Forecast, by Application 2019 & 2032
- Table 86: Japan Eye Cosmetic Volume (K) Forecast, by Application 2019 & 2032
- Table 87: South Korea Eye Cosmetic Revenue (million) Forecast, by Application 2019 & 2032
- Table 88: South Korea Eye Cosmetic Volume (K) Forecast, by Application 2019 & 2032
- Table 89: ASEAN Eye Cosmetic Revenue (million) Forecast, by Application 2019 & 2032
- Table 90: ASEAN Eye Cosmetic Volume (K) Forecast, by Application 2019 & 2032
- Table 91: Oceania Eye Cosmetic Revenue (million) Forecast, by Application 2019 & 2032
- Table 92: Oceania Eye Cosmetic Volume (K) Forecast, by Application 2019 & 2032
- Table 93: Rest of Asia Pacific Eye Cosmetic Revenue (million) Forecast, by Application 2019 & 2032
- Table 94: Rest of Asia Pacific Eye Cosmetic Volume (K) Forecast, by Application 2019 & 2032
Frequently Asked Questions
1. What is the projected Compound Annual Growth Rate (CAGR) of the Eye Cosmetic?
The projected CAGR is approximately XX%.
2. Which companies are prominent players in the Eye Cosmetic?
Key companies in the market include Shiseido, Unilever, PPG, BENETTON, Procter & Gamble, L'Oreal.
3. What are the main segments of the Eye Cosmetic?
The market segments include Application, Types.
4. Can you provide details about the market size?
The market size is estimated to be USD XXX million as of 2022.
5. What are some drivers contributing to market growth?
N/A
6. What are the notable trends driving market growth?
N/A
7. Are there any restraints impacting market growth?
N/A
8. Can you provide examples of recent developments in the market?
N/A
9. What pricing options are available for accessing the report?
Pricing options include single-user, multi-user, and enterprise licenses priced at USD 3350.00, USD 5025.00, and USD 6700.00 respectively.
10. Is the market size provided in terms of value or volume?
The market size is provided in terms of value, measured in million and volume, measured in K.
11. Are there any specific market keywords associated with the report?
Yes, the market keyword associated with the report is "Eye Cosmetic," which aids in identifying and referencing the specific market segment covered.
12. How do I determine which pricing option suits my needs best?
The pricing options vary based on user requirements and access needs. Individual users may opt for single-user licenses, while businesses requiring broader access may choose multi-user or enterprise licenses for cost-effective access to the report.
13. Are there any additional resources or data provided in the Eye Cosmetic report?
While the report offers comprehensive insights, it's advisable to review the specific contents or supplementary materials provided to ascertain if additional resources or data are available.
14. How can I stay updated on further developments or reports in the Eye Cosmetic?
To stay informed about further developments, trends, and reports in the Eye Cosmetic, consider subscribing to industry newsletters, following relevant companies and organizations, or regularly checking reputable industry news sources and publications.
Methodology
Step 1 - Identification of Relevant Samples Size from Population Database


Step 2 - Approaches for Defining Global Market Size (Value, Volume* & Price*)

Note*: In applicable scenarios
Step 3 - Data Sources
Primary Research
- Web Analytics
- Survey Reports
- Research Institute
- Latest Research Reports
- Opinion Leaders
Secondary Research
- Annual Reports
- White Paper
- Latest Press Release
- Industry Association
- Paid Database
- Investor Presentations

Step 4 - Data Triangulation
Involves using different sources of information in order to increase the validity of a study
These sources are likely to be stakeholders in a program - participants, other researchers, program staff, other community members, and so on.
Then we put all data in single framework & apply various statistical tools to find out the dynamic on the market.
During the analysis stage, feedback from the stakeholder groups would be compared to determine areas of agreement as well as areas of divergence


