
Key Insights
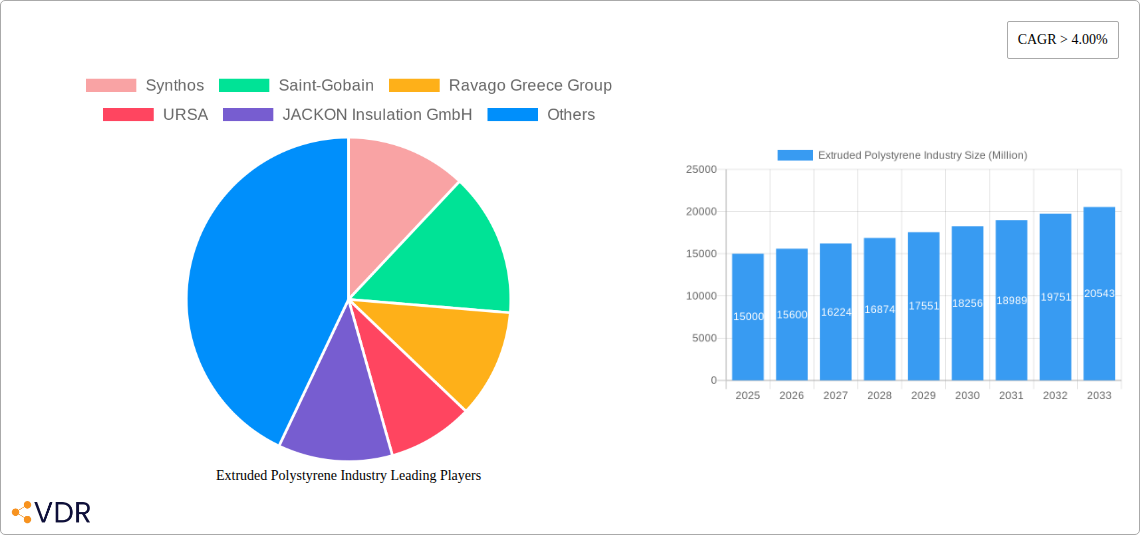
The extruded polystyrene (XPS) insulation market is experiencing robust growth, driven by the increasing demand for energy-efficient buildings and infrastructure across the globe. A Compound Annual Growth Rate (CAGR) exceeding 4.00% from 2019-2033 indicates a significant expansion of this market, projected to reach substantial value by 2033. Key drivers include stringent building codes promoting energy conservation, rising awareness of environmental sustainability, and the increasing adoption of green building practices. The residential sector dominates the application segment, fueled by rising disposable incomes and homeowner preference for improved thermal comfort and energy savings. However, the commercial and infrastructure sectors are also experiencing significant growth, driven by large-scale construction projects and the need for durable, high-performance insulation in various applications like roofing, wall cladding, and ground insulation. Competition among major players like Synthos, Saint-Gobain, and Owens Corning is intensifying, leading to product innovation and strategic partnerships to capture market share. Geographical expansion, particularly in rapidly developing economies within Asia Pacific, is a significant growth opportunity. While challenges remain, such as fluctuating raw material prices and potential environmental concerns related to production, the overall market outlook for XPS insulation remains positive, with promising growth projections throughout the forecast period.
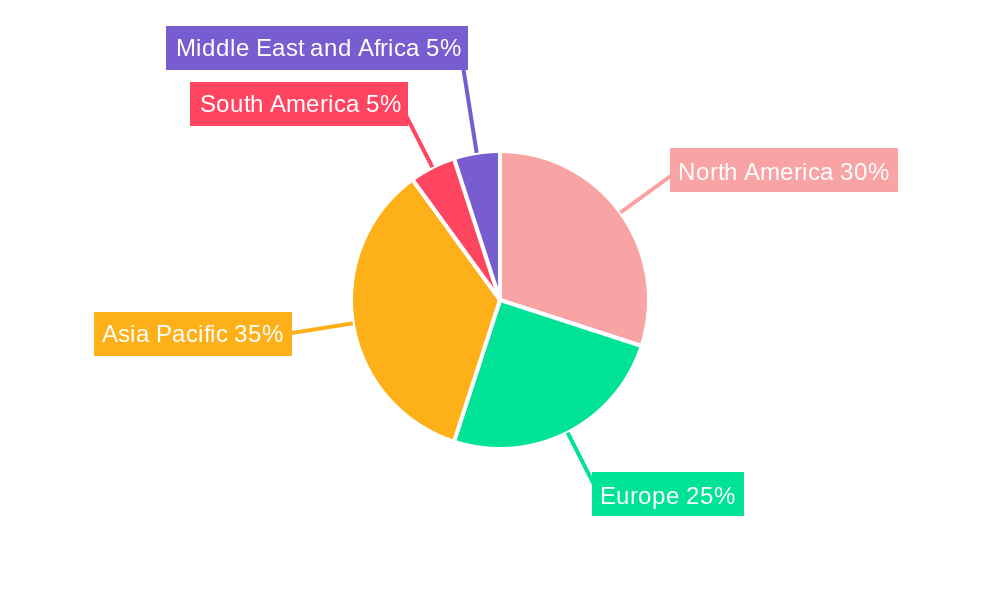
The regional distribution of the market showcases a diverse landscape. North America and Europe, established markets with mature building codes and high awareness of energy efficiency, currently hold significant market share. However, the Asia-Pacific region, particularly China and India, is witnessing rapid growth due to significant infrastructural development and expanding construction activities. Government initiatives promoting energy efficiency and sustainable building practices in these regions are further stimulating market expansion. The South American and Middle Eastern and African markets also present substantial untapped potential for future growth. The competitive landscape is characterized by both established multinational corporations and regional players, creating a dynamic environment with opportunities for both organic growth and strategic acquisitions. Continuous technological advancements in XPS insulation, such as improved thermal performance and enhanced durability, will further shape market dynamics in the coming years.
This comprehensive report provides a detailed analysis of the global extruded polystyrene (XPS) industry, encompassing market dynamics, growth trends, regional performance, and key player strategies. The report covers the historical period (2019-2024), base year (2025), and forecast period (2025-2033), offering valuable insights for industry professionals, investors, and strategic decision-makers. The total market size is predicted to reach xx Million units by 2033.
Extruded Polystyrene Industry Market Dynamics & Structure
The extruded polystyrene (XPS) market is characterized by moderate concentration, with several major players holding significant market share. Technological innovation, driven by the need for enhanced thermal performance and sustainable solutions, is a key driver. Stringent environmental regulations are increasingly influencing product development and manufacturing processes. Competition from alternative insulation materials, such as polyurethane and mineral wool, presents a challenge. The end-user demographics are diverse, spanning residential, commercial, and infrastructure sectors. Mergers and acquisitions (M&A) activity has been relatively steady, with larger players consolidating their market positions.
- Market Concentration: Moderately concentrated, with top 5 players holding approximately xx% market share in 2024.
- Technological Innovation: Focus on improving thermal conductivity, reducing environmental impact (e.g., recycled content), and enhancing durability.
- Regulatory Framework: Increasing emphasis on energy efficiency standards and sustainable building practices.
- Competitive Substitutes: Polyurethane, mineral wool, and other insulation materials pose competitive pressure.
- End-User Demographics: Residential construction (xx%), commercial buildings (xx%), infrastructure projects (xx%).
- M&A Activity: xx deals recorded between 2019 and 2024, with an average deal value of xx Million units.
Extruded Polystyrene Industry Growth Trends & Insights
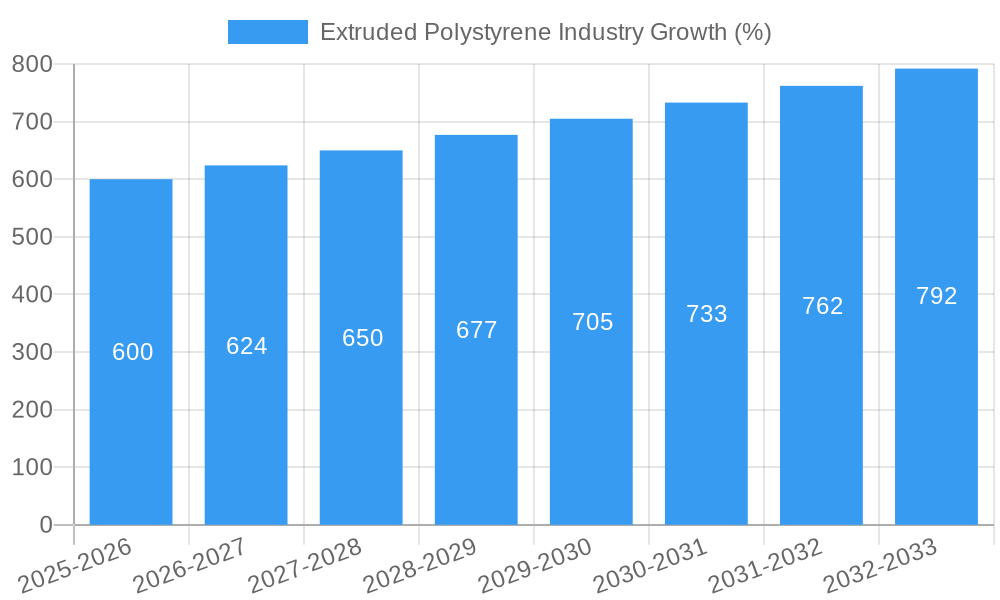
The global XPS market experienced substantial growth during the historical period (2019-2024), driven primarily by increasing construction activity and stringent energy efficiency regulations. The market is projected to maintain a robust Compound Annual Growth Rate (CAGR) of xx% during the forecast period (2025-2033). This growth is attributable to several factors, including rising urbanization, expanding infrastructure projects, and growing awareness of energy conservation. Technological advancements in XPS production, leading to improved insulation properties and reduced costs, are further fueling market expansion. Shifting consumer preferences towards energy-efficient buildings are also contributing to market growth. Market penetration in developing economies is expected to increase significantly.
Dominant Regions, Countries, or Segments in Extruded Polystyrene Industry
North America and Europe currently dominate the XPS market, driven by strong construction activity and well-established building codes that mandate energy efficiency. However, Asia-Pacific is emerging as a rapidly growing region, fueled by rapid urbanization and infrastructure development. The residential segment accounts for the largest share of XPS consumption globally, followed by commercial and infrastructure applications.
- Key Drivers:
- North America/Europe: Stringent building codes, high disposable income, and energy efficiency concerns.
- Asia-Pacific: Rapid urbanization, infrastructure investment, and increasing construction activity.
- Residential Segment: High demand for energy-efficient housing.
- Dominance Factors: High construction activity, supportive government policies, and strong demand for energy-efficient buildings.
Extruded Polystyrene Industry Product Landscape
XPS products are available in various forms, including boards, sheets, and custom-molded shapes. Recent innovations have focused on improving thermal performance, fire resistance, and moisture resistance. The focus is on lightweight, high-performance materials with enhanced durability. Key selling propositions include high R-value, ease of installation, and dimensional stability.
Key Drivers, Barriers & Challenges in Extruded Polystyrene Industry
Key Drivers: Growing demand for energy-efficient buildings, rising urbanization, and expansion of infrastructure projects. Government regulations promoting energy efficiency also significantly contribute.
Key Challenges: Fluctuations in raw material prices (styrene monomer), competition from alternative insulation materials, and environmental concerns regarding the use of fossil fuels in production. Supply chain disruptions can also impact market stability. The estimated impact of these challenges is a reduction in annual growth by approximately xx% in certain periods.
Emerging Opportunities in Extruded Polystyrene Industry
Emerging opportunities include the growing demand for XPS in specialized applications (e.g., cold storage facilities, underground pipelines), increasing adoption of sustainable manufacturing practices, and development of novel XPS composites with enhanced properties. Untapped markets in developing economies present significant growth potential.
Growth Accelerators in the Extruded Polystyrene Industry Industry
Technological advancements, strategic partnerships for improved distribution networks, and expansion into new geographic markets are driving long-term growth. Investments in research and development focusing on sustainable and high-performance XPS products will accelerate market expansion.
Key Players Shaping the Extruded Polystyrene Industry Market
- Synthos
- Saint-Gobain
- Ravago Greece Group
- URSA
- JACKON Insulation GmbH
- Soprema Group
- Owens Corning
- Kingspan Group
- BASF SE
- DuPont
- TECHNONICOL
- Knauf Insulation
- EMIRATES EXTRUDED POLYSTYRENE L L C
- Austrotherm
Notable Milestones in Extruded Polystyrene Industry Sector
- February 2022: DuPont's sale of its Mobility & Materials division impacted its involvement in the XPS industry's raw material supply chain.
- January 2023: BASF's expansion in Indonesia increased styrene-butadiene dispersion production, potentially influencing XPS manufacturing costs and availability.
In-Depth Extruded Polystyrene Industry Market Outlook
The extruded polystyrene (XPS) industry is poised for continued growth, driven by ongoing trends in sustainable construction, energy efficiency mandates, and global infrastructure development. Strategic partnerships, focusing on innovation and expansion into new markets, will shape the competitive landscape and unlock significant growth potential in the years to come. The market is expected to show a positive trajectory.
Extruded Polystyrene Industry Segmentation
-
1. Application
- 1.1. Residential
- 1.2. Commercial
- 1.3. Infrastructure
-
2. Type
- 2.1. Type I
- 2.2. Type II
- 2.3. Type III
- 2.4. Type IV
- 2.5. Type V
-
3. Density
- 3.1. Low
- 3.2. Medium
- 3.3. High
Extruded Polystyrene Industry Segmentation By Geography
-
1. Asia Pacific
- 1.1. China
- 1.2. India
- 1.3. Japan
- 1.4. South Korea
- 1.5. Rest of Asia Pacific
-
2. North America
- 2.1. United States
- 2.2. Canada
- 2.3. Mexico
-
3. Europe
- 3.1. Germany
- 3.2. United Kingdom
- 3.3. Italy
- 3.4. France
- 3.5. Rest of Europe
-
4. South America
- 4.1. Brazil
- 4.2. Argentina
- 4.3. Rest of South America
-
5. Middle East and Africa
- 5.1. Saudi Arabia
- 5.2. South Africa
- 5.3. Rest of Middle East and Africa
Extruded Polystyrene Industry REPORT HIGHLIGHTS
| Aspects | Details |
|---|---|
| Study Period | 2019-2033 |
| Base Year | 2024 |
| Estimated Year | 2025 |
| Forecast Period | 2025-2033 |
| Historical Period | 2019-2024 |
| Growth Rate | CAGR of > 4.00% from 2019-2033 |
| Segmentation |
|
Table of Contents
- 1. Introduction
- 1.1. Research Scope
- 1.2. Market Segmentation
- 1.3. Research Methodology
- 1.4. Definitions and Assumptions
- 2. Executive Summary
- 2.1. Introduction
- 3. Market Dynamics
- 3.1. Introduction
- 3.2. Market Drivers
- 3.2.1. Growth in Construction and Building Activities; Increase in Demand for Insulation Materials
- 3.3. Market Restrains
- 3.3.1. High Cost of Extruded Polystyrene; Other Restraints
- 3.4. Market Trends
- 3.4.1. Increasing Demand from the Residential Segment
- 4. Market Factor Analysis
- 4.1. Porters Five Forces
- 4.2. Supply/Value Chain
- 4.3. PESTEL analysis
- 4.4. Market Entropy
- 4.5. Patent/Trademark Analysis
- 5. Global Extruded Polystyrene Industry Analysis, Insights and Forecast, 2019-2031
- 5.1. Market Analysis, Insights and Forecast - by Application
- 5.1.1. Residential
- 5.1.2. Commercial
- 5.1.3. Infrastructure
- 5.2. Market Analysis, Insights and Forecast - by Type
- 5.2.1. Type I
- 5.2.2. Type II
- 5.2.3. Type III
- 5.2.4. Type IV
- 5.2.5. Type V
- 5.3. Market Analysis, Insights and Forecast - by Density
- 5.3.1. Low
- 5.3.2. Medium
- 5.3.3. High
- 5.4. Market Analysis, Insights and Forecast - by Region
- 5.4.1. Asia Pacific
- 5.4.2. North America
- 5.4.3. Europe
- 5.4.4. South America
- 5.4.5. Middle East and Africa
- 5.1. Market Analysis, Insights and Forecast - by Application
- 6. Asia Pacific Extruded Polystyrene Industry Analysis, Insights and Forecast, 2019-2031
- 6.1. Market Analysis, Insights and Forecast - by Application
- 6.1.1. Residential
- 6.1.2. Commercial
- 6.1.3. Infrastructure
- 6.2. Market Analysis, Insights and Forecast - by Type
- 6.2.1. Type I
- 6.2.2. Type II
- 6.2.3. Type III
- 6.2.4. Type IV
- 6.2.5. Type V
- 6.3. Market Analysis, Insights and Forecast - by Density
- 6.3.1. Low
- 6.3.2. Medium
- 6.3.3. High
- 6.1. Market Analysis, Insights and Forecast - by Application
- 7. North America Extruded Polystyrene Industry Analysis, Insights and Forecast, 2019-2031
- 7.1. Market Analysis, Insights and Forecast - by Application
- 7.1.1. Residential
- 7.1.2. Commercial
- 7.1.3. Infrastructure
- 7.2. Market Analysis, Insights and Forecast - by Type
- 7.2.1. Type I
- 7.2.2. Type II
- 7.2.3. Type III
- 7.2.4. Type IV
- 7.2.5. Type V
- 7.3. Market Analysis, Insights and Forecast - by Density
- 7.3.1. Low
- 7.3.2. Medium
- 7.3.3. High
- 7.1. Market Analysis, Insights and Forecast - by Application
- 8. Europe Extruded Polystyrene Industry Analysis, Insights and Forecast, 2019-2031
- 8.1. Market Analysis, Insights and Forecast - by Application
- 8.1.1. Residential
- 8.1.2. Commercial
- 8.1.3. Infrastructure
- 8.2. Market Analysis, Insights and Forecast - by Type
- 8.2.1. Type I
- 8.2.2. Type II
- 8.2.3. Type III
- 8.2.4. Type IV
- 8.2.5. Type V
- 8.3. Market Analysis, Insights and Forecast - by Density
- 8.3.1. Low
- 8.3.2. Medium
- 8.3.3. High
- 8.1. Market Analysis, Insights and Forecast - by Application
- 9. South America Extruded Polystyrene Industry Analysis, Insights and Forecast, 2019-2031
- 9.1. Market Analysis, Insights and Forecast - by Application
- 9.1.1. Residential
- 9.1.2. Commercial
- 9.1.3. Infrastructure
- 9.2. Market Analysis, Insights and Forecast - by Type
- 9.2.1. Type I
- 9.2.2. Type II
- 9.2.3. Type III
- 9.2.4. Type IV
- 9.2.5. Type V
- 9.3. Market Analysis, Insights and Forecast - by Density
- 9.3.1. Low
- 9.3.2. Medium
- 9.3.3. High
- 9.1. Market Analysis, Insights and Forecast - by Application
- 10. Middle East and Africa Extruded Polystyrene Industry Analysis, Insights and Forecast, 2019-2031
- 10.1. Market Analysis, Insights and Forecast - by Application
- 10.1.1. Residential
- 10.1.2. Commercial
- 10.1.3. Infrastructure
- 10.2. Market Analysis, Insights and Forecast - by Type
- 10.2.1. Type I
- 10.2.2. Type II
- 10.2.3. Type III
- 10.2.4. Type IV
- 10.2.5. Type V
- 10.3. Market Analysis, Insights and Forecast - by Density
- 10.3.1. Low
- 10.3.2. Medium
- 10.3.3. High
- 10.1. Market Analysis, Insights and Forecast - by Application
- 11. Asia Pacific Extruded Polystyrene Industry Analysis, Insights and Forecast, 2019-2031
- 11.1. Market Analysis, Insights and Forecast - By Country/Sub-region
- 11.1.1 China
- 11.1.2 India
- 11.1.3 Japan
- 11.1.4 South Korea
- 11.1.5 Rest of Asia Pacific
- 12. North America Extruded Polystyrene Industry Analysis, Insights and Forecast, 2019-2031
- 12.1. Market Analysis, Insights and Forecast - By Country/Sub-region
- 12.1.1 United States
- 12.1.2 Canada
- 12.1.3 Mexico
- 13. Europe Extruded Polystyrene Industry Analysis, Insights and Forecast, 2019-2031
- 13.1. Market Analysis, Insights and Forecast - By Country/Sub-region
- 13.1.1 Germany
- 13.1.2 United Kingdom
- 13.1.3 Italy
- 13.1.4 France
- 13.1.5 Rest of Europe
- 14. South America Extruded Polystyrene Industry Analysis, Insights and Forecast, 2019-2031
- 14.1. Market Analysis, Insights and Forecast - By Country/Sub-region
- 14.1.1 Brazil
- 14.1.2 Argentina
- 14.1.3 Rest of South America
- 15. Middle East and Africa Extruded Polystyrene Industry Analysis, Insights and Forecast, 2019-2031
- 15.1. Market Analysis, Insights and Forecast - By Country/Sub-region
- 15.1.1 Saudi Arabia
- 15.1.2 South Africa
- 15.1.3 Rest of Middle East and Africa
- 16. Competitive Analysis
- 16.1. Global Market Share Analysis 2024
- 16.2. Company Profiles
- 16.2.1 Synthos
- 16.2.1.1. Overview
- 16.2.1.2. Products
- 16.2.1.3. SWOT Analysis
- 16.2.1.4. Recent Developments
- 16.2.1.5. Financials (Based on Availability)
- 16.2.2 Saint-Gobain
- 16.2.2.1. Overview
- 16.2.2.2. Products
- 16.2.2.3. SWOT Analysis
- 16.2.2.4. Recent Developments
- 16.2.2.5. Financials (Based on Availability)
- 16.2.3 Ravago Greece Group
- 16.2.3.1. Overview
- 16.2.3.2. Products
- 16.2.3.3. SWOT Analysis
- 16.2.3.4. Recent Developments
- 16.2.3.5. Financials (Based on Availability)
- 16.2.4 URSA
- 16.2.4.1. Overview
- 16.2.4.2. Products
- 16.2.4.3. SWOT Analysis
- 16.2.4.4. Recent Developments
- 16.2.4.5. Financials (Based on Availability)
- 16.2.5 JACKON Insulation GmbH
- 16.2.5.1. Overview
- 16.2.5.2. Products
- 16.2.5.3. SWOT Analysis
- 16.2.5.4. Recent Developments
- 16.2.5.5. Financials (Based on Availability)
- 16.2.6 Soprema Group
- 16.2.6.1. Overview
- 16.2.6.2. Products
- 16.2.6.3. SWOT Analysis
- 16.2.6.4. Recent Developments
- 16.2.6.5. Financials (Based on Availability)
- 16.2.7 Owens Corning
- 16.2.7.1. Overview
- 16.2.7.2. Products
- 16.2.7.3. SWOT Analysis
- 16.2.7.4. Recent Developments
- 16.2.7.5. Financials (Based on Availability)
- 16.2.8 Kingspan Group
- 16.2.8.1. Overview
- 16.2.8.2. Products
- 16.2.8.3. SWOT Analysis
- 16.2.8.4. Recent Developments
- 16.2.8.5. Financials (Based on Availability)
- 16.2.9 BASF SE
- 16.2.9.1. Overview
- 16.2.9.2. Products
- 16.2.9.3. SWOT Analysis
- 16.2.9.4. Recent Developments
- 16.2.9.5. Financials (Based on Availability)
- 16.2.10 DuPont
- 16.2.10.1. Overview
- 16.2.10.2. Products
- 16.2.10.3. SWOT Analysis
- 16.2.10.4. Recent Developments
- 16.2.10.5. Financials (Based on Availability)
- 16.2.11 TECHNONICOL
- 16.2.11.1. Overview
- 16.2.11.2. Products
- 16.2.11.3. SWOT Analysis
- 16.2.11.4. Recent Developments
- 16.2.11.5. Financials (Based on Availability)
- 16.2.12 Knauf Insulation
- 16.2.12.1. Overview
- 16.2.12.2. Products
- 16.2.12.3. SWOT Analysis
- 16.2.12.4. Recent Developments
- 16.2.12.5. Financials (Based on Availability)
- 16.2.13 EMIRATES EXTRUDED POLYSTYRENE L L C
- 16.2.13.1. Overview
- 16.2.13.2. Products
- 16.2.13.3. SWOT Analysis
- 16.2.13.4. Recent Developments
- 16.2.13.5. Financials (Based on Availability)
- 16.2.14 Austrotherm
- 16.2.14.1. Overview
- 16.2.14.2. Products
- 16.2.14.3. SWOT Analysis
- 16.2.14.4. Recent Developments
- 16.2.14.5. Financials (Based on Availability)
- 16.2.1 Synthos
List of Figures
- Figure 1: Global Extruded Polystyrene Industry Revenue Breakdown (Million, %) by Region 2024 & 2032
- Figure 2: Global Extruded Polystyrene Industry Volume Breakdown (K Tons, %) by Region 2024 & 2032
- Figure 3: Asia Pacific Extruded Polystyrene Industry Revenue (Million), by Country 2024 & 2032
- Figure 4: Asia Pacific Extruded Polystyrene Industry Volume (K Tons), by Country 2024 & 2032
- Figure 5: Asia Pacific Extruded Polystyrene Industry Revenue Share (%), by Country 2024 & 2032
- Figure 6: Asia Pacific Extruded Polystyrene Industry Volume Share (%), by Country 2024 & 2032
- Figure 7: North America Extruded Polystyrene Industry Revenue (Million), by Country 2024 & 2032
- Figure 8: North America Extruded Polystyrene Industry Volume (K Tons), by Country 2024 & 2032
- Figure 9: North America Extruded Polystyrene Industry Revenue Share (%), by Country 2024 & 2032
- Figure 10: North America Extruded Polystyrene Industry Volume Share (%), by Country 2024 & 2032
- Figure 11: Europe Extruded Polystyrene Industry Revenue (Million), by Country 2024 & 2032
- Figure 12: Europe Extruded Polystyrene Industry Volume (K Tons), by Country 2024 & 2032
- Figure 13: Europe Extruded Polystyrene Industry Revenue Share (%), by Country 2024 & 2032
- Figure 14: Europe Extruded Polystyrene Industry Volume Share (%), by Country 2024 & 2032
- Figure 15: South America Extruded Polystyrene Industry Revenue (Million), by Country 2024 & 2032
- Figure 16: South America Extruded Polystyrene Industry Volume (K Tons), by Country 2024 & 2032
- Figure 17: South America Extruded Polystyrene Industry Revenue Share (%), by Country 2024 & 2032
- Figure 18: South America Extruded Polystyrene Industry Volume Share (%), by Country 2024 & 2032
- Figure 19: Middle East and Africa Extruded Polystyrene Industry Revenue (Million), by Country 2024 & 2032
- Figure 20: Middle East and Africa Extruded Polystyrene Industry Volume (K Tons), by Country 2024 & 2032
- Figure 21: Middle East and Africa Extruded Polystyrene Industry Revenue Share (%), by Country 2024 & 2032
- Figure 22: Middle East and Africa Extruded Polystyrene Industry Volume Share (%), by Country 2024 & 2032
- Figure 23: Asia Pacific Extruded Polystyrene Industry Revenue (Million), by Application 2024 & 2032
- Figure 24: Asia Pacific Extruded Polystyrene Industry Volume (K Tons), by Application 2024 & 2032
- Figure 25: Asia Pacific Extruded Polystyrene Industry Revenue Share (%), by Application 2024 & 2032
- Figure 26: Asia Pacific Extruded Polystyrene Industry Volume Share (%), by Application 2024 & 2032
- Figure 27: Asia Pacific Extruded Polystyrene Industry Revenue (Million), by Type 2024 & 2032
- Figure 28: Asia Pacific Extruded Polystyrene Industry Volume (K Tons), by Type 2024 & 2032
- Figure 29: Asia Pacific Extruded Polystyrene Industry Revenue Share (%), by Type 2024 & 2032
- Figure 30: Asia Pacific Extruded Polystyrene Industry Volume Share (%), by Type 2024 & 2032
- Figure 31: Asia Pacific Extruded Polystyrene Industry Revenue (Million), by Density 2024 & 2032
- Figure 32: Asia Pacific Extruded Polystyrene Industry Volume (K Tons), by Density 2024 & 2032
- Figure 33: Asia Pacific Extruded Polystyrene Industry Revenue Share (%), by Density 2024 & 2032
- Figure 34: Asia Pacific Extruded Polystyrene Industry Volume Share (%), by Density 2024 & 2032
- Figure 35: Asia Pacific Extruded Polystyrene Industry Revenue (Million), by Country 2024 & 2032
- Figure 36: Asia Pacific Extruded Polystyrene Industry Volume (K Tons), by Country 2024 & 2032
- Figure 37: Asia Pacific Extruded Polystyrene Industry Revenue Share (%), by Country 2024 & 2032
- Figure 38: Asia Pacific Extruded Polystyrene Industry Volume Share (%), by Country 2024 & 2032
- Figure 39: North America Extruded Polystyrene Industry Revenue (Million), by Application 2024 & 2032
- Figure 40: North America Extruded Polystyrene Industry Volume (K Tons), by Application 2024 & 2032
- Figure 41: North America Extruded Polystyrene Industry Revenue Share (%), by Application 2024 & 2032
- Figure 42: North America Extruded Polystyrene Industry Volume Share (%), by Application 2024 & 2032
- Figure 43: North America Extruded Polystyrene Industry Revenue (Million), by Type 2024 & 2032
- Figure 44: North America Extruded Polystyrene Industry Volume (K Tons), by Type 2024 & 2032
- Figure 45: North America Extruded Polystyrene Industry Revenue Share (%), by Type 2024 & 2032
- Figure 46: North America Extruded Polystyrene Industry Volume Share (%), by Type 2024 & 2032
- Figure 47: North America Extruded Polystyrene Industry Revenue (Million), by Density 2024 & 2032
- Figure 48: North America Extruded Polystyrene Industry Volume (K Tons), by Density 2024 & 2032
- Figure 49: North America Extruded Polystyrene Industry Revenue Share (%), by Density 2024 & 2032
- Figure 50: North America Extruded Polystyrene Industry Volume Share (%), by Density 2024 & 2032
- Figure 51: North America Extruded Polystyrene Industry Revenue (Million), by Country 2024 & 2032
- Figure 52: North America Extruded Polystyrene Industry Volume (K Tons), by Country 2024 & 2032
- Figure 53: North America Extruded Polystyrene Industry Revenue Share (%), by Country 2024 & 2032
- Figure 54: North America Extruded Polystyrene Industry Volume Share (%), by Country 2024 & 2032
- Figure 55: Europe Extruded Polystyrene Industry Revenue (Million), by Application 2024 & 2032
- Figure 56: Europe Extruded Polystyrene Industry Volume (K Tons), by Application 2024 & 2032
- Figure 57: Europe Extruded Polystyrene Industry Revenue Share (%), by Application 2024 & 2032
- Figure 58: Europe Extruded Polystyrene Industry Volume Share (%), by Application 2024 & 2032
- Figure 59: Europe Extruded Polystyrene Industry Revenue (Million), by Type 2024 & 2032
- Figure 60: Europe Extruded Polystyrene Industry Volume (K Tons), by Type 2024 & 2032
- Figure 61: Europe Extruded Polystyrene Industry Revenue Share (%), by Type 2024 & 2032
- Figure 62: Europe Extruded Polystyrene Industry Volume Share (%), by Type 2024 & 2032
- Figure 63: Europe Extruded Polystyrene Industry Revenue (Million), by Density 2024 & 2032
- Figure 64: Europe Extruded Polystyrene Industry Volume (K Tons), by Density 2024 & 2032
- Figure 65: Europe Extruded Polystyrene Industry Revenue Share (%), by Density 2024 & 2032
- Figure 66: Europe Extruded Polystyrene Industry Volume Share (%), by Density 2024 & 2032
- Figure 67: Europe Extruded Polystyrene Industry Revenue (Million), by Country 2024 & 2032
- Figure 68: Europe Extruded Polystyrene Industry Volume (K Tons), by Country 2024 & 2032
- Figure 69: Europe Extruded Polystyrene Industry Revenue Share (%), by Country 2024 & 2032
- Figure 70: Europe Extruded Polystyrene Industry Volume Share (%), by Country 2024 & 2032
- Figure 71: South America Extruded Polystyrene Industry Revenue (Million), by Application 2024 & 2032
- Figure 72: South America Extruded Polystyrene Industry Volume (K Tons), by Application 2024 & 2032
- Figure 73: South America Extruded Polystyrene Industry Revenue Share (%), by Application 2024 & 2032
- Figure 74: South America Extruded Polystyrene Industry Volume Share (%), by Application 2024 & 2032
- Figure 75: South America Extruded Polystyrene Industry Revenue (Million), by Type 2024 & 2032
- Figure 76: South America Extruded Polystyrene Industry Volume (K Tons), by Type 2024 & 2032
- Figure 77: South America Extruded Polystyrene Industry Revenue Share (%), by Type 2024 & 2032
- Figure 78: South America Extruded Polystyrene Industry Volume Share (%), by Type 2024 & 2032
- Figure 79: South America Extruded Polystyrene Industry Revenue (Million), by Density 2024 & 2032
- Figure 80: South America Extruded Polystyrene Industry Volume (K Tons), by Density 2024 & 2032
- Figure 81: South America Extruded Polystyrene Industry Revenue Share (%), by Density 2024 & 2032
- Figure 82: South America Extruded Polystyrene Industry Volume Share (%), by Density 2024 & 2032
- Figure 83: South America Extruded Polystyrene Industry Revenue (Million), by Country 2024 & 2032
- Figure 84: South America Extruded Polystyrene Industry Volume (K Tons), by Country 2024 & 2032
- Figure 85: South America Extruded Polystyrene Industry Revenue Share (%), by Country 2024 & 2032
- Figure 86: South America Extruded Polystyrene Industry Volume Share (%), by Country 2024 & 2032
- Figure 87: Middle East and Africa Extruded Polystyrene Industry Revenue (Million), by Application 2024 & 2032
- Figure 88: Middle East and Africa Extruded Polystyrene Industry Volume (K Tons), by Application 2024 & 2032
- Figure 89: Middle East and Africa Extruded Polystyrene Industry Revenue Share (%), by Application 2024 & 2032
- Figure 90: Middle East and Africa Extruded Polystyrene Industry Volume Share (%), by Application 2024 & 2032
- Figure 91: Middle East and Africa Extruded Polystyrene Industry Revenue (Million), by Type 2024 & 2032
- Figure 92: Middle East and Africa Extruded Polystyrene Industry Volume (K Tons), by Type 2024 & 2032
- Figure 93: Middle East and Africa Extruded Polystyrene Industry Revenue Share (%), by Type 2024 & 2032
- Figure 94: Middle East and Africa Extruded Polystyrene Industry Volume Share (%), by Type 2024 & 2032
- Figure 95: Middle East and Africa Extruded Polystyrene Industry Revenue (Million), by Density 2024 & 2032
- Figure 96: Middle East and Africa Extruded Polystyrene Industry Volume (K Tons), by Density 2024 & 2032
- Figure 97: Middle East and Africa Extruded Polystyrene Industry Revenue Share (%), by Density 2024 & 2032
- Figure 98: Middle East and Africa Extruded Polystyrene Industry Volume Share (%), by Density 2024 & 2032
- Figure 99: Middle East and Africa Extruded Polystyrene Industry Revenue (Million), by Country 2024 & 2032
- Figure 100: Middle East and Africa Extruded Polystyrene Industry Volume (K Tons), by Country 2024 & 2032
- Figure 101: Middle East and Africa Extruded Polystyrene Industry Revenue Share (%), by Country 2024 & 2032
- Figure 102: Middle East and Africa Extruded Polystyrene Industry Volume Share (%), by Country 2024 & 2032
List of Tables
- Table 1: Global Extruded Polystyrene Industry Revenue Million Forecast, by Region 2019 & 2032
- Table 2: Global Extruded Polystyrene Industry Volume K Tons Forecast, by Region 2019 & 2032
- Table 3: Global Extruded Polystyrene Industry Revenue Million Forecast, by Application 2019 & 2032
- Table 4: Global Extruded Polystyrene Industry Volume K Tons Forecast, by Application 2019 & 2032
- Table 5: Global Extruded Polystyrene Industry Revenue Million Forecast, by Type 2019 & 2032
- Table 6: Global Extruded Polystyrene Industry Volume K Tons Forecast, by Type 2019 & 2032
- Table 7: Global Extruded Polystyrene Industry Revenue Million Forecast, by Density 2019 & 2032
- Table 8: Global Extruded Polystyrene Industry Volume K Tons Forecast, by Density 2019 & 2032
- Table 9: Global Extruded Polystyrene Industry Revenue Million Forecast, by Region 2019 & 2032
- Table 10: Global Extruded Polystyrene Industry Volume K Tons Forecast, by Region 2019 & 2032
- Table 11: Global Extruded Polystyrene Industry Revenue Million Forecast, by Country 2019 & 2032
- Table 12: Global Extruded Polystyrene Industry Volume K Tons Forecast, by Country 2019 & 2032
- Table 13: China Extruded Polystyrene Industry Revenue (Million) Forecast, by Application 2019 & 2032
- Table 14: China Extruded Polystyrene Industry Volume (K Tons) Forecast, by Application 2019 & 2032
- Table 15: India Extruded Polystyrene Industry Revenue (Million) Forecast, by Application 2019 & 2032
- Table 16: India Extruded Polystyrene Industry Volume (K Tons) Forecast, by Application 2019 & 2032
- Table 17: Japan Extruded Polystyrene Industry Revenue (Million) Forecast, by Application 2019 & 2032
- Table 18: Japan Extruded Polystyrene Industry Volume (K Tons) Forecast, by Application 2019 & 2032
- Table 19: South Korea Extruded Polystyrene Industry Revenue (Million) Forecast, by Application 2019 & 2032
- Table 20: South Korea Extruded Polystyrene Industry Volume (K Tons) Forecast, by Application 2019 & 2032
- Table 21: Rest of Asia Pacific Extruded Polystyrene Industry Revenue (Million) Forecast, by Application 2019 & 2032
- Table 22: Rest of Asia Pacific Extruded Polystyrene Industry Volume (K Tons) Forecast, by Application 2019 & 2032
- Table 23: Global Extruded Polystyrene Industry Revenue Million Forecast, by Country 2019 & 2032
- Table 24: Global Extruded Polystyrene Industry Volume K Tons Forecast, by Country 2019 & 2032
- Table 25: United States Extruded Polystyrene Industry Revenue (Million) Forecast, by Application 2019 & 2032
- Table 26: United States Extruded Polystyrene Industry Volume (K Tons) Forecast, by Application 2019 & 2032
- Table 27: Canada Extruded Polystyrene Industry Revenue (Million) Forecast, by Application 2019 & 2032
- Table 28: Canada Extruded Polystyrene Industry Volume (K Tons) Forecast, by Application 2019 & 2032
- Table 29: Mexico Extruded Polystyrene Industry Revenue (Million) Forecast, by Application 2019 & 2032
- Table 30: Mexico Extruded Polystyrene Industry Volume (K Tons) Forecast, by Application 2019 & 2032
- Table 31: Global Extruded Polystyrene Industry Revenue Million Forecast, by Country 2019 & 2032
- Table 32: Global Extruded Polystyrene Industry Volume K Tons Forecast, by Country 2019 & 2032
- Table 33: Germany Extruded Polystyrene Industry Revenue (Million) Forecast, by Application 2019 & 2032
- Table 34: Germany Extruded Polystyrene Industry Volume (K Tons) Forecast, by Application 2019 & 2032
- Table 35: United Kingdom Extruded Polystyrene Industry Revenue (Million) Forecast, by Application 2019 & 2032
- Table 36: United Kingdom Extruded Polystyrene Industry Volume (K Tons) Forecast, by Application 2019 & 2032
- Table 37: Italy Extruded Polystyrene Industry Revenue (Million) Forecast, by Application 2019 & 2032
- Table 38: Italy Extruded Polystyrene Industry Volume (K Tons) Forecast, by Application 2019 & 2032
- Table 39: France Extruded Polystyrene Industry Revenue (Million) Forecast, by Application 2019 & 2032
- Table 40: France Extruded Polystyrene Industry Volume (K Tons) Forecast, by Application 2019 & 2032
- Table 41: Rest of Europe Extruded Polystyrene Industry Revenue (Million) Forecast, by Application 2019 & 2032
- Table 42: Rest of Europe Extruded Polystyrene Industry Volume (K Tons) Forecast, by Application 2019 & 2032
- Table 43: Global Extruded Polystyrene Industry Revenue Million Forecast, by Country 2019 & 2032
- Table 44: Global Extruded Polystyrene Industry Volume K Tons Forecast, by Country 2019 & 2032
- Table 45: Brazil Extruded Polystyrene Industry Revenue (Million) Forecast, by Application 2019 & 2032
- Table 46: Brazil Extruded Polystyrene Industry Volume (K Tons) Forecast, by Application 2019 & 2032
- Table 47: Argentina Extruded Polystyrene Industry Revenue (Million) Forecast, by Application 2019 & 2032
- Table 48: Argentina Extruded Polystyrene Industry Volume (K Tons) Forecast, by Application 2019 & 2032
- Table 49: Rest of South America Extruded Polystyrene Industry Revenue (Million) Forecast, by Application 2019 & 2032
- Table 50: Rest of South America Extruded Polystyrene Industry Volume (K Tons) Forecast, by Application 2019 & 2032
- Table 51: Global Extruded Polystyrene Industry Revenue Million Forecast, by Country 2019 & 2032
- Table 52: Global Extruded Polystyrene Industry Volume K Tons Forecast, by Country 2019 & 2032
- Table 53: Saudi Arabia Extruded Polystyrene Industry Revenue (Million) Forecast, by Application 2019 & 2032
- Table 54: Saudi Arabia Extruded Polystyrene Industry Volume (K Tons) Forecast, by Application 2019 & 2032
- Table 55: South Africa Extruded Polystyrene Industry Revenue (Million) Forecast, by Application 2019 & 2032
- Table 56: South Africa Extruded Polystyrene Industry Volume (K Tons) Forecast, by Application 2019 & 2032
- Table 57: Rest of Middle East and Africa Extruded Polystyrene Industry Revenue (Million) Forecast, by Application 2019 & 2032
- Table 58: Rest of Middle East and Africa Extruded Polystyrene Industry Volume (K Tons) Forecast, by Application 2019 & 2032
- Table 59: Global Extruded Polystyrene Industry Revenue Million Forecast, by Application 2019 & 2032
- Table 60: Global Extruded Polystyrene Industry Volume K Tons Forecast, by Application 2019 & 2032
- Table 61: Global Extruded Polystyrene Industry Revenue Million Forecast, by Type 2019 & 2032
- Table 62: Global Extruded Polystyrene Industry Volume K Tons Forecast, by Type 2019 & 2032
- Table 63: Global Extruded Polystyrene Industry Revenue Million Forecast, by Density 2019 & 2032
- Table 64: Global Extruded Polystyrene Industry Volume K Tons Forecast, by Density 2019 & 2032
- Table 65: Global Extruded Polystyrene Industry Revenue Million Forecast, by Country 2019 & 2032
- Table 66: Global Extruded Polystyrene Industry Volume K Tons Forecast, by Country 2019 & 2032
- Table 67: China Extruded Polystyrene Industry Revenue (Million) Forecast, by Application 2019 & 2032
- Table 68: China Extruded Polystyrene Industry Volume (K Tons) Forecast, by Application 2019 & 2032
- Table 69: India Extruded Polystyrene Industry Revenue (Million) Forecast, by Application 2019 & 2032
- Table 70: India Extruded Polystyrene Industry Volume (K Tons) Forecast, by Application 2019 & 2032
- Table 71: Japan Extruded Polystyrene Industry Revenue (Million) Forecast, by Application 2019 & 2032
- Table 72: Japan Extruded Polystyrene Industry Volume (K Tons) Forecast, by Application 2019 & 2032
- Table 73: South Korea Extruded Polystyrene Industry Revenue (Million) Forecast, by Application 2019 & 2032
- Table 74: South Korea Extruded Polystyrene Industry Volume (K Tons) Forecast, by Application 2019 & 2032
- Table 75: Rest of Asia Pacific Extruded Polystyrene Industry Revenue (Million) Forecast, by Application 2019 & 2032
- Table 76: Rest of Asia Pacific Extruded Polystyrene Industry Volume (K Tons) Forecast, by Application 2019 & 2032
- Table 77: Global Extruded Polystyrene Industry Revenue Million Forecast, by Application 2019 & 2032
- Table 78: Global Extruded Polystyrene Industry Volume K Tons Forecast, by Application 2019 & 2032
- Table 79: Global Extruded Polystyrene Industry Revenue Million Forecast, by Type 2019 & 2032
- Table 80: Global Extruded Polystyrene Industry Volume K Tons Forecast, by Type 2019 & 2032
- Table 81: Global Extruded Polystyrene Industry Revenue Million Forecast, by Density 2019 & 2032
- Table 82: Global Extruded Polystyrene Industry Volume K Tons Forecast, by Density 2019 & 2032
- Table 83: Global Extruded Polystyrene Industry Revenue Million Forecast, by Country 2019 & 2032
- Table 84: Global Extruded Polystyrene Industry Volume K Tons Forecast, by Country 2019 & 2032
- Table 85: United States Extruded Polystyrene Industry Revenue (Million) Forecast, by Application 2019 & 2032
- Table 86: United States Extruded Polystyrene Industry Volume (K Tons) Forecast, by Application 2019 & 2032
- Table 87: Canada Extruded Polystyrene Industry Revenue (Million) Forecast, by Application 2019 & 2032
- Table 88: Canada Extruded Polystyrene Industry Volume (K Tons) Forecast, by Application 2019 & 2032
- Table 89: Mexico Extruded Polystyrene Industry Revenue (Million) Forecast, by Application 2019 & 2032
- Table 90: Mexico Extruded Polystyrene Industry Volume (K Tons) Forecast, by Application 2019 & 2032
- Table 91: Global Extruded Polystyrene Industry Revenue Million Forecast, by Application 2019 & 2032
- Table 92: Global Extruded Polystyrene Industry Volume K Tons Forecast, by Application 2019 & 2032
- Table 93: Global Extruded Polystyrene Industry Revenue Million Forecast, by Type 2019 & 2032
- Table 94: Global Extruded Polystyrene Industry Volume K Tons Forecast, by Type 2019 & 2032
- Table 95: Global Extruded Polystyrene Industry Revenue Million Forecast, by Density 2019 & 2032
- Table 96: Global Extruded Polystyrene Industry Volume K Tons Forecast, by Density 2019 & 2032
- Table 97: Global Extruded Polystyrene Industry Revenue Million Forecast, by Country 2019 & 2032
- Table 98: Global Extruded Polystyrene Industry Volume K Tons Forecast, by Country 2019 & 2032
- Table 99: Germany Extruded Polystyrene Industry Revenue (Million) Forecast, by Application 2019 & 2032
- Table 100: Germany Extruded Polystyrene Industry Volume (K Tons) Forecast, by Application 2019 & 2032
- Table 101: United Kingdom Extruded Polystyrene Industry Revenue (Million) Forecast, by Application 2019 & 2032
- Table 102: United Kingdom Extruded Polystyrene Industry Volume (K Tons) Forecast, by Application 2019 & 2032
- Table 103: Italy Extruded Polystyrene Industry Revenue (Million) Forecast, by Application 2019 & 2032
- Table 104: Italy Extruded Polystyrene Industry Volume (K Tons) Forecast, by Application 2019 & 2032
- Table 105: France Extruded Polystyrene Industry Revenue (Million) Forecast, by Application 2019 & 2032
- Table 106: France Extruded Polystyrene Industry Volume (K Tons) Forecast, by Application 2019 & 2032
- Table 107: Rest of Europe Extruded Polystyrene Industry Revenue (Million) Forecast, by Application 2019 & 2032
- Table 108: Rest of Europe Extruded Polystyrene Industry Volume (K Tons) Forecast, by Application 2019 & 2032
- Table 109: Global Extruded Polystyrene Industry Revenue Million Forecast, by Application 2019 & 2032
- Table 110: Global Extruded Polystyrene Industry Volume K Tons Forecast, by Application 2019 & 2032
- Table 111: Global Extruded Polystyrene Industry Revenue Million Forecast, by Type 2019 & 2032
- Table 112: Global Extruded Polystyrene Industry Volume K Tons Forecast, by Type 2019 & 2032
- Table 113: Global Extruded Polystyrene Industry Revenue Million Forecast, by Density 2019 & 2032
- Table 114: Global Extruded Polystyrene Industry Volume K Tons Forecast, by Density 2019 & 2032
- Table 115: Global Extruded Polystyrene Industry Revenue Million Forecast, by Country 2019 & 2032
- Table 116: Global Extruded Polystyrene Industry Volume K Tons Forecast, by Country 2019 & 2032
- Table 117: Brazil Extruded Polystyrene Industry Revenue (Million) Forecast, by Application 2019 & 2032
- Table 118: Brazil Extruded Polystyrene Industry Volume (K Tons) Forecast, by Application 2019 & 2032
- Table 119: Argentina Extruded Polystyrene Industry Revenue (Million) Forecast, by Application 2019 & 2032
- Table 120: Argentina Extruded Polystyrene Industry Volume (K Tons) Forecast, by Application 2019 & 2032
- Table 121: Rest of South America Extruded Polystyrene Industry Revenue (Million) Forecast, by Application 2019 & 2032
- Table 122: Rest of South America Extruded Polystyrene Industry Volume (K Tons) Forecast, by Application 2019 & 2032
- Table 123: Global Extruded Polystyrene Industry Revenue Million Forecast, by Application 2019 & 2032
- Table 124: Global Extruded Polystyrene Industry Volume K Tons Forecast, by Application 2019 & 2032
- Table 125: Global Extruded Polystyrene Industry Revenue Million Forecast, by Type 2019 & 2032
- Table 126: Global Extruded Polystyrene Industry Volume K Tons Forecast, by Type 2019 & 2032
- Table 127: Global Extruded Polystyrene Industry Revenue Million Forecast, by Density 2019 & 2032
- Table 128: Global Extruded Polystyrene Industry Volume K Tons Forecast, by Density 2019 & 2032
- Table 129: Global Extruded Polystyrene Industry Revenue Million Forecast, by Country 2019 & 2032
- Table 130: Global Extruded Polystyrene Industry Volume K Tons Forecast, by Country 2019 & 2032
- Table 131: Saudi Arabia Extruded Polystyrene Industry Revenue (Million) Forecast, by Application 2019 & 2032
- Table 132: Saudi Arabia Extruded Polystyrene Industry Volume (K Tons) Forecast, by Application 2019 & 2032
- Table 133: South Africa Extruded Polystyrene Industry Revenue (Million) Forecast, by Application 2019 & 2032
- Table 134: South Africa Extruded Polystyrene Industry Volume (K Tons) Forecast, by Application 2019 & 2032
- Table 135: Rest of Middle East and Africa Extruded Polystyrene Industry Revenue (Million) Forecast, by Application 2019 & 2032
- Table 136: Rest of Middle East and Africa Extruded Polystyrene Industry Volume (K Tons) Forecast, by Application 2019 & 2032
Frequently Asked Questions
1. What is the projected Compound Annual Growth Rate (CAGR) of the Extruded Polystyrene Industry?
The projected CAGR is approximately > 4.00%.
2. Which companies are prominent players in the Extruded Polystyrene Industry?
Key companies in the market include Synthos, Saint-Gobain, Ravago Greece Group, URSA, JACKON Insulation GmbH, Soprema Group, Owens Corning, Kingspan Group, BASF SE, DuPont, TECHNONICOL, Knauf Insulation, EMIRATES EXTRUDED POLYSTYRENE L L C, Austrotherm.
3. What are the main segments of the Extruded Polystyrene Industry?
The market segments include Application, Type, Density.
4. Can you provide details about the market size?
The market size is estimated to be USD XX Million as of 2022.
5. What are some drivers contributing to market growth?
Growth in Construction and Building Activities; Increase in Demand for Insulation Materials.
6. What are the notable trends driving market growth?
Increasing Demand from the Residential Segment.
7. Are there any restraints impacting market growth?
High Cost of Extruded Polystyrene; Other Restraints.
8. Can you provide examples of recent developments in the market?
January 2023: BASF announced the expansion of the polymer dispersions business in Merak, Indonesia. The new expansion aims to produce more styrene-butadiene dispersions to meet the growing demand for new paper mills in Southeast Asia and Oceania.
9. What pricing options are available for accessing the report?
Pricing options include single-user, multi-user, and enterprise licenses priced at USD 4750, USD 5250, and USD 8750 respectively.
10. Is the market size provided in terms of value or volume?
The market size is provided in terms of value, measured in Million and volume, measured in K Tons.
11. Are there any specific market keywords associated with the report?
Yes, the market keyword associated with the report is "Extruded Polystyrene Industry," which aids in identifying and referencing the specific market segment covered.
12. How do I determine which pricing option suits my needs best?
The pricing options vary based on user requirements and access needs. Individual users may opt for single-user licenses, while businesses requiring broader access may choose multi-user or enterprise licenses for cost-effective access to the report.
13. Are there any additional resources or data provided in the Extruded Polystyrene Industry report?
While the report offers comprehensive insights, it's advisable to review the specific contents or supplementary materials provided to ascertain if additional resources or data are available.
14. How can I stay updated on further developments or reports in the Extruded Polystyrene Industry?
To stay informed about further developments, trends, and reports in the Extruded Polystyrene Industry, consider subscribing to industry newsletters, following relevant companies and organizations, or regularly checking reputable industry news sources and publications.
Methodology
Step 1 - Identification of Relevant Samples Size from Population Database


Step 2 - Approaches for Defining Global Market Size (Value, Volume* & Price*)

Note*: In applicable scenarios
Step 3 - Data Sources
Primary Research
- Web Analytics
- Survey Reports
- Research Institute
- Latest Research Reports
- Opinion Leaders
Secondary Research
- Annual Reports
- White Paper
- Latest Press Release
- Industry Association
- Paid Database
- Investor Presentations

Step 4 - Data Triangulation
Involves using different sources of information in order to increase the validity of a study
These sources are likely to be stakeholders in a program - participants, other researchers, program staff, other community members, and so on.
Then we put all data in single framework & apply various statistical tools to find out the dynamic on the market.
During the analysis stage, feedback from the stakeholder groups would be compared to determine areas of agreement as well as areas of divergence


