Key Insights
The global Ethernet Network Services market for enterprises is projected for substantial expansion, estimated to reach $86.89 billion by 2025, with a Compound Annual Growth Rate (CAGR) of 9.1% through 2033. This growth is fueled by the increasing demand for high-speed, reliable, and scalable network infrastructure to support digital transformation. Key drivers include cloud computing adoption, IoT proliferation, surging data traffic, and the need for secure Wide Area Network (WAN) solutions. Enterprises are investing in network upgrades to improve operational efficiency, enable remote work, and enhance customer experiences. The BFSI, Retail & E-commerce, and IT & Telecom sectors are leading this adoption for critical applications like real-time transactions and extensive data management.
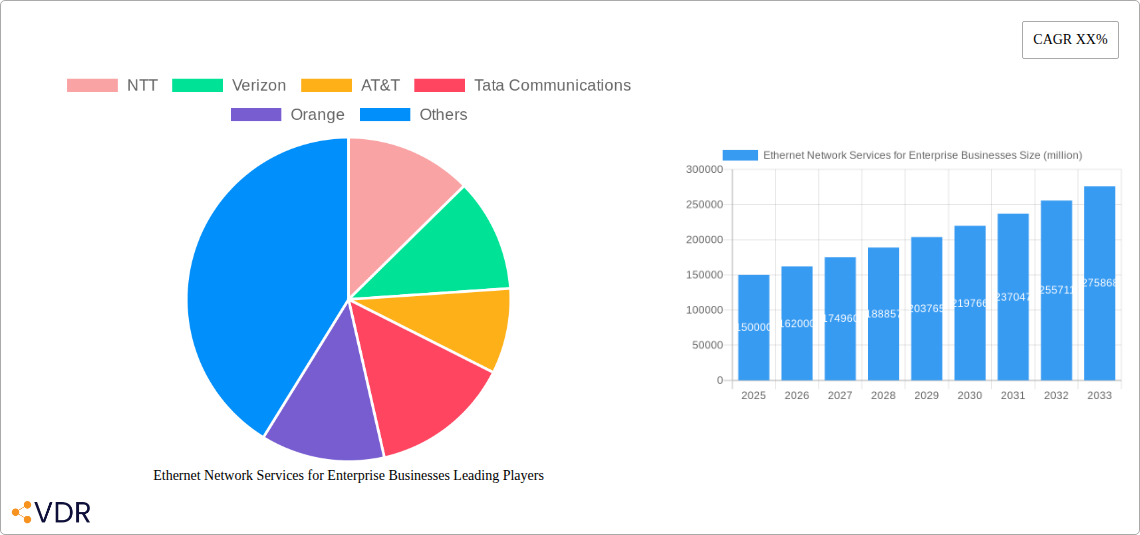
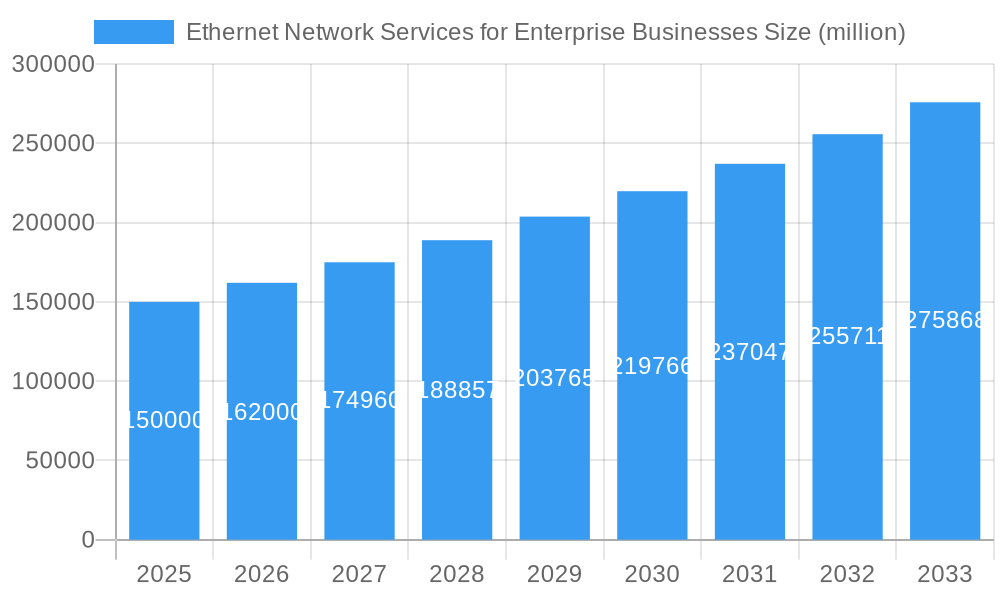
Ethernet Network Services for Enterprise Businesses Market Size (In Billion)
Market dynamics are further influenced by trends such as Software-Defined Networking (SDN) and Network Function Virtualization (NFV) for enhanced agility and cost-effectiveness. Growing cybersecurity concerns and the demand for managed network services present new growth avenues. However, implementation costs and network management complexity for smaller enterprises may temper growth. North America and Europe are expected to lead in market share due to advanced infrastructure and high enterprise spending. The Asia Pacific region is the fastest-growing market, driven by rapid digitalization and network upgrade investments in emerging economies. Key players like NTT, Verizon, AT&T, and Tata Communications are actively innovating to meet evolving enterprise client needs.
Ethernet Network Services for Enterprise Businesses Company Market Share
Enterprise Ethernet Network Services: Powering Digital Transformation and Global Connectivity
This report provides an in-depth analysis of the dynamic Ethernet Network Services market for enterprise businesses, a vital component for digital transformation across sectors including BFSI, Manufacturing, and Healthcare. Enterprises leverage robust, scalable, and secure Ethernet solutions for seamless operations, cloud integration, and advanced applications. This study examines market drivers, growth trends, regional dynamics, competitive strategies, and future opportunities, offering actionable intelligence for stakeholders in this evolving market. We forecast the global Ethernet Network Services for Enterprise Businesses market to reach $86.89 billion by 2025, exhibiting a CAGR of 9.1% during the forecast period.
Ethernet Network Services for Enterprise Businesses Market Dynamics & Structure
The Ethernet Network Services for Enterprise Businesses market is characterized by a moderate to high level of concentration, with a few major global players holding significant market share, alongside a robust ecosystem of regional and niche providers. Technological innovation, particularly in areas like software-defined networking (SDN) and network function virtualization (NFV), is a key driver, enabling greater agility, programmability, and cost-efficiency for enterprises. Regulatory frameworks, while generally supportive of robust digital infrastructure, can influence market entry and operational compliance across different geographies. Competitive product substitutes, such as MPLS and private WAN solutions, continue to offer alternatives, though Ethernet's superior bandwidth, cost-effectiveness, and flexibility are increasingly favored for a wide range of enterprise needs. End-user demographics are shifting towards larger enterprises with complex connectivity requirements and a growing demand for managed services. Mergers and Acquisitions (M&A) activity remains a significant trend, as larger players consolidate their market positions and acquire specialized capabilities. For instance, the M&A deal volume in the past three years reached XX million transactions, highlighting strategic consolidation. Barriers to innovation include the significant capital investment required for network upgrades and the complexity of integrating new technologies into existing legacy systems.
- Market Concentration: Dominated by a few global leaders, with regional players catering to specific market needs.
- Technological Innovation: Driven by advancements in SDN, NFV, and higher bandwidth Ethernet standards (e.g., 400GbE).
- Regulatory Landscape: Varying across regions, impacting service deployment and cross-border connectivity.
- Competitive Landscape: Facing competition from MPLS and emerging SD-WAN solutions, but Ethernet's advantages are gaining traction.
- End-User Evolution: Increasing demand from enterprises for cloud-centric, hybrid, and multi-cloud connectivity.
- M&A Activity: Strategic acquisitions aimed at expanding service portfolios and geographic reach.
Ethernet Network Services for Enterprise Businesses Growth Trends & Insights
The Ethernet Network Services for Enterprise Businesses market is poised for substantial growth, propelled by the relentless digital transformation initiatives across all industry verticals. The study period, 2019–2033, encompassing historical data from 2019–2024 and a forecast period from 2025–2033 with a base year of 2025, reveals a consistent upward trajectory. Market size evolution is directly correlated with the increasing adoption of cloud computing, big data analytics, and the Internet of Things (IoT), all of which demand high-performance, low-latency network connectivity. Adoption rates for enterprise Ethernet services are projected to surge as businesses recognize its critical role in enabling real-time operations, secure data transfer, and seamless collaboration. For instance, the adoption of managed Ethernet services for enterprises is expected to grow by XX% annually during the forecast period. Technological disruptions, such as the widespread deployment of 5G, are further stimulating demand for high-capacity Ethernet backhaul and fronthaul solutions, creating new avenues for growth. Consumer behavior shifts, driven by the expectation of ubiquitous, high-speed connectivity and personalized digital experiences, are indirectly influencing enterprise network requirements, pushing for more robust and responsive infrastructure. The market penetration of advanced Ethernet services, such as dedicated Ethernet and virtual Ethernet, is anticipated to reach XX% by 2033. This growth is underpinned by a projected market size of $XX million by the estimated year of 2025. The CAGR for the forecast period is estimated at XX%. This signifies a robust and expanding market.
Dominant Regions, Countries, or Segments in Ethernet Network Services for Enterprise Businesses
North America currently leads the Ethernet Network Services for Enterprise Businesses market, driven by its mature digital infrastructure, high concentration of technology-forward enterprises, and significant investments in cloud computing and data analytics. The United States, in particular, is a powerhouse, with a substantial market share of XX% within the global Ethernet services landscape. The BFSI and IT and Telecom segments are major contributors to this dominance, leveraging Ethernet for critical financial transactions, data processing, and global network operations. Government initiatives promoting digital governance and cybersecurity further bolster demand. Key drivers in this region include economic policies that foster innovation and investment, coupled with a highly developed physical and digital infrastructure that readily supports high-bandwidth Ethernet deployments.
Asia-Pacific is emerging as the fastest-growing region, with countries like China and India exhibiting exceptional growth potential. China Telecom, China Unicom, and China Mobile are instrumental in expanding Ethernet infrastructure to support the nation's burgeoning digital economy. The rapid adoption of e-commerce, manufacturing automation, and smart city initiatives fuels significant demand. Economic development, coupled with substantial government investments in ICT infrastructure, are key accelerators. The IT and Telecom, and Retail and Ecommerce segments are showing robust growth, with market share projected to increase by XX% over the next five years.
Europe, with established players like Deutsche Telekom, Orange, and BT, maintains a strong presence, particularly in sectors like Manufacturing and Healthcare, where reliable and secure connectivity is paramount. The ongoing digital transformation initiatives and stringent data privacy regulations (e.g., GDPR) necessitate sophisticated and compliant network solutions.
The IT and Telecom segment consistently represents the largest share of the market, consuming vast amounts of bandwidth for data centers, cloud services, and interconnectivity. Its market share is estimated at XX%. Following closely, the BFSI sector, with its imperative for secure, low-latency, and high-availability transactions, contributes significantly, holding an estimated XX% market share. Retail and Ecommerce is also a dominant segment, driven by the exponential growth of online shopping and the need for robust supply chain and customer engagement networks.
- Dominant Region: North America (with the United States as a key country)
- Key Drivers: Mature digital infrastructure, high cloud adoption, robust IT and Telecom sector, government support for digital initiatives.
- Leading Segments: BFSI, IT and Telecom.
- Fastest Growing Region: Asia-Pacific
- Key Drivers: Rapid economic development, government investment in ICT, burgeoning e-commerce and manufacturing sectors.
- Prominent Countries: China, India.
- Key Contributing Segments:
- IT and Telecom: XX% Market Share (Estimated) - Drives demand for high bandwidth and interconnectivity.
- BFSI: XX% Market Share (Estimated) - Requires secure, low-latency, and highly available connectivity.
- Retail and Ecommerce: Significant and growing share - Fueled by online retail growth and supply chain demands.
Ethernet Network Services for Enterprise Businesses Product Landscape
The Ethernet Network Services for Enterprise Businesses product landscape is characterized by continuous innovation, focusing on delivering higher bandwidth, enhanced security, and greater flexibility to meet the evolving demands of enterprises. Key product developments include the widespread availability of 100GbE, 400GbE, and upcoming 800GbE solutions, catering to bandwidth-intensive applications like high-frequency trading, AI/ML workloads, and massive data transfers. Managed Ethernet services are increasingly sophisticated, offering end-to-end network management, proactive monitoring, and on-demand provisioning. Virtual Ethernet services, leveraging SDN and NFV, allow enterprises to create and manage virtual networks dynamically, optimizing resource utilization and reducing operational costs. Unique selling propositions revolve around guaranteed Quality of Service (QoS), low latency, high reliability (often with SLAs of 99.999%), and robust security features. Technological advancements are also focused on simplifying network deployment and management through intuitive portal-based interfaces and API integrations.
Key Drivers, Barriers & Challenges in Ethernet Network Services for Enterprise Businesses
Key Drivers: The Ethernet Network Services for Enterprise Businesses market is primarily propelled by the escalating need for high-speed, reliable, and scalable connectivity to support digital transformation initiatives. The pervasive adoption of cloud computing, big data analytics, and IoT devices necessitates robust network infrastructure capable of handling massive data volumes and low-latency applications. Furthermore, the growing demand for enhanced cybersecurity measures and the increasing prevalence of remote work environments are driving enterprises to invest in secure and resilient Ethernet solutions. Government initiatives promoting digital economies and smart city projects also act as significant catalysts.
Barriers & Challenges: Despite robust growth, the market faces several challenges. The significant capital investment required for deploying and upgrading Ethernet infrastructure can be a barrier, particularly for small and medium-sized enterprises (SMEs). The complexity of integrating new Ethernet technologies with existing legacy systems can also pose implementation hurdles. Intense competition among service providers, leading to pricing pressures, is another significant challenge. Furthermore, ensuring consistent service quality and adherence to stringent Service Level Agreements (SLAs) across diverse geographical locations and network complexities requires continuous investment in network management and operational efficiency. Supply chain disruptions impacting hardware availability and escalating operational costs can also present challenges.
Emerging Opportunities in Ethernet Network Services for Enterprise Businesses
Emerging opportunities in the Ethernet Network Services for Enterprise Businesses sector are abundant, driven by the relentless pace of technological advancement and evolving enterprise needs. The expansion of edge computing presents a significant opportunity, requiring low-latency Ethernet connectivity at distributed locations to process data closer to its source. The increasing adoption of AI and machine learning workloads within enterprises will demand higher bandwidth and specialized Ethernet configurations to support massive datasets and complex computations. The growing trend of hybrid and multi-cloud strategies further fuels the need for seamless, high-performance Ethernet interconnectivity between on-premises infrastructure and various cloud environments. Untapped markets in developing economies, where digital transformation is gaining momentum, offer substantial growth potential for service providers.
Growth Accelerators in the Ethernet Network Services for Enterprise Businesses Industry
Several key catalysts are accelerating long-term growth in the Ethernet Network Services for Enterprise Businesses industry. Technological breakthroughs, such as the development and widespread deployment of higher-speed Ethernet standards (e.g., 400GbE and beyond), are continuously expanding the capabilities and applications of Ethernet. Strategic partnerships between network providers, cloud hyperscalers, and technology vendors are crucial for developing integrated solutions that address complex enterprise requirements. Market expansion strategies, including the offering of value-added services like managed security, SD-WAN integration, and advanced analytics over Ethernet networks, are broadening the appeal and revenue streams. The increasing focus on sustainability and energy-efficient network solutions is also becoming a growth accelerator as enterprises prioritize environmentally conscious infrastructure.
Key Players Shaping the Ethernet Network Services for Enterprise Businesses Market
- NTT
- Verizon
- AT&T
- Tata Communications
- Orange
- BT
- Vodafone
- Lumen
- Masergy (Comcast)
- Telefónica
- Colt Technology
- GTT
- Telia Company
- Deutsche Telekom
- Telstra
- Singtel
- PCCW Global
- RIEDEL Networks
- China Telecom
- China Unicom
- China Mobile
- KDDI
- PLDT
- DIL Technology
- Ooredoo
- Swisscom
Notable Milestones in Ethernet Network Services for Enterprise Businesses Sector
- 2019: Increased adoption of 100GbE for data center interconnectivity and backbone networks.
- 2020: Significant surge in demand for managed Ethernet services to support remote workforces and cloud migration.
- 2021: Expansion of Software-Defined Networking (SDN) capabilities within enterprise Ethernet offerings, enabling greater network flexibility.
- 2022: Growing interest and early deployments of 400GbE solutions for high-performance computing and AI applications.
- 2023: Increased M&A activity as major telecommunications companies acquire specialized network service providers to enhance their portfolios.
- 2024: Focus on network automation and AI-driven network management to improve efficiency and reduce operational costs.
- 2025 (Estimated): Projected widespread adoption of Network Function Virtualization (NFV) to enable dynamic service deployment and resource optimization.
In-Depth Ethernet Network Services for Enterprise Businesses Market Outlook
The Ethernet Network Services for Enterprise Businesses market is set for sustained and accelerated growth, driven by an confluence of technological advancements and strategic market shifts. Future growth accelerators will include the pervasive integration of AI into network operations for predictive maintenance and automated fault resolution, alongside the continued expansion of 5G infrastructure demanding high-capacity Ethernet backhaul. The evolution towards even higher bandwidth Ethernet standards, such as 800GbE and beyond, will unlock new possibilities for data-intensive industries. Strategic partnerships aimed at creating end-to-end, secure, and highly resilient network solutions will be paramount. The increasing emphasis on edge computing and the decentralization of IT resources will further amplify the need for agile and distributed Ethernet connectivity. Overall, the market outlook is exceptionally positive, presenting significant strategic opportunities for innovation, expansion, and value creation in the global enterprise connectivity landscape.
Ethernet Network Services for Enterprise Businesses Segmentation
-
1. Application
- 1.1. BFSI
- 1.2. Retail and Ecommerce
- 1.3. IT and Telecom
- 1.4. Manufacturing
- 1.5. Government
- 1.6. Education
- 1.7. Healthcare
- 1.8. Media and Entertainment
- 1.9. Others
-
2. Types
- 2.1. Ethernet LAN
- 2.2. Ethernet WAN
Ethernet Network Services for Enterprise Businesses Segmentation By Geography
-
1. North America
- 1.1. United States
- 1.2. Canada
- 1.3. Mexico
-
2. South America
- 2.1. Brazil
- 2.2. Argentina
- 2.3. Rest of South America
-
3. Europe
- 3.1. United Kingdom
- 3.2. Germany
- 3.3. France
- 3.4. Italy
- 3.5. Spain
- 3.6. Russia
- 3.7. Benelux
- 3.8. Nordics
- 3.9. Rest of Europe
-
4. Middle East & Africa
- 4.1. Turkey
- 4.2. Israel
- 4.3. GCC
- 4.4. North Africa
- 4.5. South Africa
- 4.6. Rest of Middle East & Africa
-
5. Asia Pacific
- 5.1. China
- 5.2. India
- 5.3. Japan
- 5.4. South Korea
- 5.5. ASEAN
- 5.6. Oceania
- 5.7. Rest of Asia Pacific
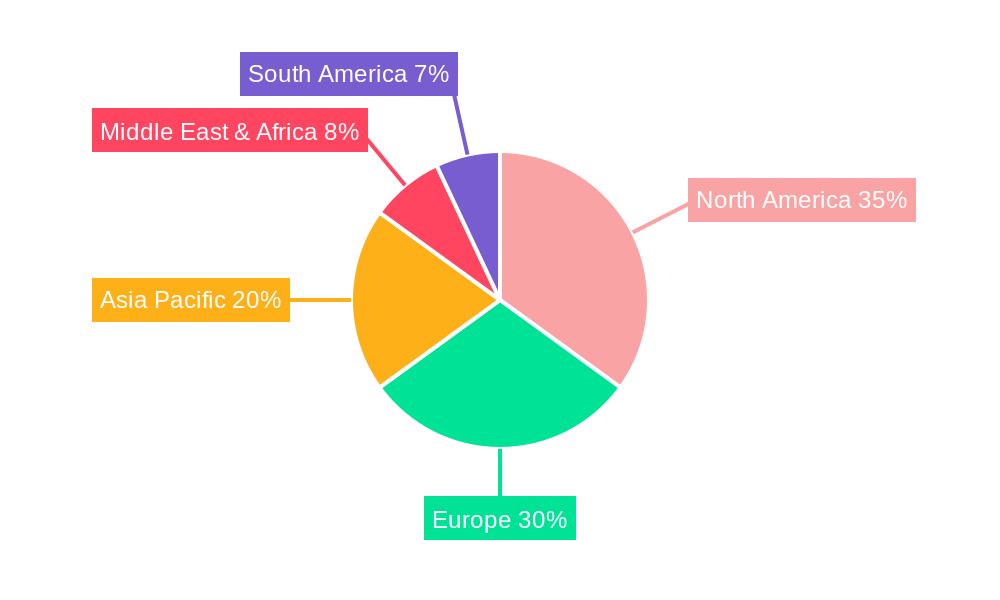
Ethernet Network Services for Enterprise Businesses Regional Market Share
Geographic Coverage of Ethernet Network Services for Enterprise Businesses
Ethernet Network Services for Enterprise Businesses REPORT HIGHLIGHTS
| Aspects | Details |
|---|---|
| Study Period | 2020-2034 |
| Base Year | 2025 |
| Estimated Year | 2026 |
| Forecast Period | 2026-2034 |
| Historical Period | 2020-2025 |
| Growth Rate | CAGR of 9.1% from 2020-2034 |
| Segmentation |
|
Table of Contents
- 1. Introduction
- 1.1. Research Scope
- 1.2. Market Segmentation
- 1.3. Research Objective
- 1.4. Definitions and Assumptions
- 2. Executive Summary
- 2.1. Market Snapshot
- 3. Market Dynamics
- 3.1. Market Drivers
- 3.2. Market Restrains
- 3.3. Market Trends
- 3.4. Market Opportunities
- 4. Market Factor Analysis
- 4.1. Porters Five Forces
- 4.1.1. Bargaining Power of Suppliers
- 4.1.2. Bargaining Power of Buyers
- 4.1.3. Threat of New Entrants
- 4.1.4. Threat of Substitutes
- 4.1.5. Competitive Rivalry
- 4.2. PESTEL analysis
- 4.3. BCG Analysis
- 4.3.1. Stars (High Growth, High Market Share)
- 4.3.2. Cash Cows (Low Growth, High Market Share)
- 4.3.3. Question Mark (High Growth, Low Market Share)
- 4.3.4. Dogs (Low Growth, Low Market Share)
- 4.4. Ansoff Matrix Analysis
- 4.5. Supply Chain Analysis
- 4.6. Regulatory Landscape
- 4.7. Current Market Potential and Opportunity Assessment (TAM–SAM–SOM Framework)
- 4.8. VDR Analyst Note
- 4.1. Porters Five Forces
- 5. Market Analysis, Insights and Forecast 2021-2033
- 5.1. Market Analysis, Insights and Forecast - by Application
- 5.1.1. BFSI
- 5.1.2. Retail and Ecommerce
- 5.1.3. IT and Telecom
- 5.1.4. Manufacturing
- 5.1.5. Government
- 5.1.6. Education
- 5.1.7. Healthcare
- 5.1.8. Media and Entertainment
- 5.1.9. Others
- 5.2. Market Analysis, Insights and Forecast - by Types
- 5.2.1. Ethernet LAN
- 5.2.2. Ethernet WAN
- 5.3. Market Analysis, Insights and Forecast - by Region
- 5.3.1. North America
- 5.3.2. South America
- 5.3.3. Europe
- 5.3.4. Middle East & Africa
- 5.3.5. Asia Pacific
- 5.1. Market Analysis, Insights and Forecast - by Application
- 6. Global Ethernet Network Services for Enterprise Businesses Analysis, Insights and Forecast, 2021-2033
- 6.1. Market Analysis, Insights and Forecast - by Application
- 6.1.1. BFSI
- 6.1.2. Retail and Ecommerce
- 6.1.3. IT and Telecom
- 6.1.4. Manufacturing
- 6.1.5. Government
- 6.1.6. Education
- 6.1.7. Healthcare
- 6.1.8. Media and Entertainment
- 6.1.9. Others
- 6.2. Market Analysis, Insights and Forecast - by Types
- 6.2.1. Ethernet LAN
- 6.2.2. Ethernet WAN
- 6.1. Market Analysis, Insights and Forecast - by Application
- 7. North America Ethernet Network Services for Enterprise Businesses Analysis, Insights and Forecast, 2021-2033
- 7.1. Market Analysis, Insights and Forecast - by Application
- 7.1.1. BFSI
- 7.1.2. Retail and Ecommerce
- 7.1.3. IT and Telecom
- 7.1.4. Manufacturing
- 7.1.5. Government
- 7.1.6. Education
- 7.1.7. Healthcare
- 7.1.8. Media and Entertainment
- 7.1.9. Others
- 7.2. Market Analysis, Insights and Forecast - by Types
- 7.2.1. Ethernet LAN
- 7.2.2. Ethernet WAN
- 7.1. Market Analysis, Insights and Forecast - by Application
- 8. South America Ethernet Network Services for Enterprise Businesses Analysis, Insights and Forecast, 2021-2033
- 8.1. Market Analysis, Insights and Forecast - by Application
- 8.1.1. BFSI
- 8.1.2. Retail and Ecommerce
- 8.1.3. IT and Telecom
- 8.1.4. Manufacturing
- 8.1.5. Government
- 8.1.6. Education
- 8.1.7. Healthcare
- 8.1.8. Media and Entertainment
- 8.1.9. Others
- 8.2. Market Analysis, Insights and Forecast - by Types
- 8.2.1. Ethernet LAN
- 8.2.2. Ethernet WAN
- 8.1. Market Analysis, Insights and Forecast - by Application
- 9. Europe Ethernet Network Services for Enterprise Businesses Analysis, Insights and Forecast, 2021-2033
- 9.1. Market Analysis, Insights and Forecast - by Application
- 9.1.1. BFSI
- 9.1.2. Retail and Ecommerce
- 9.1.3. IT and Telecom
- 9.1.4. Manufacturing
- 9.1.5. Government
- 9.1.6. Education
- 9.1.7. Healthcare
- 9.1.8. Media and Entertainment
- 9.1.9. Others
- 9.2. Market Analysis, Insights and Forecast - by Types
- 9.2.1. Ethernet LAN
- 9.2.2. Ethernet WAN
- 9.1. Market Analysis, Insights and Forecast - by Application
- 10. Middle East & Africa Ethernet Network Services for Enterprise Businesses Analysis, Insights and Forecast, 2021-2033
- 10.1. Market Analysis, Insights and Forecast - by Application
- 10.1.1. BFSI
- 10.1.2. Retail and Ecommerce
- 10.1.3. IT and Telecom
- 10.1.4. Manufacturing
- 10.1.5. Government
- 10.1.6. Education
- 10.1.7. Healthcare
- 10.1.8. Media and Entertainment
- 10.1.9. Others
- 10.2. Market Analysis, Insights and Forecast - by Types
- 10.2.1. Ethernet LAN
- 10.2.2. Ethernet WAN
- 10.1. Market Analysis, Insights and Forecast - by Application
- 11. Asia Pacific Ethernet Network Services for Enterprise Businesses Analysis, Insights and Forecast, 2021-2033
- 11.1. Market Analysis, Insights and Forecast - by Application
- 11.1.1. BFSI
- 11.1.2. Retail and Ecommerce
- 11.1.3. IT and Telecom
- 11.1.4. Manufacturing
- 11.1.5. Government
- 11.1.6. Education
- 11.1.7. Healthcare
- 11.1.8. Media and Entertainment
- 11.1.9. Others
- 11.2. Market Analysis, Insights and Forecast - by Types
- 11.2.1. Ethernet LAN
- 11.2.2. Ethernet WAN
- 11.1. Market Analysis, Insights and Forecast - by Application
- 12. Competitive Analysis
- 12.1. Company Profiles
- 12.1.1 NTT
- 12.1.1.1. Company Overview
- 12.1.1.2. Products
- 12.1.1.3. Company Financials
- 12.1.1.4. SWOT Analysis
- 12.1.2 Verizon
- 12.1.2.1. Company Overview
- 12.1.2.2. Products
- 12.1.2.3. Company Financials
- 12.1.2.4. SWOT Analysis
- 12.1.3 AT&T
- 12.1.3.1. Company Overview
- 12.1.3.2. Products
- 12.1.3.3. Company Financials
- 12.1.3.4. SWOT Analysis
- 12.1.4 Tata Communications
- 12.1.4.1. Company Overview
- 12.1.4.2. Products
- 12.1.4.3. Company Financials
- 12.1.4.4. SWOT Analysis
- 12.1.5 Orange
- 12.1.5.1. Company Overview
- 12.1.5.2. Products
- 12.1.5.3. Company Financials
- 12.1.5.4. SWOT Analysis
- 12.1.6 BT
- 12.1.6.1. Company Overview
- 12.1.6.2. Products
- 12.1.6.3. Company Financials
- 12.1.6.4. SWOT Analysis
- 12.1.7 Vodafone
- 12.1.7.1. Company Overview
- 12.1.7.2. Products
- 12.1.7.3. Company Financials
- 12.1.7.4. SWOT Analysis
- 12.1.8 Lumen
- 12.1.8.1. Company Overview
- 12.1.8.2. Products
- 12.1.8.3. Company Financials
- 12.1.8.4. SWOT Analysis
- 12.1.9 Masergy (Comcast)
- 12.1.9.1. Company Overview
- 12.1.9.2. Products
- 12.1.9.3. Company Financials
- 12.1.9.4. SWOT Analysis
- 12.1.10 Telefónica
- 12.1.10.1. Company Overview
- 12.1.10.2. Products
- 12.1.10.3. Company Financials
- 12.1.10.4. SWOT Analysis
- 12.1.11 Colt Technology
- 12.1.11.1. Company Overview
- 12.1.11.2. Products
- 12.1.11.3. Company Financials
- 12.1.11.4. SWOT Analysis
- 12.1.12 GTT
- 12.1.12.1. Company Overview
- 12.1.12.2. Products
- 12.1.12.3. Company Financials
- 12.1.12.4. SWOT Analysis
- 12.1.13 Telia Company
- 12.1.13.1. Company Overview
- 12.1.13.2. Products
- 12.1.13.3. Company Financials
- 12.1.13.4. SWOT Analysis
- 12.1.14 Deutsche Telekom
- 12.1.14.1. Company Overview
- 12.1.14.2. Products
- 12.1.14.3. Company Financials
- 12.1.14.4. SWOT Analysis
- 12.1.15 Telstra
- 12.1.15.1. Company Overview
- 12.1.15.2. Products
- 12.1.15.3. Company Financials
- 12.1.15.4. SWOT Analysis
- 12.1.16 Singtel
- 12.1.16.1. Company Overview
- 12.1.16.2. Products
- 12.1.16.3. Company Financials
- 12.1.16.4. SWOT Analysis
- 12.1.17 PCCW Global
- 12.1.17.1. Company Overview
- 12.1.17.2. Products
- 12.1.17.3. Company Financials
- 12.1.17.4. SWOT Analysis
- 12.1.18 RIEDEL Networks
- 12.1.18.1. Company Overview
- 12.1.18.2. Products
- 12.1.18.3. Company Financials
- 12.1.18.4. SWOT Analysis
- 12.1.19 China Telecom
- 12.1.19.1. Company Overview
- 12.1.19.2. Products
- 12.1.19.3. Company Financials
- 12.1.19.4. SWOT Analysis
- 12.1.20 China Unicom
- 12.1.20.1. Company Overview
- 12.1.20.2. Products
- 12.1.20.3. Company Financials
- 12.1.20.4. SWOT Analysis
- 12.1.21 China Mobile
- 12.1.21.1. Company Overview
- 12.1.21.2. Products
- 12.1.21.3. Company Financials
- 12.1.21.4. SWOT Analysis
- 12.1.22 KDDI
- 12.1.22.1. Company Overview
- 12.1.22.2. Products
- 12.1.22.3. Company Financials
- 12.1.22.4. SWOT Analysis
- 12.1.23 PLDT
- 12.1.23.1. Company Overview
- 12.1.23.2. Products
- 12.1.23.3. Company Financials
- 12.1.23.4. SWOT Analysis
- 12.1.24 DIL Technology
- 12.1.24.1. Company Overview
- 12.1.24.2. Products
- 12.1.24.3. Company Financials
- 12.1.24.4. SWOT Analysis
- 12.1.25 Ooredoo
- 12.1.25.1. Company Overview
- 12.1.25.2. Products
- 12.1.25.3. Company Financials
- 12.1.25.4. SWOT Analysis
- 12.1.26 Swisscom
- 12.1.26.1. Company Overview
- 12.1.26.2. Products
- 12.1.26.3. Company Financials
- 12.1.26.4. SWOT Analysis
- 12.1.1 NTT
- 12.2. Market Entropy
- 12.2.1 Company's Key Areas Served
- 12.2.2 Recent Developments
- 12.3. Company Market Share Analysis 2025
- 12.3.1 Top 5 Companies Market Share Analysis
- 12.3.2 Top 3 Companies Market Share Analysis
- 12.4. List of Potential Customers
- 13. Research Methodology
List of Figures
- Figure 1: Global Ethernet Network Services for Enterprise Businesses Revenue Breakdown (billion, %) by Region 2025 & 2033
- Figure 2: North America Ethernet Network Services for Enterprise Businesses Revenue (billion), by Application 2025 & 2033
- Figure 3: North America Ethernet Network Services for Enterprise Businesses Revenue Share (%), by Application 2025 & 2033
- Figure 4: North America Ethernet Network Services for Enterprise Businesses Revenue (billion), by Types 2025 & 2033
- Figure 5: North America Ethernet Network Services for Enterprise Businesses Revenue Share (%), by Types 2025 & 2033
- Figure 6: North America Ethernet Network Services for Enterprise Businesses Revenue (billion), by Country 2025 & 2033
- Figure 7: North America Ethernet Network Services for Enterprise Businesses Revenue Share (%), by Country 2025 & 2033
- Figure 8: South America Ethernet Network Services for Enterprise Businesses Revenue (billion), by Application 2025 & 2033
- Figure 9: South America Ethernet Network Services for Enterprise Businesses Revenue Share (%), by Application 2025 & 2033
- Figure 10: South America Ethernet Network Services for Enterprise Businesses Revenue (billion), by Types 2025 & 2033
- Figure 11: South America Ethernet Network Services for Enterprise Businesses Revenue Share (%), by Types 2025 & 2033
- Figure 12: South America Ethernet Network Services for Enterprise Businesses Revenue (billion), by Country 2025 & 2033
- Figure 13: South America Ethernet Network Services for Enterprise Businesses Revenue Share (%), by Country 2025 & 2033
- Figure 14: Europe Ethernet Network Services for Enterprise Businesses Revenue (billion), by Application 2025 & 2033
- Figure 15: Europe Ethernet Network Services for Enterprise Businesses Revenue Share (%), by Application 2025 & 2033
- Figure 16: Europe Ethernet Network Services for Enterprise Businesses Revenue (billion), by Types 2025 & 2033
- Figure 17: Europe Ethernet Network Services for Enterprise Businesses Revenue Share (%), by Types 2025 & 2033
- Figure 18: Europe Ethernet Network Services for Enterprise Businesses Revenue (billion), by Country 2025 & 2033
- Figure 19: Europe Ethernet Network Services for Enterprise Businesses Revenue Share (%), by Country 2025 & 2033
- Figure 20: Middle East & Africa Ethernet Network Services for Enterprise Businesses Revenue (billion), by Application 2025 & 2033
- Figure 21: Middle East & Africa Ethernet Network Services for Enterprise Businesses Revenue Share (%), by Application 2025 & 2033
- Figure 22: Middle East & Africa Ethernet Network Services for Enterprise Businesses Revenue (billion), by Types 2025 & 2033
- Figure 23: Middle East & Africa Ethernet Network Services for Enterprise Businesses Revenue Share (%), by Types 2025 & 2033
- Figure 24: Middle East & Africa Ethernet Network Services for Enterprise Businesses Revenue (billion), by Country 2025 & 2033
- Figure 25: Middle East & Africa Ethernet Network Services for Enterprise Businesses Revenue Share (%), by Country 2025 & 2033
- Figure 26: Asia Pacific Ethernet Network Services for Enterprise Businesses Revenue (billion), by Application 2025 & 2033
- Figure 27: Asia Pacific Ethernet Network Services for Enterprise Businesses Revenue Share (%), by Application 2025 & 2033
- Figure 28: Asia Pacific Ethernet Network Services for Enterprise Businesses Revenue (billion), by Types 2025 & 2033
- Figure 29: Asia Pacific Ethernet Network Services for Enterprise Businesses Revenue Share (%), by Types 2025 & 2033
- Figure 30: Asia Pacific Ethernet Network Services for Enterprise Businesses Revenue (billion), by Country 2025 & 2033
- Figure 31: Asia Pacific Ethernet Network Services for Enterprise Businesses Revenue Share (%), by Country 2025 & 2033
List of Tables
- Table 1: Global Ethernet Network Services for Enterprise Businesses Revenue billion Forecast, by Application 2020 & 2033
- Table 2: Global Ethernet Network Services for Enterprise Businesses Revenue billion Forecast, by Types 2020 & 2033
- Table 3: Global Ethernet Network Services for Enterprise Businesses Revenue billion Forecast, by Region 2020 & 2033
- Table 4: Global Ethernet Network Services for Enterprise Businesses Revenue billion Forecast, by Application 2020 & 2033
- Table 5: Global Ethernet Network Services for Enterprise Businesses Revenue billion Forecast, by Types 2020 & 2033
- Table 6: Global Ethernet Network Services for Enterprise Businesses Revenue billion Forecast, by Country 2020 & 2033
- Table 7: United States Ethernet Network Services for Enterprise Businesses Revenue (billion) Forecast, by Application 2020 & 2033
- Table 8: Canada Ethernet Network Services for Enterprise Businesses Revenue (billion) Forecast, by Application 2020 & 2033
- Table 9: Mexico Ethernet Network Services for Enterprise Businesses Revenue (billion) Forecast, by Application 2020 & 2033
- Table 10: Global Ethernet Network Services for Enterprise Businesses Revenue billion Forecast, by Application 2020 & 2033
- Table 11: Global Ethernet Network Services for Enterprise Businesses Revenue billion Forecast, by Types 2020 & 2033
- Table 12: Global Ethernet Network Services for Enterprise Businesses Revenue billion Forecast, by Country 2020 & 2033
- Table 13: Brazil Ethernet Network Services for Enterprise Businesses Revenue (billion) Forecast, by Application 2020 & 2033
- Table 14: Argentina Ethernet Network Services for Enterprise Businesses Revenue (billion) Forecast, by Application 2020 & 2033
- Table 15: Rest of South America Ethernet Network Services for Enterprise Businesses Revenue (billion) Forecast, by Application 2020 & 2033
- Table 16: Global Ethernet Network Services for Enterprise Businesses Revenue billion Forecast, by Application 2020 & 2033
- Table 17: Global Ethernet Network Services for Enterprise Businesses Revenue billion Forecast, by Types 2020 & 2033
- Table 18: Global Ethernet Network Services for Enterprise Businesses Revenue billion Forecast, by Country 2020 & 2033
- Table 19: United Kingdom Ethernet Network Services for Enterprise Businesses Revenue (billion) Forecast, by Application 2020 & 2033
- Table 20: Germany Ethernet Network Services for Enterprise Businesses Revenue (billion) Forecast, by Application 2020 & 2033
- Table 21: France Ethernet Network Services for Enterprise Businesses Revenue (billion) Forecast, by Application 2020 & 2033
- Table 22: Italy Ethernet Network Services for Enterprise Businesses Revenue (billion) Forecast, by Application 2020 & 2033
- Table 23: Spain Ethernet Network Services for Enterprise Businesses Revenue (billion) Forecast, by Application 2020 & 2033
- Table 24: Russia Ethernet Network Services for Enterprise Businesses Revenue (billion) Forecast, by Application 2020 & 2033
- Table 25: Benelux Ethernet Network Services for Enterprise Businesses Revenue (billion) Forecast, by Application 2020 & 2033
- Table 26: Nordics Ethernet Network Services for Enterprise Businesses Revenue (billion) Forecast, by Application 2020 & 2033
- Table 27: Rest of Europe Ethernet Network Services for Enterprise Businesses Revenue (billion) Forecast, by Application 2020 & 2033
- Table 28: Global Ethernet Network Services for Enterprise Businesses Revenue billion Forecast, by Application 2020 & 2033
- Table 29: Global Ethernet Network Services for Enterprise Businesses Revenue billion Forecast, by Types 2020 & 2033
- Table 30: Global Ethernet Network Services for Enterprise Businesses Revenue billion Forecast, by Country 2020 & 2033
- Table 31: Turkey Ethernet Network Services for Enterprise Businesses Revenue (billion) Forecast, by Application 2020 & 2033
- Table 32: Israel Ethernet Network Services for Enterprise Businesses Revenue (billion) Forecast, by Application 2020 & 2033
- Table 33: GCC Ethernet Network Services for Enterprise Businesses Revenue (billion) Forecast, by Application 2020 & 2033
- Table 34: North Africa Ethernet Network Services for Enterprise Businesses Revenue (billion) Forecast, by Application 2020 & 2033
- Table 35: South Africa Ethernet Network Services for Enterprise Businesses Revenue (billion) Forecast, by Application 2020 & 2033
- Table 36: Rest of Middle East & Africa Ethernet Network Services for Enterprise Businesses Revenue (billion) Forecast, by Application 2020 & 2033
- Table 37: Global Ethernet Network Services for Enterprise Businesses Revenue billion Forecast, by Application 2020 & 2033
- Table 38: Global Ethernet Network Services for Enterprise Businesses Revenue billion Forecast, by Types 2020 & 2033
- Table 39: Global Ethernet Network Services for Enterprise Businesses Revenue billion Forecast, by Country 2020 & 2033
- Table 40: China Ethernet Network Services for Enterprise Businesses Revenue (billion) Forecast, by Application 2020 & 2033
- Table 41: India Ethernet Network Services for Enterprise Businesses Revenue (billion) Forecast, by Application 2020 & 2033
- Table 42: Japan Ethernet Network Services for Enterprise Businesses Revenue (billion) Forecast, by Application 2020 & 2033
- Table 43: South Korea Ethernet Network Services for Enterprise Businesses Revenue (billion) Forecast, by Application 2020 & 2033
- Table 44: ASEAN Ethernet Network Services for Enterprise Businesses Revenue (billion) Forecast, by Application 2020 & 2033
- Table 45: Oceania Ethernet Network Services for Enterprise Businesses Revenue (billion) Forecast, by Application 2020 & 2033
- Table 46: Rest of Asia Pacific Ethernet Network Services for Enterprise Businesses Revenue (billion) Forecast, by Application 2020 & 2033
Frequently Asked Questions
1. What is the projected Compound Annual Growth Rate (CAGR) of the Ethernet Network Services for Enterprise Businesses?
The projected CAGR is approximately 9.1%.
2. Which companies are prominent players in the Ethernet Network Services for Enterprise Businesses?
Key companies in the market include NTT, Verizon, AT&T, Tata Communications, Orange, BT, Vodafone, Lumen, Masergy (Comcast), Telefónica, Colt Technology, GTT, Telia Company, Deutsche Telekom, Telstra, Singtel, PCCW Global, RIEDEL Networks, China Telecom, China Unicom, China Mobile, KDDI, PLDT, DIL Technology, Ooredoo, Swisscom.
3. What are the main segments of the Ethernet Network Services for Enterprise Businesses?
The market segments include Application, Types.
4. Can you provide details about the market size?
The market size is estimated to be USD 86.89 billion as of 2022.
5. What are some drivers contributing to market growth?
N/A
6. What are the notable trends driving market growth?
N/A
7. Are there any restraints impacting market growth?
N/A
8. Can you provide examples of recent developments in the market?
N/A
9. What pricing options are available for accessing the report?
Pricing options include single-user, multi-user, and enterprise licenses priced at USD 3950.00, USD 5925.00, and USD 7900.00 respectively.
10. Is the market size provided in terms of value or volume?
The market size is provided in terms of value, measured in billion.
11. Are there any specific market keywords associated with the report?
Yes, the market keyword associated with the report is "Ethernet Network Services for Enterprise Businesses," which aids in identifying and referencing the specific market segment covered.
12. How do I determine which pricing option suits my needs best?
The pricing options vary based on user requirements and access needs. Individual users may opt for single-user licenses, while businesses requiring broader access may choose multi-user or enterprise licenses for cost-effective access to the report.
13. Are there any additional resources or data provided in the Ethernet Network Services for Enterprise Businesses report?
While the report offers comprehensive insights, it's advisable to review the specific contents or supplementary materials provided to ascertain if additional resources or data are available.
14. How can I stay updated on further developments or reports in the Ethernet Network Services for Enterprise Businesses?
To stay informed about further developments, trends, and reports in the Ethernet Network Services for Enterprise Businesses, consider subscribing to industry newsletters, following relevant companies and organizations, or regularly checking reputable industry news sources and publications.
Methodology
Step 1 - Identification of Relevant Samples Size from Population Database


Step 2 - Approaches for Defining Global Market Size (Value, Volume* & Price*)

Note*: In applicable scenarios
Step 3 - Data Sources
Primary Research
- Web Analytics
- Survey Reports
- Research Institute
- Latest Research Reports
- Opinion Leaders
Secondary Research
- Annual Reports
- White Paper
- Latest Press Release
- Industry Association
- Paid Database
- Investor Presentations

Step 4 - Data Triangulation
Involves using different sources of information in order to increase the validity of a study
These sources are likely to be stakeholders in a program - participants, other researchers, program staff, other community members, and so on.
Then we put all data in single framework & apply various statistical tools to find out the dynamic on the market.
During the analysis stage, feedback from the stakeholder groups would be compared to determine areas of agreement as well as areas of divergence

