
Key Insights
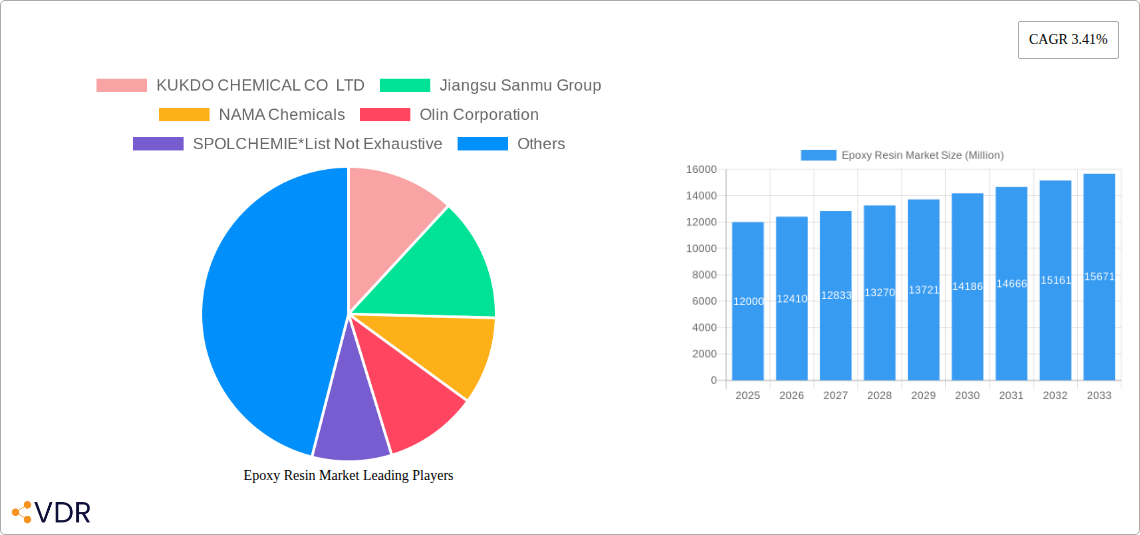
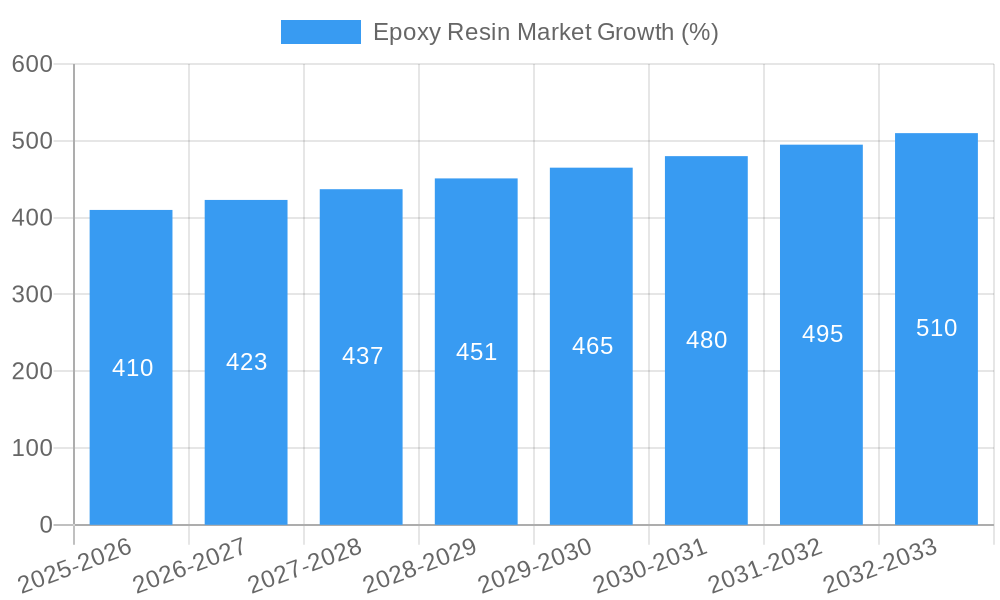
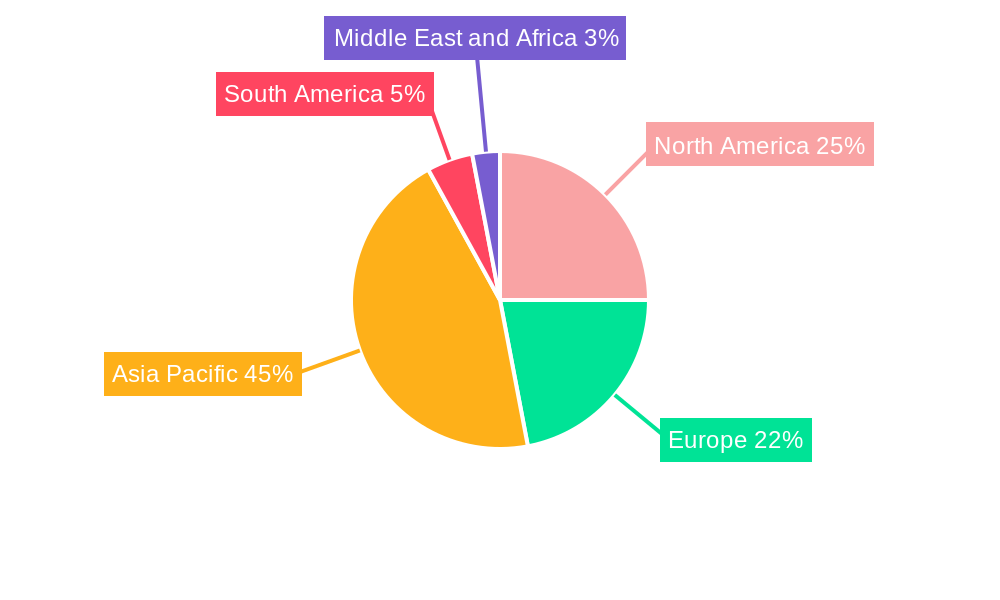
The global epoxy resin market, valued at approximately $12 billion in 2025, is projected to experience steady growth, driven by a Compound Annual Growth Rate (CAGR) of 3.41% from 2025 to 2033. This expansion is fueled by robust demand across diverse sectors, particularly in the construction, automotive, and electronics industries. The increasing adoption of epoxy resins in high-performance applications, such as wind turbine blades and advanced composites, is a significant growth catalyst. Furthermore, the inherent properties of epoxy resins—superior adhesion, chemical resistance, and excellent mechanical strength—make them ideal for a wide array of applications, further bolstering market growth. The market is segmented by raw material type, encompassing Bisphenol A and F-based resins, Novolac resins, and aliphatic resins, each offering unique properties catering to specific application needs. Geographically, Asia Pacific, led by China and India, is expected to dominate the market due to substantial infrastructure development and burgeoning manufacturing sectors. North America and Europe also represent significant markets, driven by strong demand from established industries. While increasing raw material costs and environmental concerns related to certain epoxy resin components present challenges, technological advancements focusing on sustainable and bio-based alternatives are expected to mitigate these restraints over the forecast period.
Growth in the epoxy resin market will be influenced by several factors. The ongoing expansion of the construction sector, particularly in developing economies, will drive demand for adhesives and sealants, a significant application segment for epoxy resins. Similarly, the electronics industry's reliance on epoxy resins for encapsulating and protecting sensitive components will contribute to market growth. However, the market will face challenges from fluctuations in raw material prices, particularly those derived from petroleum. The increasing focus on sustainable and eco-friendly materials will present both challenges and opportunities, driving innovation towards bio-based epoxy resins and less hazardous manufacturing processes. Competition among established players and new entrants will further shape market dynamics. The industry's continuous R&D efforts focusing on improved performance characteristics, enhanced durability, and wider application possibilities will ultimately fuel the market's steady and sustained growth over the forecast period.
Epoxy Resin Market: A Comprehensive Market Report (2019-2033)
This comprehensive report provides an in-depth analysis of the Epoxy Resin Market, encompassing market dynamics, growth trends, regional segmentation, product landscape, key players, and future outlook. The study period covers 2019-2033, with 2025 as the base and estimated year. The report leverages extensive market data and expert insights to offer a valuable resource for industry professionals, investors, and stakeholders. The market is segmented by raw material and application, providing a granular understanding of market performance across various segments.
Epoxy Resin Market Dynamics & Structure
The Epoxy Resin Market, valued at xx Million in 2024, is characterized by moderate concentration, with key players holding significant market share. Technological innovation, particularly in developing high-performance resins with enhanced properties like durability and heat resistance, is a key driver. Stringent environmental regulations regarding volatile organic compounds (VOCs) and the increasing demand for sustainable materials are shaping market dynamics. Competitive pressures are intense, driven by the availability of substitute materials like polyurethane and acrylics. The market exhibits growth in end-user demographics across diverse sectors, including construction, automotive, and electronics. Significant M&A activity, as seen in recent acquisitions, points to consolidation within the industry.
- Market Concentration: Moderately concentrated, with top 5 players holding approximately xx% market share in 2024.
- Technological Innovation: Focus on bio-based epoxy resins and enhanced performance characteristics.
- Regulatory Landscape: Stringent environmental regulations drive demand for low-VOC options.
- Competitive Substitutes: Polyurethane, acrylics, and other polymer-based materials present competitive pressure.
- End-User Demographics: Strong demand from construction, automotive, and electronics sectors.
- M&A Activity: Significant deals in recent years indicate industry consolidation (e.g., Westlake Chemical's acquisition of Hexion's epoxy business).
Epoxy Resin Market Growth Trends & Insights
The Epoxy Resin Market exhibits a steady growth trajectory, projected to reach xx Million by 2033, reflecting a CAGR of xx% during the forecast period (2025-2033). Adoption rates are increasing across various applications, driven by the material's versatility and superior performance characteristics. Technological advancements, such as the development of high-performance epoxy resins tailored for specific applications, are fueling market growth. Consumer behavior shifts towards eco-friendly and sustainable materials are influencing product development.
- Market Size Evolution: Steady growth from xx Million in 2019 to xx Million in 2024, with significant expansion projected till 2033.
- Adoption Rates: Increasing adoption in high-growth sectors such as renewable energy (wind turbines) and electric vehicles.
- Technological Disruptions: Development of bio-based epoxy resins and nano-enhanced formulations.
- Consumer Behavior: Growing preference for sustainable and environmentally friendly materials.
Dominant Regions, Countries, or Segments in Epoxy Resin Market
The Asia Pacific region currently dominates the Epoxy Resin Market, fueled by robust infrastructure development and the booming automotive and construction sectors in countries like China and India. Within raw materials, DGBEA (Bisphenol A and ECH) holds the largest market share, driven by its cost-effectiveness and wide applicability. In terms of applications, the paints and coatings segment is the dominant application area.
- Dominant Region: Asia Pacific, driven by strong economic growth and infrastructure development.
- Leading Country: China, benefiting from significant industrial expansion and government initiatives.
- Dominant Raw Material: DGBEA (Bisphenol A and ECH), owing to its cost-effectiveness and versatility.
- Leading Application: Paints and Coatings, due to the widespread use of epoxy resins in various coating applications.
- Growth Potential: Significant growth potential lies in emerging markets and specialized applications (e.g., wind turbines, composites).
Epoxy Resin Market Product Landscape
The Epoxy Resin Market offers a diverse product landscape, encompassing various types of resins tailored for specific applications. Product innovation focuses on enhancing properties such as durability, heat resistance, and chemical resistance. Recent advancements include the development of bio-based epoxy resins, addressing sustainability concerns. Unique selling propositions often revolve around superior performance characteristics, ease of application, and environmental friendliness.
Key Drivers, Barriers & Challenges in Epoxy Resin Market
Key Drivers:
- Growing demand from the construction and automotive industries.
- Increasing adoption in renewable energy applications (wind turbines).
- Technological advancements in resin formulations and applications.
Key Challenges:
- Fluctuations in raw material prices (e.g., Bisphenol A).
- Stringent environmental regulations and VOC limits.
- Intense competition from substitute materials.
- Supply chain disruptions affecting raw material availability.
Emerging Opportunities in Epoxy Resin Market
Emerging opportunities include penetration into untapped markets (e.g., developing economies) and the development of specialized applications in sectors such as aerospace and 3D printing. Consumer preference for sustainable and eco-friendly products presents an opportunity for bio-based epoxy resins. Innovative applications, such as self-healing materials and advanced composites, hold substantial promise.
Growth Accelerators in the Epoxy Resin Market Industry
Long-term growth will be driven by technological breakthroughs in resin formulations, strategic collaborations to access new markets, and expanding into high-growth application areas like electric vehicles and renewable energy infrastructure. Strategic investments in research and development, coupled with expansion into new geographical regions, will accelerate market growth.
Key Players Shaping the Epoxy Resin Market Market
- KUKDO CHEMICAL CO LTD
- Jiangsu Sanmu Group
- NAMA Chemicals
- Olin Corporation
- SPOLCHEMIE
- Chang Chun Group
- 3M
- Kemipex
- BASF SE
- Huntsman International LLC
- DuPont
- Aditya Birla Chemicals
- Daicel Corporation
- Hexion
- Sika AG
- Covestro AG
- Atul Ltd
- NAN YA PLASTICS CORPORATION
Notable Milestones in Epoxy Resin Market Sector
- February 2022: Westlake Chemical Corporation acquired Hexion Holdings Corporation's epoxy-based coatings and composite businesses for approximately USD 1.2 billion.
- March 2022: Aditya Birla Chemicals announced plans to double its epoxy manufacturing capacity and expand overseas operations.
In-Depth Epoxy Resin Market Market Outlook
The Epoxy Resin Market is poised for robust growth in the coming years, driven by several factors, including technological advancements, sustainable material demand, and expansion into high-growth application areas. Strategic partnerships and investments in research and development will further accelerate market growth. The market presents significant opportunities for companies to capitalize on emerging trends and establish a strong market position.
Epoxy Resin Market Segmentation
-
1. Raw Material
- 1.1. DGBEA (Bisphenol A and ECH)
- 1.2. DGBEF (Bisphenol F and ECH)
- 1.3. Novolac (Formaldehyde and Phenols)
- 1.4. Aliphatic (Aliphatic Alcohols)
- 1.5. Glycidylamine (Aromatic Amines and ECH)
- 1.6. Other Raw Materials
-
2. Application
- 2.1. Paints and Coatings
- 2.2. Adhesives and Sealants
- 2.3. Composites
- 2.4. Electrical and Electronics
- 2.5. Marine
- 2.6. Wind Turbines
- 2.7. Other Applications
Epoxy Resin Market Segmentation By Geography
-
1. Asia Pacific
- 1.1. China
- 1.2. India
- 1.3. Japan
- 1.4. South Korea
- 1.5. Malaysia
- 1.6. Thailand
- 1.7. Indonesia
- 1.8. Vietnam
- 1.9. Rest of Asia Pacific
-
2. North America
- 2.1. United States
- 2.2. Canada
- 2.3. Mexico
-
3. Europe
- 3.1. Germany
- 3.2. United Kingdom
- 3.3. France
- 3.4. Italy
- 3.5. Spain
- 3.6. NORDIC Countries
- 3.7. Turkey
- 3.8. Russia
- 3.9. Rest of Europe
-
4. South America
- 4.1. Brazil
- 4.2. Argentina
- 4.3. Colombia
- 4.4. Rest of South America
- 5. Middle East
-
6. Saudi Arabia
- 6.1. Qatar
- 6.2. United Arab Emirates
- 6.3. Nigeria
- 6.4. Egypt
- 6.5. South Africa
- 6.6. Rest of Middle East
Epoxy Resin Market REPORT HIGHLIGHTS
| Aspects | Details |
|---|---|
| Study Period | 2019-2033 |
| Base Year | 2024 |
| Estimated Year | 2025 |
| Forecast Period | 2025-2033 |
| Historical Period | 2019-2024 |
| Growth Rate | CAGR of 3.41% from 2019-2033 |
| Segmentation |
|
Table of Contents
- 1. Introduction
- 1.1. Research Scope
- 1.2. Market Segmentation
- 1.3. Research Methodology
- 1.4. Definitions and Assumptions
- 2. Executive Summary
- 2.1. Introduction
- 3. Market Dynamics
- 3.1. Introduction
- 3.2. Market Drivers
- 3.2.1. Increasing Demand for Epoxy-based Composites from the Aerospace and Automotive Industries; Strong Growth in the Construction Industry; Rising Demand for Electrical and Electronic Devices
- 3.3. Market Restrains
- 3.3.1. Hazardous Impact of Epoxy Resins; Other Restraints
- 3.4. Market Trends
- 3.4.1. The Paints and Coatings Segment is Expected to Dominate the Market
- 4. Market Factor Analysis
- 4.1. Porters Five Forces
- 4.2. Supply/Value Chain
- 4.3. PESTEL analysis
- 4.4. Market Entropy
- 4.5. Patent/Trademark Analysis
- 5. Global Epoxy Resin Market Analysis, Insights and Forecast, 2019-2031
- 5.1. Market Analysis, Insights and Forecast - by Raw Material
- 5.1.1. DGBEA (Bisphenol A and ECH)
- 5.1.2. DGBEF (Bisphenol F and ECH)
- 5.1.3. Novolac (Formaldehyde and Phenols)
- 5.1.4. Aliphatic (Aliphatic Alcohols)
- 5.1.5. Glycidylamine (Aromatic Amines and ECH)
- 5.1.6. Other Raw Materials
- 5.2. Market Analysis, Insights and Forecast - by Application
- 5.2.1. Paints and Coatings
- 5.2.2. Adhesives and Sealants
- 5.2.3. Composites
- 5.2.4. Electrical and Electronics
- 5.2.5. Marine
- 5.2.6. Wind Turbines
- 5.2.7. Other Applications
- 5.3. Market Analysis, Insights and Forecast - by Region
- 5.3.1. Asia Pacific
- 5.3.2. North America
- 5.3.3. Europe
- 5.3.4. South America
- 5.3.5. Middle East
- 5.3.6. Saudi Arabia
- 5.1. Market Analysis, Insights and Forecast - by Raw Material
- 6. Asia Pacific Epoxy Resin Market Analysis, Insights and Forecast, 2019-2031
- 6.1. Market Analysis, Insights and Forecast - by Raw Material
- 6.1.1. DGBEA (Bisphenol A and ECH)
- 6.1.2. DGBEF (Bisphenol F and ECH)
- 6.1.3. Novolac (Formaldehyde and Phenols)
- 6.1.4. Aliphatic (Aliphatic Alcohols)
- 6.1.5. Glycidylamine (Aromatic Amines and ECH)
- 6.1.6. Other Raw Materials
- 6.2. Market Analysis, Insights and Forecast - by Application
- 6.2.1. Paints and Coatings
- 6.2.2. Adhesives and Sealants
- 6.2.3. Composites
- 6.2.4. Electrical and Electronics
- 6.2.5. Marine
- 6.2.6. Wind Turbines
- 6.2.7. Other Applications
- 6.1. Market Analysis, Insights and Forecast - by Raw Material
- 7. North America Epoxy Resin Market Analysis, Insights and Forecast, 2019-2031
- 7.1. Market Analysis, Insights and Forecast - by Raw Material
- 7.1.1. DGBEA (Bisphenol A and ECH)
- 7.1.2. DGBEF (Bisphenol F and ECH)
- 7.1.3. Novolac (Formaldehyde and Phenols)
- 7.1.4. Aliphatic (Aliphatic Alcohols)
- 7.1.5. Glycidylamine (Aromatic Amines and ECH)
- 7.1.6. Other Raw Materials
- 7.2. Market Analysis, Insights and Forecast - by Application
- 7.2.1. Paints and Coatings
- 7.2.2. Adhesives and Sealants
- 7.2.3. Composites
- 7.2.4. Electrical and Electronics
- 7.2.5. Marine
- 7.2.6. Wind Turbines
- 7.2.7. Other Applications
- 7.1. Market Analysis, Insights and Forecast - by Raw Material
- 8. Europe Epoxy Resin Market Analysis, Insights and Forecast, 2019-2031
- 8.1. Market Analysis, Insights and Forecast - by Raw Material
- 8.1.1. DGBEA (Bisphenol A and ECH)
- 8.1.2. DGBEF (Bisphenol F and ECH)
- 8.1.3. Novolac (Formaldehyde and Phenols)
- 8.1.4. Aliphatic (Aliphatic Alcohols)
- 8.1.5. Glycidylamine (Aromatic Amines and ECH)
- 8.1.6. Other Raw Materials
- 8.2. Market Analysis, Insights and Forecast - by Application
- 8.2.1. Paints and Coatings
- 8.2.2. Adhesives and Sealants
- 8.2.3. Composites
- 8.2.4. Electrical and Electronics
- 8.2.5. Marine
- 8.2.6. Wind Turbines
- 8.2.7. Other Applications
- 8.1. Market Analysis, Insights and Forecast - by Raw Material
- 9. South America Epoxy Resin Market Analysis, Insights and Forecast, 2019-2031
- 9.1. Market Analysis, Insights and Forecast - by Raw Material
- 9.1.1. DGBEA (Bisphenol A and ECH)
- 9.1.2. DGBEF (Bisphenol F and ECH)
- 9.1.3. Novolac (Formaldehyde and Phenols)
- 9.1.4. Aliphatic (Aliphatic Alcohols)
- 9.1.5. Glycidylamine (Aromatic Amines and ECH)
- 9.1.6. Other Raw Materials
- 9.2. Market Analysis, Insights and Forecast - by Application
- 9.2.1. Paints and Coatings
- 9.2.2. Adhesives and Sealants
- 9.2.3. Composites
- 9.2.4. Electrical and Electronics
- 9.2.5. Marine
- 9.2.6. Wind Turbines
- 9.2.7. Other Applications
- 9.1. Market Analysis, Insights and Forecast - by Raw Material
- 10. Middle East Epoxy Resin Market Analysis, Insights and Forecast, 2019-2031
- 10.1. Market Analysis, Insights and Forecast - by Raw Material
- 10.1.1. DGBEA (Bisphenol A and ECH)
- 10.1.2. DGBEF (Bisphenol F and ECH)
- 10.1.3. Novolac (Formaldehyde and Phenols)
- 10.1.4. Aliphatic (Aliphatic Alcohols)
- 10.1.5. Glycidylamine (Aromatic Amines and ECH)
- 10.1.6. Other Raw Materials
- 10.2. Market Analysis, Insights and Forecast - by Application
- 10.2.1. Paints and Coatings
- 10.2.2. Adhesives and Sealants
- 10.2.3. Composites
- 10.2.4. Electrical and Electronics
- 10.2.5. Marine
- 10.2.6. Wind Turbines
- 10.2.7. Other Applications
- 10.1. Market Analysis, Insights and Forecast - by Raw Material
- 11. Saudi Arabia Epoxy Resin Market Analysis, Insights and Forecast, 2019-2031
- 11.1. Market Analysis, Insights and Forecast - by Raw Material
- 11.1.1. DGBEA (Bisphenol A and ECH)
- 11.1.2. DGBEF (Bisphenol F and ECH)
- 11.1.3. Novolac (Formaldehyde and Phenols)
- 11.1.4. Aliphatic (Aliphatic Alcohols)
- 11.1.5. Glycidylamine (Aromatic Amines and ECH)
- 11.1.6. Other Raw Materials
- 11.2. Market Analysis, Insights and Forecast - by Application
- 11.2.1. Paints and Coatings
- 11.2.2. Adhesives and Sealants
- 11.2.3. Composites
- 11.2.4. Electrical and Electronics
- 11.2.5. Marine
- 11.2.6. Wind Turbines
- 11.2.7. Other Applications
- 11.1. Market Analysis, Insights and Forecast - by Raw Material
- 12. Asia Pacific Epoxy Resin Market Analysis, Insights and Forecast, 2019-2031
- 12.1. Market Analysis, Insights and Forecast - By Country/Sub-region
- 12.1.1 China
- 12.1.2 India
- 12.1.3 Japan
- 12.1.4 South Korea
- 12.1.5 Rest of Asia Pacific
- 13. North America Epoxy Resin Market Analysis, Insights and Forecast, 2019-2031
- 13.1. Market Analysis, Insights and Forecast - By Country/Sub-region
- 13.1.1 United States
- 13.1.2 Canada
- 13.1.3 Mexico
- 14. Europe Epoxy Resin Market Analysis, Insights and Forecast, 2019-2031
- 14.1. Market Analysis, Insights and Forecast - By Country/Sub-region
- 14.1.1 Germany
- 14.1.2 United Kingdom
- 14.1.3 Italy
- 14.1.4 France
- 14.1.5 Spain
- 14.1.6 Rest of Europe
- 15. South America Epoxy Resin Market Analysis, Insights and Forecast, 2019-2031
- 15.1. Market Analysis, Insights and Forecast - By Country/Sub-region
- 15.1.1 Brazil
- 15.1.2 Argentina
- 15.1.3 Rest of South America
- 16. Middle East and Africa Epoxy Resin Market Analysis, Insights and Forecast, 2019-2031
- 16.1. Market Analysis, Insights and Forecast - By Country/Sub-region
- 16.1.1 Saudi Arabia
- 16.1.2 South Africa
- 16.1.3 Rest of Middle East and Africa
- 17. Competitive Analysis
- 17.1. Global Market Share Analysis 2024
- 17.2. Company Profiles
- 17.2.1 KUKDO CHEMICAL CO LTD
- 17.2.1.1. Overview
- 17.2.1.2. Products
- 17.2.1.3. SWOT Analysis
- 17.2.1.4. Recent Developments
- 17.2.1.5. Financials (Based on Availability)
- 17.2.2 Jiangsu Sanmu Group
- 17.2.2.1. Overview
- 17.2.2.2. Products
- 17.2.2.3. SWOT Analysis
- 17.2.2.4. Recent Developments
- 17.2.2.5. Financials (Based on Availability)
- 17.2.3 NAMA Chemicals
- 17.2.3.1. Overview
- 17.2.3.2. Products
- 17.2.3.3. SWOT Analysis
- 17.2.3.4. Recent Developments
- 17.2.3.5. Financials (Based on Availability)
- 17.2.4 Olin Corporation
- 17.2.4.1. Overview
- 17.2.4.2. Products
- 17.2.4.3. SWOT Analysis
- 17.2.4.4. Recent Developments
- 17.2.4.5. Financials (Based on Availability)
- 17.2.5 SPOLCHEMIE*List Not Exhaustive
- 17.2.5.1. Overview
- 17.2.5.2. Products
- 17.2.5.3. SWOT Analysis
- 17.2.5.4. Recent Developments
- 17.2.5.5. Financials (Based on Availability)
- 17.2.6 Chang Chun Group
- 17.2.6.1. Overview
- 17.2.6.2. Products
- 17.2.6.3. SWOT Analysis
- 17.2.6.4. Recent Developments
- 17.2.6.5. Financials (Based on Availability)
- 17.2.7 3M
- 17.2.7.1. Overview
- 17.2.7.2. Products
- 17.2.7.3. SWOT Analysis
- 17.2.7.4. Recent Developments
- 17.2.7.5. Financials (Based on Availability)
- 17.2.8 Kemipex
- 17.2.8.1. Overview
- 17.2.8.2. Products
- 17.2.8.3. SWOT Analysis
- 17.2.8.4. Recent Developments
- 17.2.8.5. Financials (Based on Availability)
- 17.2.9 BASF SE
- 17.2.9.1. Overview
- 17.2.9.2. Products
- 17.2.9.3. SWOT Analysis
- 17.2.9.4. Recent Developments
- 17.2.9.5. Financials (Based on Availability)
- 17.2.10 Huntsman International LLC
- 17.2.10.1. Overview
- 17.2.10.2. Products
- 17.2.10.3. SWOT Analysis
- 17.2.10.4. Recent Developments
- 17.2.10.5. Financials (Based on Availability)
- 17.2.11 DuPont
- 17.2.11.1. Overview
- 17.2.11.2. Products
- 17.2.11.3. SWOT Analysis
- 17.2.11.4. Recent Developments
- 17.2.11.5. Financials (Based on Availability)
- 17.2.12 Aditya Birla Chemicals
- 17.2.12.1. Overview
- 17.2.12.2. Products
- 17.2.12.3. SWOT Analysis
- 17.2.12.4. Recent Developments
- 17.2.12.5. Financials (Based on Availability)
- 17.2.13 Daicel Corporation
- 17.2.13.1. Overview
- 17.2.13.2. Products
- 17.2.13.3. SWOT Analysis
- 17.2.13.4. Recent Developments
- 17.2.13.5. Financials (Based on Availability)
- 17.2.14 Hexion
- 17.2.14.1. Overview
- 17.2.14.2. Products
- 17.2.14.3. SWOT Analysis
- 17.2.14.4. Recent Developments
- 17.2.14.5. Financials (Based on Availability)
- 17.2.15 Sika AG
- 17.2.15.1. Overview
- 17.2.15.2. Products
- 17.2.15.3. SWOT Analysis
- 17.2.15.4. Recent Developments
- 17.2.15.5. Financials (Based on Availability)
- 17.2.16 Covestro AG
- 17.2.16.1. Overview
- 17.2.16.2. Products
- 17.2.16.3. SWOT Analysis
- 17.2.16.4. Recent Developments
- 17.2.16.5. Financials (Based on Availability)
- 17.2.17 Atul Ltd
- 17.2.17.1. Overview
- 17.2.17.2. Products
- 17.2.17.3. SWOT Analysis
- 17.2.17.4. Recent Developments
- 17.2.17.5. Financials (Based on Availability)
- 17.2.18 NAN YA PLASTICS CORPORATION
- 17.2.18.1. Overview
- 17.2.18.2. Products
- 17.2.18.3. SWOT Analysis
- 17.2.18.4. Recent Developments
- 17.2.18.5. Financials (Based on Availability)
- 17.2.1 KUKDO CHEMICAL CO LTD
List of Figures
- Figure 1: Global Epoxy Resin Market Revenue Breakdown (Million, %) by Region 2024 & 2032
- Figure 2: Global Epoxy Resin Market Volume Breakdown (Million, %) by Region 2024 & 2032
- Figure 3: Asia Pacific Epoxy Resin Market Revenue (Million), by Country 2024 & 2032
- Figure 4: Asia Pacific Epoxy Resin Market Volume (Million), by Country 2024 & 2032
- Figure 5: Asia Pacific Epoxy Resin Market Revenue Share (%), by Country 2024 & 2032
- Figure 6: Asia Pacific Epoxy Resin Market Volume Share (%), by Country 2024 & 2032
- Figure 7: North America Epoxy Resin Market Revenue (Million), by Country 2024 & 2032
- Figure 8: North America Epoxy Resin Market Volume (Million), by Country 2024 & 2032
- Figure 9: North America Epoxy Resin Market Revenue Share (%), by Country 2024 & 2032
- Figure 10: North America Epoxy Resin Market Volume Share (%), by Country 2024 & 2032
- Figure 11: Europe Epoxy Resin Market Revenue (Million), by Country 2024 & 2032
- Figure 12: Europe Epoxy Resin Market Volume (Million), by Country 2024 & 2032
- Figure 13: Europe Epoxy Resin Market Revenue Share (%), by Country 2024 & 2032
- Figure 14: Europe Epoxy Resin Market Volume Share (%), by Country 2024 & 2032
- Figure 15: South America Epoxy Resin Market Revenue (Million), by Country 2024 & 2032
- Figure 16: South America Epoxy Resin Market Volume (Million), by Country 2024 & 2032
- Figure 17: South America Epoxy Resin Market Revenue Share (%), by Country 2024 & 2032
- Figure 18: South America Epoxy Resin Market Volume Share (%), by Country 2024 & 2032
- Figure 19: Middle East and Africa Epoxy Resin Market Revenue (Million), by Country 2024 & 2032
- Figure 20: Middle East and Africa Epoxy Resin Market Volume (Million), by Country 2024 & 2032
- Figure 21: Middle East and Africa Epoxy Resin Market Revenue Share (%), by Country 2024 & 2032
- Figure 22: Middle East and Africa Epoxy Resin Market Volume Share (%), by Country 2024 & 2032
- Figure 23: Asia Pacific Epoxy Resin Market Revenue (Million), by Raw Material 2024 & 2032
- Figure 24: Asia Pacific Epoxy Resin Market Volume (Million), by Raw Material 2024 & 2032
- Figure 25: Asia Pacific Epoxy Resin Market Revenue Share (%), by Raw Material 2024 & 2032
- Figure 26: Asia Pacific Epoxy Resin Market Volume Share (%), by Raw Material 2024 & 2032
- Figure 27: Asia Pacific Epoxy Resin Market Revenue (Million), by Application 2024 & 2032
- Figure 28: Asia Pacific Epoxy Resin Market Volume (Million), by Application 2024 & 2032
- Figure 29: Asia Pacific Epoxy Resin Market Revenue Share (%), by Application 2024 & 2032
- Figure 30: Asia Pacific Epoxy Resin Market Volume Share (%), by Application 2024 & 2032
- Figure 31: Asia Pacific Epoxy Resin Market Revenue (Million), by Country 2024 & 2032
- Figure 32: Asia Pacific Epoxy Resin Market Volume (Million), by Country 2024 & 2032
- Figure 33: Asia Pacific Epoxy Resin Market Revenue Share (%), by Country 2024 & 2032
- Figure 34: Asia Pacific Epoxy Resin Market Volume Share (%), by Country 2024 & 2032
- Figure 35: North America Epoxy Resin Market Revenue (Million), by Raw Material 2024 & 2032
- Figure 36: North America Epoxy Resin Market Volume (Million), by Raw Material 2024 & 2032
- Figure 37: North America Epoxy Resin Market Revenue Share (%), by Raw Material 2024 & 2032
- Figure 38: North America Epoxy Resin Market Volume Share (%), by Raw Material 2024 & 2032
- Figure 39: North America Epoxy Resin Market Revenue (Million), by Application 2024 & 2032
- Figure 40: North America Epoxy Resin Market Volume (Million), by Application 2024 & 2032
- Figure 41: North America Epoxy Resin Market Revenue Share (%), by Application 2024 & 2032
- Figure 42: North America Epoxy Resin Market Volume Share (%), by Application 2024 & 2032
- Figure 43: North America Epoxy Resin Market Revenue (Million), by Country 2024 & 2032
- Figure 44: North America Epoxy Resin Market Volume (Million), by Country 2024 & 2032
- Figure 45: North America Epoxy Resin Market Revenue Share (%), by Country 2024 & 2032
- Figure 46: North America Epoxy Resin Market Volume Share (%), by Country 2024 & 2032
- Figure 47: Europe Epoxy Resin Market Revenue (Million), by Raw Material 2024 & 2032
- Figure 48: Europe Epoxy Resin Market Volume (Million), by Raw Material 2024 & 2032
- Figure 49: Europe Epoxy Resin Market Revenue Share (%), by Raw Material 2024 & 2032
- Figure 50: Europe Epoxy Resin Market Volume Share (%), by Raw Material 2024 & 2032
- Figure 51: Europe Epoxy Resin Market Revenue (Million), by Application 2024 & 2032
- Figure 52: Europe Epoxy Resin Market Volume (Million), by Application 2024 & 2032
- Figure 53: Europe Epoxy Resin Market Revenue Share (%), by Application 2024 & 2032
- Figure 54: Europe Epoxy Resin Market Volume Share (%), by Application 2024 & 2032
- Figure 55: Europe Epoxy Resin Market Revenue (Million), by Country 2024 & 2032
- Figure 56: Europe Epoxy Resin Market Volume (Million), by Country 2024 & 2032
- Figure 57: Europe Epoxy Resin Market Revenue Share (%), by Country 2024 & 2032
- Figure 58: Europe Epoxy Resin Market Volume Share (%), by Country 2024 & 2032
- Figure 59: South America Epoxy Resin Market Revenue (Million), by Raw Material 2024 & 2032
- Figure 60: South America Epoxy Resin Market Volume (Million), by Raw Material 2024 & 2032
- Figure 61: South America Epoxy Resin Market Revenue Share (%), by Raw Material 2024 & 2032
- Figure 62: South America Epoxy Resin Market Volume Share (%), by Raw Material 2024 & 2032
- Figure 63: South America Epoxy Resin Market Revenue (Million), by Application 2024 & 2032
- Figure 64: South America Epoxy Resin Market Volume (Million), by Application 2024 & 2032
- Figure 65: South America Epoxy Resin Market Revenue Share (%), by Application 2024 & 2032
- Figure 66: South America Epoxy Resin Market Volume Share (%), by Application 2024 & 2032
- Figure 67: South America Epoxy Resin Market Revenue (Million), by Country 2024 & 2032
- Figure 68: South America Epoxy Resin Market Volume (Million), by Country 2024 & 2032
- Figure 69: South America Epoxy Resin Market Revenue Share (%), by Country 2024 & 2032
- Figure 70: South America Epoxy Resin Market Volume Share (%), by Country 2024 & 2032
- Figure 71: Middle East Epoxy Resin Market Revenue (Million), by Raw Material 2024 & 2032
- Figure 72: Middle East Epoxy Resin Market Volume (Million), by Raw Material 2024 & 2032
- Figure 73: Middle East Epoxy Resin Market Revenue Share (%), by Raw Material 2024 & 2032
- Figure 74: Middle East Epoxy Resin Market Volume Share (%), by Raw Material 2024 & 2032
- Figure 75: Middle East Epoxy Resin Market Revenue (Million), by Application 2024 & 2032
- Figure 76: Middle East Epoxy Resin Market Volume (Million), by Application 2024 & 2032
- Figure 77: Middle East Epoxy Resin Market Revenue Share (%), by Application 2024 & 2032
- Figure 78: Middle East Epoxy Resin Market Volume Share (%), by Application 2024 & 2032
- Figure 79: Middle East Epoxy Resin Market Revenue (Million), by Country 2024 & 2032
- Figure 80: Middle East Epoxy Resin Market Volume (Million), by Country 2024 & 2032
- Figure 81: Middle East Epoxy Resin Market Revenue Share (%), by Country 2024 & 2032
- Figure 82: Middle East Epoxy Resin Market Volume Share (%), by Country 2024 & 2032
- Figure 83: Saudi Arabia Epoxy Resin Market Revenue (Million), by Raw Material 2024 & 2032
- Figure 84: Saudi Arabia Epoxy Resin Market Volume (Million), by Raw Material 2024 & 2032
- Figure 85: Saudi Arabia Epoxy Resin Market Revenue Share (%), by Raw Material 2024 & 2032
- Figure 86: Saudi Arabia Epoxy Resin Market Volume Share (%), by Raw Material 2024 & 2032
- Figure 87: Saudi Arabia Epoxy Resin Market Revenue (Million), by Application 2024 & 2032
- Figure 88: Saudi Arabia Epoxy Resin Market Volume (Million), by Application 2024 & 2032
- Figure 89: Saudi Arabia Epoxy Resin Market Revenue Share (%), by Application 2024 & 2032
- Figure 90: Saudi Arabia Epoxy Resin Market Volume Share (%), by Application 2024 & 2032
- Figure 91: Saudi Arabia Epoxy Resin Market Revenue (Million), by Country 2024 & 2032
- Figure 92: Saudi Arabia Epoxy Resin Market Volume (Million), by Country 2024 & 2032
- Figure 93: Saudi Arabia Epoxy Resin Market Revenue Share (%), by Country 2024 & 2032
- Figure 94: Saudi Arabia Epoxy Resin Market Volume Share (%), by Country 2024 & 2032
List of Tables
- Table 1: Global Epoxy Resin Market Revenue Million Forecast, by Region 2019 & 2032
- Table 2: Global Epoxy Resin Market Volume Million Forecast, by Region 2019 & 2032
- Table 3: Global Epoxy Resin Market Revenue Million Forecast, by Raw Material 2019 & 2032
- Table 4: Global Epoxy Resin Market Volume Million Forecast, by Raw Material 2019 & 2032
- Table 5: Global Epoxy Resin Market Revenue Million Forecast, by Application 2019 & 2032
- Table 6: Global Epoxy Resin Market Volume Million Forecast, by Application 2019 & 2032
- Table 7: Global Epoxy Resin Market Revenue Million Forecast, by Region 2019 & 2032
- Table 8: Global Epoxy Resin Market Volume Million Forecast, by Region 2019 & 2032
- Table 9: Global Epoxy Resin Market Revenue Million Forecast, by Country 2019 & 2032
- Table 10: Global Epoxy Resin Market Volume Million Forecast, by Country 2019 & 2032
- Table 11: China Epoxy Resin Market Revenue (Million) Forecast, by Application 2019 & 2032
- Table 12: China Epoxy Resin Market Volume (Million) Forecast, by Application 2019 & 2032
- Table 13: India Epoxy Resin Market Revenue (Million) Forecast, by Application 2019 & 2032
- Table 14: India Epoxy Resin Market Volume (Million) Forecast, by Application 2019 & 2032
- Table 15: Japan Epoxy Resin Market Revenue (Million) Forecast, by Application 2019 & 2032
- Table 16: Japan Epoxy Resin Market Volume (Million) Forecast, by Application 2019 & 2032
- Table 17: South Korea Epoxy Resin Market Revenue (Million) Forecast, by Application 2019 & 2032
- Table 18: South Korea Epoxy Resin Market Volume (Million) Forecast, by Application 2019 & 2032
- Table 19: Rest of Asia Pacific Epoxy Resin Market Revenue (Million) Forecast, by Application 2019 & 2032
- Table 20: Rest of Asia Pacific Epoxy Resin Market Volume (Million) Forecast, by Application 2019 & 2032
- Table 21: Global Epoxy Resin Market Revenue Million Forecast, by Country 2019 & 2032
- Table 22: Global Epoxy Resin Market Volume Million Forecast, by Country 2019 & 2032
- Table 23: United States Epoxy Resin Market Revenue (Million) Forecast, by Application 2019 & 2032
- Table 24: United States Epoxy Resin Market Volume (Million) Forecast, by Application 2019 & 2032
- Table 25: Canada Epoxy Resin Market Revenue (Million) Forecast, by Application 2019 & 2032
- Table 26: Canada Epoxy Resin Market Volume (Million) Forecast, by Application 2019 & 2032
- Table 27: Mexico Epoxy Resin Market Revenue (Million) Forecast, by Application 2019 & 2032
- Table 28: Mexico Epoxy Resin Market Volume (Million) Forecast, by Application 2019 & 2032
- Table 29: Global Epoxy Resin Market Revenue Million Forecast, by Country 2019 & 2032
- Table 30: Global Epoxy Resin Market Volume Million Forecast, by Country 2019 & 2032
- Table 31: Germany Epoxy Resin Market Revenue (Million) Forecast, by Application 2019 & 2032
- Table 32: Germany Epoxy Resin Market Volume (Million) Forecast, by Application 2019 & 2032
- Table 33: United Kingdom Epoxy Resin Market Revenue (Million) Forecast, by Application 2019 & 2032
- Table 34: United Kingdom Epoxy Resin Market Volume (Million) Forecast, by Application 2019 & 2032
- Table 35: Italy Epoxy Resin Market Revenue (Million) Forecast, by Application 2019 & 2032
- Table 36: Italy Epoxy Resin Market Volume (Million) Forecast, by Application 2019 & 2032
- Table 37: France Epoxy Resin Market Revenue (Million) Forecast, by Application 2019 & 2032
- Table 38: France Epoxy Resin Market Volume (Million) Forecast, by Application 2019 & 2032
- Table 39: Spain Epoxy Resin Market Revenue (Million) Forecast, by Application 2019 & 2032
- Table 40: Spain Epoxy Resin Market Volume (Million) Forecast, by Application 2019 & 2032
- Table 41: Rest of Europe Epoxy Resin Market Revenue (Million) Forecast, by Application 2019 & 2032
- Table 42: Rest of Europe Epoxy Resin Market Volume (Million) Forecast, by Application 2019 & 2032
- Table 43: Global Epoxy Resin Market Revenue Million Forecast, by Country 2019 & 2032
- Table 44: Global Epoxy Resin Market Volume Million Forecast, by Country 2019 & 2032
- Table 45: Brazil Epoxy Resin Market Revenue (Million) Forecast, by Application 2019 & 2032
- Table 46: Brazil Epoxy Resin Market Volume (Million) Forecast, by Application 2019 & 2032
- Table 47: Argentina Epoxy Resin Market Revenue (Million) Forecast, by Application 2019 & 2032
- Table 48: Argentina Epoxy Resin Market Volume (Million) Forecast, by Application 2019 & 2032
- Table 49: Rest of South America Epoxy Resin Market Revenue (Million) Forecast, by Application 2019 & 2032
- Table 50: Rest of South America Epoxy Resin Market Volume (Million) Forecast, by Application 2019 & 2032
- Table 51: Global Epoxy Resin Market Revenue Million Forecast, by Country 2019 & 2032
- Table 52: Global Epoxy Resin Market Volume Million Forecast, by Country 2019 & 2032
- Table 53: Saudi Arabia Epoxy Resin Market Revenue (Million) Forecast, by Application 2019 & 2032
- Table 54: Saudi Arabia Epoxy Resin Market Volume (Million) Forecast, by Application 2019 & 2032
- Table 55: South Africa Epoxy Resin Market Revenue (Million) Forecast, by Application 2019 & 2032
- Table 56: South Africa Epoxy Resin Market Volume (Million) Forecast, by Application 2019 & 2032
- Table 57: Rest of Middle East and Africa Epoxy Resin Market Revenue (Million) Forecast, by Application 2019 & 2032
- Table 58: Rest of Middle East and Africa Epoxy Resin Market Volume (Million) Forecast, by Application 2019 & 2032
- Table 59: Global Epoxy Resin Market Revenue Million Forecast, by Raw Material 2019 & 2032
- Table 60: Global Epoxy Resin Market Volume Million Forecast, by Raw Material 2019 & 2032
- Table 61: Global Epoxy Resin Market Revenue Million Forecast, by Application 2019 & 2032
- Table 62: Global Epoxy Resin Market Volume Million Forecast, by Application 2019 & 2032
- Table 63: Global Epoxy Resin Market Revenue Million Forecast, by Country 2019 & 2032
- Table 64: Global Epoxy Resin Market Volume Million Forecast, by Country 2019 & 2032
- Table 65: China Epoxy Resin Market Revenue (Million) Forecast, by Application 2019 & 2032
- Table 66: China Epoxy Resin Market Volume (Million) Forecast, by Application 2019 & 2032
- Table 67: India Epoxy Resin Market Revenue (Million) Forecast, by Application 2019 & 2032
- Table 68: India Epoxy Resin Market Volume (Million) Forecast, by Application 2019 & 2032
- Table 69: Japan Epoxy Resin Market Revenue (Million) Forecast, by Application 2019 & 2032
- Table 70: Japan Epoxy Resin Market Volume (Million) Forecast, by Application 2019 & 2032
- Table 71: South Korea Epoxy Resin Market Revenue (Million) Forecast, by Application 2019 & 2032
- Table 72: South Korea Epoxy Resin Market Volume (Million) Forecast, by Application 2019 & 2032
- Table 73: Malaysia Epoxy Resin Market Revenue (Million) Forecast, by Application 2019 & 2032
- Table 74: Malaysia Epoxy Resin Market Volume (Million) Forecast, by Application 2019 & 2032
- Table 75: Thailand Epoxy Resin Market Revenue (Million) Forecast, by Application 2019 & 2032
- Table 76: Thailand Epoxy Resin Market Volume (Million) Forecast, by Application 2019 & 2032
- Table 77: Indonesia Epoxy Resin Market Revenue (Million) Forecast, by Application 2019 & 2032
- Table 78: Indonesia Epoxy Resin Market Volume (Million) Forecast, by Application 2019 & 2032
- Table 79: Vietnam Epoxy Resin Market Revenue (Million) Forecast, by Application 2019 & 2032
- Table 80: Vietnam Epoxy Resin Market Volume (Million) Forecast, by Application 2019 & 2032
- Table 81: Rest of Asia Pacific Epoxy Resin Market Revenue (Million) Forecast, by Application 2019 & 2032
- Table 82: Rest of Asia Pacific Epoxy Resin Market Volume (Million) Forecast, by Application 2019 & 2032
- Table 83: Global Epoxy Resin Market Revenue Million Forecast, by Raw Material 2019 & 2032
- Table 84: Global Epoxy Resin Market Volume Million Forecast, by Raw Material 2019 & 2032
- Table 85: Global Epoxy Resin Market Revenue Million Forecast, by Application 2019 & 2032
- Table 86: Global Epoxy Resin Market Volume Million Forecast, by Application 2019 & 2032
- Table 87: Global Epoxy Resin Market Revenue Million Forecast, by Country 2019 & 2032
- Table 88: Global Epoxy Resin Market Volume Million Forecast, by Country 2019 & 2032
- Table 89: United States Epoxy Resin Market Revenue (Million) Forecast, by Application 2019 & 2032
- Table 90: United States Epoxy Resin Market Volume (Million) Forecast, by Application 2019 & 2032
- Table 91: Canada Epoxy Resin Market Revenue (Million) Forecast, by Application 2019 & 2032
- Table 92: Canada Epoxy Resin Market Volume (Million) Forecast, by Application 2019 & 2032
- Table 93: Mexico Epoxy Resin Market Revenue (Million) Forecast, by Application 2019 & 2032
- Table 94: Mexico Epoxy Resin Market Volume (Million) Forecast, by Application 2019 & 2032
- Table 95: Global Epoxy Resin Market Revenue Million Forecast, by Raw Material 2019 & 2032
- Table 96: Global Epoxy Resin Market Volume Million Forecast, by Raw Material 2019 & 2032
- Table 97: Global Epoxy Resin Market Revenue Million Forecast, by Application 2019 & 2032
- Table 98: Global Epoxy Resin Market Volume Million Forecast, by Application 2019 & 2032
- Table 99: Global Epoxy Resin Market Revenue Million Forecast, by Country 2019 & 2032
- Table 100: Global Epoxy Resin Market Volume Million Forecast, by Country 2019 & 2032
- Table 101: Germany Epoxy Resin Market Revenue (Million) Forecast, by Application 2019 & 2032
- Table 102: Germany Epoxy Resin Market Volume (Million) Forecast, by Application 2019 & 2032
- Table 103: United Kingdom Epoxy Resin Market Revenue (Million) Forecast, by Application 2019 & 2032
- Table 104: United Kingdom Epoxy Resin Market Volume (Million) Forecast, by Application 2019 & 2032
- Table 105: France Epoxy Resin Market Revenue (Million) Forecast, by Application 2019 & 2032
- Table 106: France Epoxy Resin Market Volume (Million) Forecast, by Application 2019 & 2032
- Table 107: Italy Epoxy Resin Market Revenue (Million) Forecast, by Application 2019 & 2032
- Table 108: Italy Epoxy Resin Market Volume (Million) Forecast, by Application 2019 & 2032
- Table 109: Spain Epoxy Resin Market Revenue (Million) Forecast, by Application 2019 & 2032
- Table 110: Spain Epoxy Resin Market Volume (Million) Forecast, by Application 2019 & 2032
- Table 111: NORDIC Countries Epoxy Resin Market Revenue (Million) Forecast, by Application 2019 & 2032
- Table 112: NORDIC Countries Epoxy Resin Market Volume (Million) Forecast, by Application 2019 & 2032
- Table 113: Turkey Epoxy Resin Market Revenue (Million) Forecast, by Application 2019 & 2032
- Table 114: Turkey Epoxy Resin Market Volume (Million) Forecast, by Application 2019 & 2032
- Table 115: Russia Epoxy Resin Market Revenue (Million) Forecast, by Application 2019 & 2032
- Table 116: Russia Epoxy Resin Market Volume (Million) Forecast, by Application 2019 & 2032
- Table 117: Rest of Europe Epoxy Resin Market Revenue (Million) Forecast, by Application 2019 & 2032
- Table 118: Rest of Europe Epoxy Resin Market Volume (Million) Forecast, by Application 2019 & 2032
- Table 119: Global Epoxy Resin Market Revenue Million Forecast, by Raw Material 2019 & 2032
- Table 120: Global Epoxy Resin Market Volume Million Forecast, by Raw Material 2019 & 2032
- Table 121: Global Epoxy Resin Market Revenue Million Forecast, by Application 2019 & 2032
- Table 122: Global Epoxy Resin Market Volume Million Forecast, by Application 2019 & 2032
- Table 123: Global Epoxy Resin Market Revenue Million Forecast, by Country 2019 & 2032
- Table 124: Global Epoxy Resin Market Volume Million Forecast, by Country 2019 & 2032
- Table 125: Brazil Epoxy Resin Market Revenue (Million) Forecast, by Application 2019 & 2032
- Table 126: Brazil Epoxy Resin Market Volume (Million) Forecast, by Application 2019 & 2032
- Table 127: Argentina Epoxy Resin Market Revenue (Million) Forecast, by Application 2019 & 2032
- Table 128: Argentina Epoxy Resin Market Volume (Million) Forecast, by Application 2019 & 2032
- Table 129: Colombia Epoxy Resin Market Revenue (Million) Forecast, by Application 2019 & 2032
- Table 130: Colombia Epoxy Resin Market Volume (Million) Forecast, by Application 2019 & 2032
- Table 131: Rest of South America Epoxy Resin Market Revenue (Million) Forecast, by Application 2019 & 2032
- Table 132: Rest of South America Epoxy Resin Market Volume (Million) Forecast, by Application 2019 & 2032
- Table 133: Global Epoxy Resin Market Revenue Million Forecast, by Raw Material 2019 & 2032
- Table 134: Global Epoxy Resin Market Volume Million Forecast, by Raw Material 2019 & 2032
- Table 135: Global Epoxy Resin Market Revenue Million Forecast, by Application 2019 & 2032
- Table 136: Global Epoxy Resin Market Volume Million Forecast, by Application 2019 & 2032
- Table 137: Global Epoxy Resin Market Revenue Million Forecast, by Country 2019 & 2032
- Table 138: Global Epoxy Resin Market Volume Million Forecast, by Country 2019 & 2032
- Table 139: Global Epoxy Resin Market Revenue Million Forecast, by Raw Material 2019 & 2032
- Table 140: Global Epoxy Resin Market Volume Million Forecast, by Raw Material 2019 & 2032
- Table 141: Global Epoxy Resin Market Revenue Million Forecast, by Application 2019 & 2032
- Table 142: Global Epoxy Resin Market Volume Million Forecast, by Application 2019 & 2032
- Table 143: Global Epoxy Resin Market Revenue Million Forecast, by Country 2019 & 2032
- Table 144: Global Epoxy Resin Market Volume Million Forecast, by Country 2019 & 2032
- Table 145: Qatar Epoxy Resin Market Revenue (Million) Forecast, by Application 2019 & 2032
- Table 146: Qatar Epoxy Resin Market Volume (Million) Forecast, by Application 2019 & 2032
- Table 147: United Arab Emirates Epoxy Resin Market Revenue (Million) Forecast, by Application 2019 & 2032
- Table 148: United Arab Emirates Epoxy Resin Market Volume (Million) Forecast, by Application 2019 & 2032
- Table 149: Nigeria Epoxy Resin Market Revenue (Million) Forecast, by Application 2019 & 2032
- Table 150: Nigeria Epoxy Resin Market Volume (Million) Forecast, by Application 2019 & 2032
- Table 151: Egypt Epoxy Resin Market Revenue (Million) Forecast, by Application 2019 & 2032
- Table 152: Egypt Epoxy Resin Market Volume (Million) Forecast, by Application 2019 & 2032
- Table 153: South Africa Epoxy Resin Market Revenue (Million) Forecast, by Application 2019 & 2032
- Table 154: South Africa Epoxy Resin Market Volume (Million) Forecast, by Application 2019 & 2032
- Table 155: Rest of Middle East Epoxy Resin Market Revenue (Million) Forecast, by Application 2019 & 2032
- Table 156: Rest of Middle East Epoxy Resin Market Volume (Million) Forecast, by Application 2019 & 2032
Frequently Asked Questions
1. What is the projected Compound Annual Growth Rate (CAGR) of the Epoxy Resin Market?
The projected CAGR is approximately 3.41%.
2. Which companies are prominent players in the Epoxy Resin Market?
Key companies in the market include KUKDO CHEMICAL CO LTD, Jiangsu Sanmu Group, NAMA Chemicals, Olin Corporation, SPOLCHEMIE*List Not Exhaustive, Chang Chun Group, 3M, Kemipex, BASF SE, Huntsman International LLC, DuPont, Aditya Birla Chemicals, Daicel Corporation, Hexion, Sika AG, Covestro AG, Atul Ltd, NAN YA PLASTICS CORPORATION.
3. What are the main segments of the Epoxy Resin Market?
The market segments include Raw Material, Application.
4. Can you provide details about the market size?
The market size is estimated to be USD XX Million as of 2022.
5. What are some drivers contributing to market growth?
Increasing Demand for Epoxy-based Composites from the Aerospace and Automotive Industries; Strong Growth in the Construction Industry; Rising Demand for Electrical and Electronic Devices.
6. What are the notable trends driving market growth?
The Paints and Coatings Segment is Expected to Dominate the Market.
7. Are there any restraints impacting market growth?
Hazardous Impact of Epoxy Resins; Other Restraints.
8. Can you provide examples of recent developments in the market?
March 2022: Aditya Birla Chemicals announced to double its epoxy manufacturing capacity and expand overseas operations, enhancing its position in the global market.
9. What pricing options are available for accessing the report?
Pricing options include single-user, multi-user, and enterprise licenses priced at USD 4750, USD 5250, and USD 8750 respectively.
10. Is the market size provided in terms of value or volume?
The market size is provided in terms of value, measured in Million and volume, measured in Million.
11. Are there any specific market keywords associated with the report?
Yes, the market keyword associated with the report is "Epoxy Resin Market," which aids in identifying and referencing the specific market segment covered.
12. How do I determine which pricing option suits my needs best?
The pricing options vary based on user requirements and access needs. Individual users may opt for single-user licenses, while businesses requiring broader access may choose multi-user or enterprise licenses for cost-effective access to the report.
13. Are there any additional resources or data provided in the Epoxy Resin Market report?
While the report offers comprehensive insights, it's advisable to review the specific contents or supplementary materials provided to ascertain if additional resources or data are available.
14. How can I stay updated on further developments or reports in the Epoxy Resin Market?
To stay informed about further developments, trends, and reports in the Epoxy Resin Market, consider subscribing to industry newsletters, following relevant companies and organizations, or regularly checking reputable industry news sources and publications.
Methodology
Step 1 - Identification of Relevant Samples Size from Population Database


Step 2 - Approaches for Defining Global Market Size (Value, Volume* & Price*)

Note*: In applicable scenarios
Step 3 - Data Sources
Primary Research
- Web Analytics
- Survey Reports
- Research Institute
- Latest Research Reports
- Opinion Leaders
Secondary Research
- Annual Reports
- White Paper
- Latest Press Release
- Industry Association
- Paid Database
- Investor Presentations

Step 4 - Data Triangulation
Involves using different sources of information in order to increase the validity of a study
These sources are likely to be stakeholders in a program - participants, other researchers, program staff, other community members, and so on.
Then we put all data in single framework & apply various statistical tools to find out the dynamic on the market.
During the analysis stage, feedback from the stakeholder groups would be compared to determine areas of agreement as well as areas of divergence


