
Key Insights
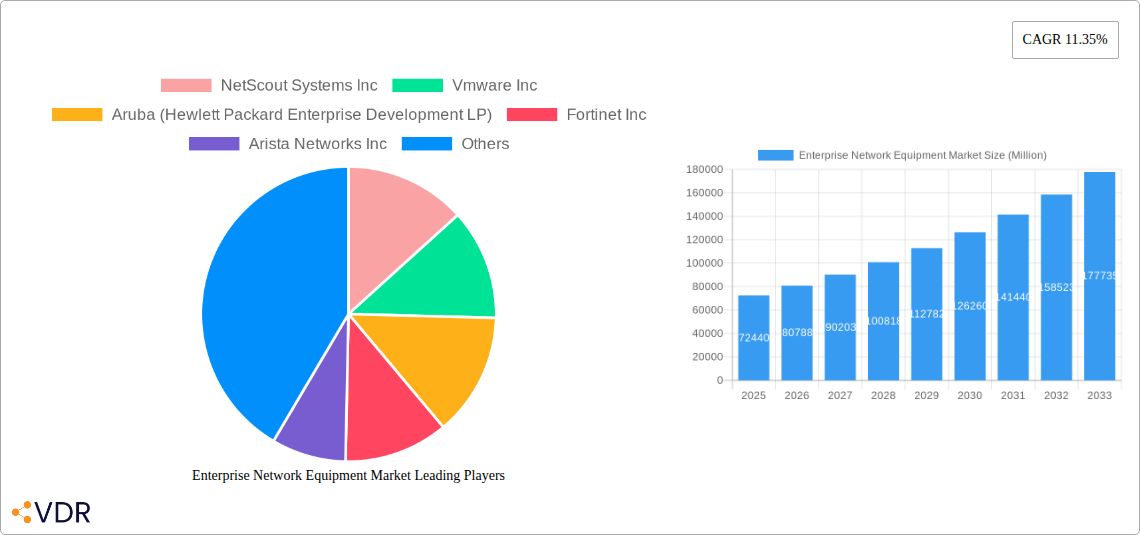
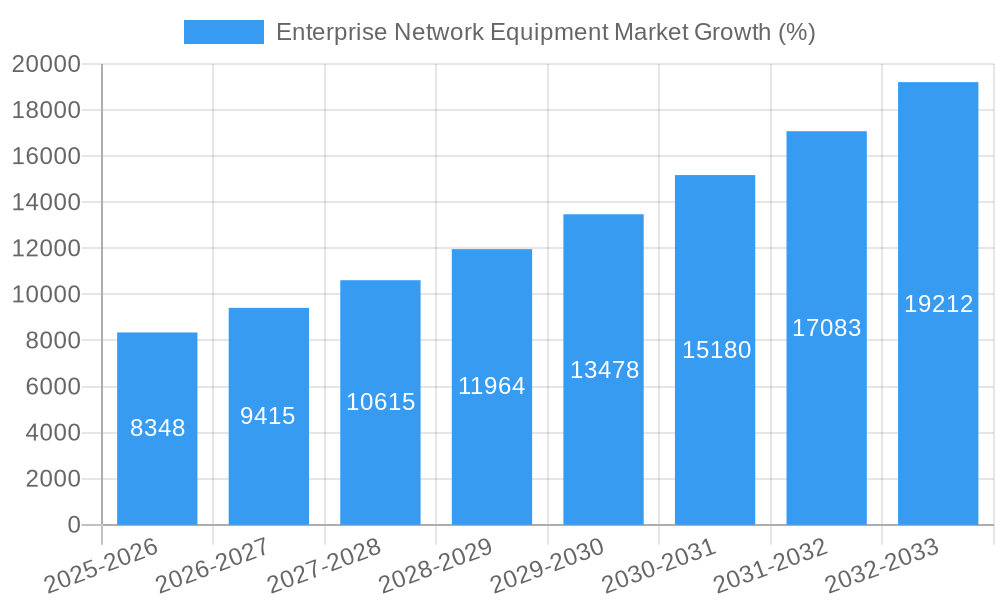
The Enterprise Network Equipment market is experiencing robust growth, projected to reach a market size of $72.44 billion in 2025 and exhibiting a Compound Annual Growth Rate (CAGR) of 11.35% from 2025 to 2033. This expansion is driven by several key factors. The increasing adoption of cloud computing and the proliferation of remote work models necessitate robust and scalable network infrastructure capable of handling large data volumes and supporting diverse user locations. Furthermore, the growing demand for enhanced network security, in the face of sophisticated cyber threats, fuels investment in advanced security solutions such as firewalls, intrusion detection systems, and VPNs. The ongoing digital transformation across industries, coupled with the expansion of Internet of Things (IoT) devices, is another significant driver, creating a need for adaptable and interconnected network architectures. Market segmentation reveals strong demand across various equipment types, including switches, routers, WLAN solutions, and network security appliances. Leading vendors, such as Cisco, Juniper, and Huawei, are actively competing in this dynamic market, constantly innovating to meet evolving customer needs and leveraging strategic partnerships to expand their reach.
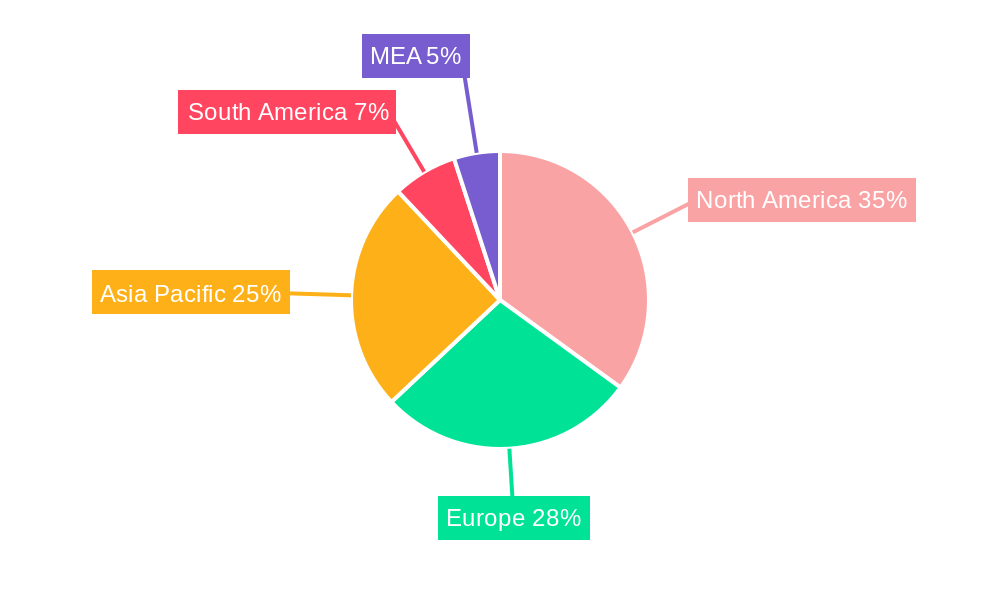
The geographic distribution of the market reveals significant regional variations in growth trajectories. North America, with its established technological infrastructure and high adoption rates, currently holds a substantial market share. However, the Asia-Pacific region is poised for significant growth, driven by rapid economic development, expanding digitalization initiatives, and a rising number of businesses adopting advanced network technologies. Europe also represents a substantial market with a considerable installed base and steady growth potential. Market restraints include high initial investment costs for advanced network equipment, complexities in network integration and management, and the potential for vendor lock-in. However, these challenges are being addressed through the development of more cost-effective solutions, cloud-based management tools, and the increasing standardization of network protocols. The overall outlook for the Enterprise Network Equipment market remains positive, driven by sustained technological advancements, increasing digitalization across various sectors, and the growing need for secure and scalable networking solutions.
Enterprise Network Equipment Market Report: 2019-2033
This comprehensive report provides an in-depth analysis of the Enterprise Network Equipment Market, encompassing market dynamics, growth trends, regional performance, product landscape, and key players. The study period covers 2019-2033, with a base year of 2025 and a forecast period of 2025-2033. This report is essential for industry professionals, investors, and strategic decision-makers seeking to understand and capitalize on opportunities within this rapidly evolving market. The report analyzes the parent market of Networking Equipment and dives deep into the child market of Enterprise Network Equipment.
Enterprise Network Equipment Market Dynamics & Structure
The Enterprise Network Equipment market, valued at xx million units in 2024, exhibits a moderately consolidated structure. Key players like Cisco, Juniper, and Huawei hold significant market share, but smaller, specialized companies are also making inroads. The market is driven by technological innovation, particularly in areas like 5G, software-defined networking (SDN), and network function virtualization (NFV). Stringent regulatory frameworks, particularly concerning data security and privacy, influence market dynamics. The rise of cloud computing and the increasing adoption of hybrid cloud models are creating demand for adaptable and secure network solutions. Competitive substitutes, including cloud-based networking services, pose a challenge to traditional hardware vendors. The market is characterized by a diverse range of end-users, including large enterprises, SMEs, and government organizations. M&A activity remains strong, with an estimated xx deals in 2024, driven by a desire to expand product portfolios and gain market share.
- Market Concentration: Moderately consolidated, with top players holding xx% market share in 2024.
- Technological Innovation Drivers: 5G, SDN, NFV, AI-powered network management.
- Regulatory Frameworks: Data privacy regulations (GDPR, CCPA) impact market growth and security investments.
- Competitive Product Substitutes: Cloud-based networking services, Software as a Service (SaaS) offerings.
- End-User Demographics: Large enterprises, SMEs, government, and educational institutions.
- M&A Trends: xx M&A deals in 2024, driven by expansion and portfolio diversification strategies.
Enterprise Network Equipment Market Growth Trends & Insights
The Enterprise Network Equipment market is experiencing robust growth, driven by the increasing digital transformation initiatives across various industries. The market size is projected to reach xx million units by 2033, exhibiting a Compound Annual Growth Rate (CAGR) of xx% during the forecast period (2025-2033). The adoption of advanced networking technologies, such as SDN and NFV, is accelerating market growth. Consumer behavior shifts towards remote work and cloud-based applications are also fueling demand. Technological disruptions, such as the introduction of 5G and Wi-Fi 6E, are creating new opportunities for innovation and market expansion. Market penetration of advanced networking solutions is increasing steadily, with xx% penetration in 2024 expected to rise to xx% by 2033. The shift towards edge computing is driving demand for specialized network equipment capable of handling increased data volumes and processing power at the network edge.
Dominant Regions, Countries, or Segments in Enterprise Network Equipment Market
North America currently dominates the Enterprise Network Equipment market, driven by high technology adoption rates and a strong presence of major vendors. However, Asia-Pacific is exhibiting the fastest growth, fueled by rapid economic expansion and rising digitalization in developing economies. Within product segments, the Network Security sector is experiencing the highest growth rate, driven by increasing concerns about cyber threats and the need for robust security solutions. Switches remain the largest segment by market share.
- North America: High technology adoption, strong vendor presence, mature market.
- Asia-Pacific: Fastest-growing region, driven by economic expansion and digitalization.
- Europe: Steady growth, driven by government initiatives and enterprise investments.
- Type Segment Dominance: Network Security, with the fastest growth; Switches hold the largest market share.
- Key Drivers: Strong government investments in digital infrastructure, increasing adoption of cloud computing, and rising cybersecurity concerns.
Enterprise Network Equipment Market Product Landscape
The market offers a diverse range of products, including switches, routers, WLAN access points, network security appliances (firewalls, intrusion detection/prevention systems), and other specialized networking equipment. Recent innovations focus on increased speed, enhanced security features, and improved network management capabilities. Products are increasingly being integrated with AI and machine learning to optimize performance and automate operations. Key selling propositions include enhanced scalability, simplified management, and improved security features.
Key Drivers, Barriers & Challenges in Enterprise Network Equipment Market
Key Drivers:
- Increasing adoption of cloud computing and hybrid cloud models.
- Growing demand for enhanced network security in response to rising cyber threats.
- The proliferation of IoT devices and the need for robust network infrastructure to support them.
- Government investments in digital infrastructure development.
Challenges & Restraints:
- Supply chain disruptions leading to component shortages and price increases. This impacted the market by xx% in 2022.
- Stringent regulatory compliance requirements (e.g., data privacy regulations).
- Intense competition among established vendors and emerging players.
Emerging Opportunities in Enterprise Network Equipment Market
- Expansion into untapped markets (e.g., developing economies).
- Growth of edge computing and demand for edge network solutions.
- Increasing adoption of AI and machine learning in network management.
- The rise of 5G and its implications for enterprise networking.
Growth Accelerators in the Enterprise Network Equipment Market Industry
Technological advancements, particularly in areas like 5G, SDN, and AI, are key growth accelerators. Strategic partnerships between hardware vendors and software providers are fostering innovation and expanding market reach. Government initiatives promoting digital transformation and investment in infrastructure are also fueling market growth. The increasing adoption of cloud-based solutions and the expansion into emerging markets offer significant opportunities for long-term growth.
Key Players Shaping the Enterprise Network Equipment Market Market
- NetScout Systems Inc
- Vmware Inc
- Aruba (Hewlett Packard Enterprise Development LP)
- Fortinet Inc
- Arista Networks Inc
- F5 Networks Inc
- Dell EMC
- Check Point Software Technologies Ltd
- Cisco Systems Inc
- Juniper Networks Inc
- Extreme Networks Inc
- Huawei Technologies Co Ltd
- Palo Alto Networks Inc
- New H3C Technologies Co Ltd
Notable Milestones in Enterprise Network Equipment Market Sector
- October 2022: ZTE Corporation launched a series of FTTx and connected home broadband solutions, including a 50G PON & 10G PON Combo solution and a business optical gateway. This signifies advancements in fiber optic network technology.
- July 2022: Alcatel-Lucent Enterprise (ALE) partnered with SBP Digital Service Company Limited to enhance various management systems using standards-based network hardware. This highlights the increasing importance of collaborative partnerships for system integration.
In-Depth Enterprise Network Equipment Market Outlook
The Enterprise Network Equipment market is poised for sustained growth driven by technological advancements, increasing digitalization, and rising demand for secure and reliable network solutions. Strategic partnerships, market expansion into developing economies, and the emergence of new applications will continue to shape the market landscape. The focus on security, scalability, and AI-powered network management will be critical for vendors seeking to capitalize on future market opportunities.
Enterprise Network Equipment Market Segmentation
-
1. Type
- 1.1. Switches
- 1.2. Routers
- 1.3. WLAN
- 1.4. Network Security
- 1.5. Other Types
Enterprise Network Equipment Market Segmentation By Geography
-
1. North America
- 1.1. United States
- 1.2. Canada
-
2. Europe
- 2.1. United Kingdom
- 2.2. Germany
- 2.3. France
- 2.4. Rest of Europe
-
3. Asia Pacific
- 3.1. China
- 3.2. India
- 3.3. Japan
- 3.4. Rest of Asia Pacific
- 4. Rest of the World
Enterprise Network Equipment Market REPORT HIGHLIGHTS
| Aspects | Details |
|---|---|
| Study Period | 2019-2033 |
| Base Year | 2024 |
| Estimated Year | 2025 |
| Forecast Period | 2025-2033 |
| Historical Period | 2019-2024 |
| Growth Rate | CAGR of 11.35% from 2019-2033 |
| Segmentation |
|
Table of Contents
- 1. Introduction
- 1.1. Research Scope
- 1.2. Market Segmentation
- 1.3. Research Methodology
- 1.4. Definitions and Assumptions
- 2. Executive Summary
- 2.1. Introduction
- 3. Market Dynamics
- 3.1. Introduction
- 3.2. Market Drivers
- 3.2.1. Surging Bandwidth Requirements with IoT Prevalance; Government Initiations in Emerging Economies to Develop Smart Cities
- 3.3. Market Restrains
- 3.3.1. High Maintenance Cost Due to Security Concerns
- 3.4. Market Trends
- 3.4.1. Network Security is Growing Due to Data Security Concerns
- 4. Market Factor Analysis
- 4.1. Porters Five Forces
- 4.2. Supply/Value Chain
- 4.3. PESTEL analysis
- 4.4. Market Entropy
- 4.5. Patent/Trademark Analysis
- 5. Global Enterprise Network Equipment Market Analysis, Insights and Forecast, 2019-2031
- 5.1. Market Analysis, Insights and Forecast - by Type
- 5.1.1. Switches
- 5.1.2. Routers
- 5.1.3. WLAN
- 5.1.4. Network Security
- 5.1.5. Other Types
- 5.2. Market Analysis, Insights and Forecast - by Region
- 5.2.1. North America
- 5.2.2. Europe
- 5.2.3. Asia Pacific
- 5.2.4. Rest of the World
- 5.1. Market Analysis, Insights and Forecast - by Type
- 6. North America Enterprise Network Equipment Market Analysis, Insights and Forecast, 2019-2031
- 6.1. Market Analysis, Insights and Forecast - by Type
- 6.1.1. Switches
- 6.1.2. Routers
- 6.1.3. WLAN
- 6.1.4. Network Security
- 6.1.5. Other Types
- 6.1. Market Analysis, Insights and Forecast - by Type
- 7. Europe Enterprise Network Equipment Market Analysis, Insights and Forecast, 2019-2031
- 7.1. Market Analysis, Insights and Forecast - by Type
- 7.1.1. Switches
- 7.1.2. Routers
- 7.1.3. WLAN
- 7.1.4. Network Security
- 7.1.5. Other Types
- 7.1. Market Analysis, Insights and Forecast - by Type
- 8. Asia Pacific Enterprise Network Equipment Market Analysis, Insights and Forecast, 2019-2031
- 8.1. Market Analysis, Insights and Forecast - by Type
- 8.1.1. Switches
- 8.1.2. Routers
- 8.1.3. WLAN
- 8.1.4. Network Security
- 8.1.5. Other Types
- 8.1. Market Analysis, Insights and Forecast - by Type
- 9. Rest of the World Enterprise Network Equipment Market Analysis, Insights and Forecast, 2019-2031
- 9.1. Market Analysis, Insights and Forecast - by Type
- 9.1.1. Switches
- 9.1.2. Routers
- 9.1.3. WLAN
- 9.1.4. Network Security
- 9.1.5. Other Types
- 9.1. Market Analysis, Insights and Forecast - by Type
- 10. North America Enterprise Network Equipment Market Analysis, Insights and Forecast, 2019-2031
- 10.1. Market Analysis, Insights and Forecast - By Country/Sub-region
- 10.1.1 United States
- 10.1.2 Canada
- 10.1.3 Mexico
- 11. Europe Enterprise Network Equipment Market Analysis, Insights and Forecast, 2019-2031
- 11.1. Market Analysis, Insights and Forecast - By Country/Sub-region
- 11.1.1 Germany
- 11.1.2 United Kingdom
- 11.1.3 France
- 11.1.4 Spain
- 11.1.5 Italy
- 11.1.6 Spain
- 11.1.7 Belgium
- 11.1.8 Netherland
- 11.1.9 Nordics
- 11.1.10 Rest of Europe
- 12. Asia Pacific Enterprise Network Equipment Market Analysis, Insights and Forecast, 2019-2031
- 12.1. Market Analysis, Insights and Forecast - By Country/Sub-region
- 12.1.1 China
- 12.1.2 Japan
- 12.1.3 India
- 12.1.4 South Korea
- 12.1.5 Southeast Asia
- 12.1.6 Australia
- 12.1.7 Indonesia
- 12.1.8 Phillipes
- 12.1.9 Singapore
- 12.1.10 Thailandc
- 12.1.11 Rest of Asia Pacific
- 13. South America Enterprise Network Equipment Market Analysis, Insights and Forecast, 2019-2031
- 13.1. Market Analysis, Insights and Forecast - By Country/Sub-region
- 13.1.1 Brazil
- 13.1.2 Argentina
- 13.1.3 Peru
- 13.1.4 Chile
- 13.1.5 Colombia
- 13.1.6 Ecuador
- 13.1.7 Venezuela
- 13.1.8 Rest of South America
- 14. North America Enterprise Network Equipment Market Analysis, Insights and Forecast, 2019-2031
- 14.1. Market Analysis, Insights and Forecast - By Country/Sub-region
- 14.1.1 United States
- 14.1.2 Canada
- 14.1.3 Mexico
- 15. MEA Enterprise Network Equipment Market Analysis, Insights and Forecast, 2019-2031
- 15.1. Market Analysis, Insights and Forecast - By Country/Sub-region
- 15.1.1 United Arab Emirates
- 15.1.2 Saudi Arabia
- 15.1.3 South Africa
- 15.1.4 Rest of Middle East and Africa
- 16. Competitive Analysis
- 16.1. Global Market Share Analysis 2024
- 16.2. Company Profiles
- 16.2.1 NetScout Systems Inc
- 16.2.1.1. Overview
- 16.2.1.2. Products
- 16.2.1.3. SWOT Analysis
- 16.2.1.4. Recent Developments
- 16.2.1.5. Financials (Based on Availability)
- 16.2.2 Vmware Inc
- 16.2.2.1. Overview
- 16.2.2.2. Products
- 16.2.2.3. SWOT Analysis
- 16.2.2.4. Recent Developments
- 16.2.2.5. Financials (Based on Availability)
- 16.2.3 Aruba (Hewlett Packard Enterprise Development LP)
- 16.2.3.1. Overview
- 16.2.3.2. Products
- 16.2.3.3. SWOT Analysis
- 16.2.3.4. Recent Developments
- 16.2.3.5. Financials (Based on Availability)
- 16.2.4 Fortinet Inc
- 16.2.4.1. Overview
- 16.2.4.2. Products
- 16.2.4.3. SWOT Analysis
- 16.2.4.4. Recent Developments
- 16.2.4.5. Financials (Based on Availability)
- 16.2.5 Arista Networks Inc
- 16.2.5.1. Overview
- 16.2.5.2. Products
- 16.2.5.3. SWOT Analysis
- 16.2.5.4. Recent Developments
- 16.2.5.5. Financials (Based on Availability)
- 16.2.6 F5 Networks Inc
- 16.2.6.1. Overview
- 16.2.6.2. Products
- 16.2.6.3. SWOT Analysis
- 16.2.6.4. Recent Developments
- 16.2.6.5. Financials (Based on Availability)
- 16.2.7 Dell EMC
- 16.2.7.1. Overview
- 16.2.7.2. Products
- 16.2.7.3. SWOT Analysis
- 16.2.7.4. Recent Developments
- 16.2.7.5. Financials (Based on Availability)
- 16.2.8 Check Point Software Technologies Ltd
- 16.2.8.1. Overview
- 16.2.8.2. Products
- 16.2.8.3. SWOT Analysis
- 16.2.8.4. Recent Developments
- 16.2.8.5. Financials (Based on Availability)
- 16.2.9 Cisco Systems Inc
- 16.2.9.1. Overview
- 16.2.9.2. Products
- 16.2.9.3. SWOT Analysis
- 16.2.9.4. Recent Developments
- 16.2.9.5. Financials (Based on Availability)
- 16.2.10 Juniper Networks Inc
- 16.2.10.1. Overview
- 16.2.10.2. Products
- 16.2.10.3. SWOT Analysis
- 16.2.10.4. Recent Developments
- 16.2.10.5. Financials (Based on Availability)
- 16.2.11 Extreme Networks Inc
- 16.2.11.1. Overview
- 16.2.11.2. Products
- 16.2.11.3. SWOT Analysis
- 16.2.11.4. Recent Developments
- 16.2.11.5. Financials (Based on Availability)
- 16.2.12 Huawei Technologies Co Ltd
- 16.2.12.1. Overview
- 16.2.12.2. Products
- 16.2.12.3. SWOT Analysis
- 16.2.12.4. Recent Developments
- 16.2.12.5. Financials (Based on Availability)
- 16.2.13 Palo Alto Networks Inc
- 16.2.13.1. Overview
- 16.2.13.2. Products
- 16.2.13.3. SWOT Analysis
- 16.2.13.4. Recent Developments
- 16.2.13.5. Financials (Based on Availability)
- 16.2.14 New H3C Technologies Co Ltd
- 16.2.14.1. Overview
- 16.2.14.2. Products
- 16.2.14.3. SWOT Analysis
- 16.2.14.4. Recent Developments
- 16.2.14.5. Financials (Based on Availability)
- 16.2.1 NetScout Systems Inc
List of Figures
- Figure 1: Global Enterprise Network Equipment Market Revenue Breakdown (Million, %) by Region 2024 & 2032
- Figure 2: Global Enterprise Network Equipment Market Volume Breakdown (K Unit, %) by Region 2024 & 2032
- Figure 3: North America Enterprise Network Equipment Market Revenue (Million), by Country 2024 & 2032
- Figure 4: North America Enterprise Network Equipment Market Volume (K Unit), by Country 2024 & 2032
- Figure 5: North America Enterprise Network Equipment Market Revenue Share (%), by Country 2024 & 2032
- Figure 6: North America Enterprise Network Equipment Market Volume Share (%), by Country 2024 & 2032
- Figure 7: Europe Enterprise Network Equipment Market Revenue (Million), by Country 2024 & 2032
- Figure 8: Europe Enterprise Network Equipment Market Volume (K Unit), by Country 2024 & 2032
- Figure 9: Europe Enterprise Network Equipment Market Revenue Share (%), by Country 2024 & 2032
- Figure 10: Europe Enterprise Network Equipment Market Volume Share (%), by Country 2024 & 2032
- Figure 11: Asia Pacific Enterprise Network Equipment Market Revenue (Million), by Country 2024 & 2032
- Figure 12: Asia Pacific Enterprise Network Equipment Market Volume (K Unit), by Country 2024 & 2032
- Figure 13: Asia Pacific Enterprise Network Equipment Market Revenue Share (%), by Country 2024 & 2032
- Figure 14: Asia Pacific Enterprise Network Equipment Market Volume Share (%), by Country 2024 & 2032
- Figure 15: South America Enterprise Network Equipment Market Revenue (Million), by Country 2024 & 2032
- Figure 16: South America Enterprise Network Equipment Market Volume (K Unit), by Country 2024 & 2032
- Figure 17: South America Enterprise Network Equipment Market Revenue Share (%), by Country 2024 & 2032
- Figure 18: South America Enterprise Network Equipment Market Volume Share (%), by Country 2024 & 2032
- Figure 19: North America Enterprise Network Equipment Market Revenue (Million), by Country 2024 & 2032
- Figure 20: North America Enterprise Network Equipment Market Volume (K Unit), by Country 2024 & 2032
- Figure 21: North America Enterprise Network Equipment Market Revenue Share (%), by Country 2024 & 2032
- Figure 22: North America Enterprise Network Equipment Market Volume Share (%), by Country 2024 & 2032
- Figure 23: MEA Enterprise Network Equipment Market Revenue (Million), by Country 2024 & 2032
- Figure 24: MEA Enterprise Network Equipment Market Volume (K Unit), by Country 2024 & 2032
- Figure 25: MEA Enterprise Network Equipment Market Revenue Share (%), by Country 2024 & 2032
- Figure 26: MEA Enterprise Network Equipment Market Volume Share (%), by Country 2024 & 2032
- Figure 27: North America Enterprise Network Equipment Market Revenue (Million), by Type 2024 & 2032
- Figure 28: North America Enterprise Network Equipment Market Volume (K Unit), by Type 2024 & 2032
- Figure 29: North America Enterprise Network Equipment Market Revenue Share (%), by Type 2024 & 2032
- Figure 30: North America Enterprise Network Equipment Market Volume Share (%), by Type 2024 & 2032
- Figure 31: North America Enterprise Network Equipment Market Revenue (Million), by Country 2024 & 2032
- Figure 32: North America Enterprise Network Equipment Market Volume (K Unit), by Country 2024 & 2032
- Figure 33: North America Enterprise Network Equipment Market Revenue Share (%), by Country 2024 & 2032
- Figure 34: North America Enterprise Network Equipment Market Volume Share (%), by Country 2024 & 2032
- Figure 35: Europe Enterprise Network Equipment Market Revenue (Million), by Type 2024 & 2032
- Figure 36: Europe Enterprise Network Equipment Market Volume (K Unit), by Type 2024 & 2032
- Figure 37: Europe Enterprise Network Equipment Market Revenue Share (%), by Type 2024 & 2032
- Figure 38: Europe Enterprise Network Equipment Market Volume Share (%), by Type 2024 & 2032
- Figure 39: Europe Enterprise Network Equipment Market Revenue (Million), by Country 2024 & 2032
- Figure 40: Europe Enterprise Network Equipment Market Volume (K Unit), by Country 2024 & 2032
- Figure 41: Europe Enterprise Network Equipment Market Revenue Share (%), by Country 2024 & 2032
- Figure 42: Europe Enterprise Network Equipment Market Volume Share (%), by Country 2024 & 2032
- Figure 43: Asia Pacific Enterprise Network Equipment Market Revenue (Million), by Type 2024 & 2032
- Figure 44: Asia Pacific Enterprise Network Equipment Market Volume (K Unit), by Type 2024 & 2032
- Figure 45: Asia Pacific Enterprise Network Equipment Market Revenue Share (%), by Type 2024 & 2032
- Figure 46: Asia Pacific Enterprise Network Equipment Market Volume Share (%), by Type 2024 & 2032
- Figure 47: Asia Pacific Enterprise Network Equipment Market Revenue (Million), by Country 2024 & 2032
- Figure 48: Asia Pacific Enterprise Network Equipment Market Volume (K Unit), by Country 2024 & 2032
- Figure 49: Asia Pacific Enterprise Network Equipment Market Revenue Share (%), by Country 2024 & 2032
- Figure 50: Asia Pacific Enterprise Network Equipment Market Volume Share (%), by Country 2024 & 2032
- Figure 51: Rest of the World Enterprise Network Equipment Market Revenue (Million), by Type 2024 & 2032
- Figure 52: Rest of the World Enterprise Network Equipment Market Volume (K Unit), by Type 2024 & 2032
- Figure 53: Rest of the World Enterprise Network Equipment Market Revenue Share (%), by Type 2024 & 2032
- Figure 54: Rest of the World Enterprise Network Equipment Market Volume Share (%), by Type 2024 & 2032
- Figure 55: Rest of the World Enterprise Network Equipment Market Revenue (Million), by Country 2024 & 2032
- Figure 56: Rest of the World Enterprise Network Equipment Market Volume (K Unit), by Country 2024 & 2032
- Figure 57: Rest of the World Enterprise Network Equipment Market Revenue Share (%), by Country 2024 & 2032
- Figure 58: Rest of the World Enterprise Network Equipment Market Volume Share (%), by Country 2024 & 2032
List of Tables
- Table 1: Global Enterprise Network Equipment Market Revenue Million Forecast, by Region 2019 & 2032
- Table 2: Global Enterprise Network Equipment Market Volume K Unit Forecast, by Region 2019 & 2032
- Table 3: Global Enterprise Network Equipment Market Revenue Million Forecast, by Type 2019 & 2032
- Table 4: Global Enterprise Network Equipment Market Volume K Unit Forecast, by Type 2019 & 2032
- Table 5: Global Enterprise Network Equipment Market Revenue Million Forecast, by Region 2019 & 2032
- Table 6: Global Enterprise Network Equipment Market Volume K Unit Forecast, by Region 2019 & 2032
- Table 7: Global Enterprise Network Equipment Market Revenue Million Forecast, by Country 2019 & 2032
- Table 8: Global Enterprise Network Equipment Market Volume K Unit Forecast, by Country 2019 & 2032
- Table 9: United States Enterprise Network Equipment Market Revenue (Million) Forecast, by Application 2019 & 2032
- Table 10: United States Enterprise Network Equipment Market Volume (K Unit) Forecast, by Application 2019 & 2032
- Table 11: Canada Enterprise Network Equipment Market Revenue (Million) Forecast, by Application 2019 & 2032
- Table 12: Canada Enterprise Network Equipment Market Volume (K Unit) Forecast, by Application 2019 & 2032
- Table 13: Mexico Enterprise Network Equipment Market Revenue (Million) Forecast, by Application 2019 & 2032
- Table 14: Mexico Enterprise Network Equipment Market Volume (K Unit) Forecast, by Application 2019 & 2032
- Table 15: Global Enterprise Network Equipment Market Revenue Million Forecast, by Country 2019 & 2032
- Table 16: Global Enterprise Network Equipment Market Volume K Unit Forecast, by Country 2019 & 2032
- Table 17: Germany Enterprise Network Equipment Market Revenue (Million) Forecast, by Application 2019 & 2032
- Table 18: Germany Enterprise Network Equipment Market Volume (K Unit) Forecast, by Application 2019 & 2032
- Table 19: United Kingdom Enterprise Network Equipment Market Revenue (Million) Forecast, by Application 2019 & 2032
- Table 20: United Kingdom Enterprise Network Equipment Market Volume (K Unit) Forecast, by Application 2019 & 2032
- Table 21: France Enterprise Network Equipment Market Revenue (Million) Forecast, by Application 2019 & 2032
- Table 22: France Enterprise Network Equipment Market Volume (K Unit) Forecast, by Application 2019 & 2032
- Table 23: Spain Enterprise Network Equipment Market Revenue (Million) Forecast, by Application 2019 & 2032
- Table 24: Spain Enterprise Network Equipment Market Volume (K Unit) Forecast, by Application 2019 & 2032
- Table 25: Italy Enterprise Network Equipment Market Revenue (Million) Forecast, by Application 2019 & 2032
- Table 26: Italy Enterprise Network Equipment Market Volume (K Unit) Forecast, by Application 2019 & 2032
- Table 27: Spain Enterprise Network Equipment Market Revenue (Million) Forecast, by Application 2019 & 2032
- Table 28: Spain Enterprise Network Equipment Market Volume (K Unit) Forecast, by Application 2019 & 2032
- Table 29: Belgium Enterprise Network Equipment Market Revenue (Million) Forecast, by Application 2019 & 2032
- Table 30: Belgium Enterprise Network Equipment Market Volume (K Unit) Forecast, by Application 2019 & 2032
- Table 31: Netherland Enterprise Network Equipment Market Revenue (Million) Forecast, by Application 2019 & 2032
- Table 32: Netherland Enterprise Network Equipment Market Volume (K Unit) Forecast, by Application 2019 & 2032
- Table 33: Nordics Enterprise Network Equipment Market Revenue (Million) Forecast, by Application 2019 & 2032
- Table 34: Nordics Enterprise Network Equipment Market Volume (K Unit) Forecast, by Application 2019 & 2032
- Table 35: Rest of Europe Enterprise Network Equipment Market Revenue (Million) Forecast, by Application 2019 & 2032
- Table 36: Rest of Europe Enterprise Network Equipment Market Volume (K Unit) Forecast, by Application 2019 & 2032
- Table 37: Global Enterprise Network Equipment Market Revenue Million Forecast, by Country 2019 & 2032
- Table 38: Global Enterprise Network Equipment Market Volume K Unit Forecast, by Country 2019 & 2032
- Table 39: China Enterprise Network Equipment Market Revenue (Million) Forecast, by Application 2019 & 2032
- Table 40: China Enterprise Network Equipment Market Volume (K Unit) Forecast, by Application 2019 & 2032
- Table 41: Japan Enterprise Network Equipment Market Revenue (Million) Forecast, by Application 2019 & 2032
- Table 42: Japan Enterprise Network Equipment Market Volume (K Unit) Forecast, by Application 2019 & 2032
- Table 43: India Enterprise Network Equipment Market Revenue (Million) Forecast, by Application 2019 & 2032
- Table 44: India Enterprise Network Equipment Market Volume (K Unit) Forecast, by Application 2019 & 2032
- Table 45: South Korea Enterprise Network Equipment Market Revenue (Million) Forecast, by Application 2019 & 2032
- Table 46: South Korea Enterprise Network Equipment Market Volume (K Unit) Forecast, by Application 2019 & 2032
- Table 47: Southeast Asia Enterprise Network Equipment Market Revenue (Million) Forecast, by Application 2019 & 2032
- Table 48: Southeast Asia Enterprise Network Equipment Market Volume (K Unit) Forecast, by Application 2019 & 2032
- Table 49: Australia Enterprise Network Equipment Market Revenue (Million) Forecast, by Application 2019 & 2032
- Table 50: Australia Enterprise Network Equipment Market Volume (K Unit) Forecast, by Application 2019 & 2032
- Table 51: Indonesia Enterprise Network Equipment Market Revenue (Million) Forecast, by Application 2019 & 2032
- Table 52: Indonesia Enterprise Network Equipment Market Volume (K Unit) Forecast, by Application 2019 & 2032
- Table 53: Phillipes Enterprise Network Equipment Market Revenue (Million) Forecast, by Application 2019 & 2032
- Table 54: Phillipes Enterprise Network Equipment Market Volume (K Unit) Forecast, by Application 2019 & 2032
- Table 55: Singapore Enterprise Network Equipment Market Revenue (Million) Forecast, by Application 2019 & 2032
- Table 56: Singapore Enterprise Network Equipment Market Volume (K Unit) Forecast, by Application 2019 & 2032
- Table 57: Thailandc Enterprise Network Equipment Market Revenue (Million) Forecast, by Application 2019 & 2032
- Table 58: Thailandc Enterprise Network Equipment Market Volume (K Unit) Forecast, by Application 2019 & 2032
- Table 59: Rest of Asia Pacific Enterprise Network Equipment Market Revenue (Million) Forecast, by Application 2019 & 2032
- Table 60: Rest of Asia Pacific Enterprise Network Equipment Market Volume (K Unit) Forecast, by Application 2019 & 2032
- Table 61: Global Enterprise Network Equipment Market Revenue Million Forecast, by Country 2019 & 2032
- Table 62: Global Enterprise Network Equipment Market Volume K Unit Forecast, by Country 2019 & 2032
- Table 63: Brazil Enterprise Network Equipment Market Revenue (Million) Forecast, by Application 2019 & 2032
- Table 64: Brazil Enterprise Network Equipment Market Volume (K Unit) Forecast, by Application 2019 & 2032
- Table 65: Argentina Enterprise Network Equipment Market Revenue (Million) Forecast, by Application 2019 & 2032
- Table 66: Argentina Enterprise Network Equipment Market Volume (K Unit) Forecast, by Application 2019 & 2032
- Table 67: Peru Enterprise Network Equipment Market Revenue (Million) Forecast, by Application 2019 & 2032
- Table 68: Peru Enterprise Network Equipment Market Volume (K Unit) Forecast, by Application 2019 & 2032
- Table 69: Chile Enterprise Network Equipment Market Revenue (Million) Forecast, by Application 2019 & 2032
- Table 70: Chile Enterprise Network Equipment Market Volume (K Unit) Forecast, by Application 2019 & 2032
- Table 71: Colombia Enterprise Network Equipment Market Revenue (Million) Forecast, by Application 2019 & 2032
- Table 72: Colombia Enterprise Network Equipment Market Volume (K Unit) Forecast, by Application 2019 & 2032
- Table 73: Ecuador Enterprise Network Equipment Market Revenue (Million) Forecast, by Application 2019 & 2032
- Table 74: Ecuador Enterprise Network Equipment Market Volume (K Unit) Forecast, by Application 2019 & 2032
- Table 75: Venezuela Enterprise Network Equipment Market Revenue (Million) Forecast, by Application 2019 & 2032
- Table 76: Venezuela Enterprise Network Equipment Market Volume (K Unit) Forecast, by Application 2019 & 2032
- Table 77: Rest of South America Enterprise Network Equipment Market Revenue (Million) Forecast, by Application 2019 & 2032
- Table 78: Rest of South America Enterprise Network Equipment Market Volume (K Unit) Forecast, by Application 2019 & 2032
- Table 79: Global Enterprise Network Equipment Market Revenue Million Forecast, by Country 2019 & 2032
- Table 80: Global Enterprise Network Equipment Market Volume K Unit Forecast, by Country 2019 & 2032
- Table 81: United States Enterprise Network Equipment Market Revenue (Million) Forecast, by Application 2019 & 2032
- Table 82: United States Enterprise Network Equipment Market Volume (K Unit) Forecast, by Application 2019 & 2032
- Table 83: Canada Enterprise Network Equipment Market Revenue (Million) Forecast, by Application 2019 & 2032
- Table 84: Canada Enterprise Network Equipment Market Volume (K Unit) Forecast, by Application 2019 & 2032
- Table 85: Mexico Enterprise Network Equipment Market Revenue (Million) Forecast, by Application 2019 & 2032
- Table 86: Mexico Enterprise Network Equipment Market Volume (K Unit) Forecast, by Application 2019 & 2032
- Table 87: Global Enterprise Network Equipment Market Revenue Million Forecast, by Country 2019 & 2032
- Table 88: Global Enterprise Network Equipment Market Volume K Unit Forecast, by Country 2019 & 2032
- Table 89: United Arab Emirates Enterprise Network Equipment Market Revenue (Million) Forecast, by Application 2019 & 2032
- Table 90: United Arab Emirates Enterprise Network Equipment Market Volume (K Unit) Forecast, by Application 2019 & 2032
- Table 91: Saudi Arabia Enterprise Network Equipment Market Revenue (Million) Forecast, by Application 2019 & 2032
- Table 92: Saudi Arabia Enterprise Network Equipment Market Volume (K Unit) Forecast, by Application 2019 & 2032
- Table 93: South Africa Enterprise Network Equipment Market Revenue (Million) Forecast, by Application 2019 & 2032
- Table 94: South Africa Enterprise Network Equipment Market Volume (K Unit) Forecast, by Application 2019 & 2032
- Table 95: Rest of Middle East and Africa Enterprise Network Equipment Market Revenue (Million) Forecast, by Application 2019 & 2032
- Table 96: Rest of Middle East and Africa Enterprise Network Equipment Market Volume (K Unit) Forecast, by Application 2019 & 2032
- Table 97: Global Enterprise Network Equipment Market Revenue Million Forecast, by Type 2019 & 2032
- Table 98: Global Enterprise Network Equipment Market Volume K Unit Forecast, by Type 2019 & 2032
- Table 99: Global Enterprise Network Equipment Market Revenue Million Forecast, by Country 2019 & 2032
- Table 100: Global Enterprise Network Equipment Market Volume K Unit Forecast, by Country 2019 & 2032
- Table 101: United States Enterprise Network Equipment Market Revenue (Million) Forecast, by Application 2019 & 2032
- Table 102: United States Enterprise Network Equipment Market Volume (K Unit) Forecast, by Application 2019 & 2032
- Table 103: Canada Enterprise Network Equipment Market Revenue (Million) Forecast, by Application 2019 & 2032
- Table 104: Canada Enterprise Network Equipment Market Volume (K Unit) Forecast, by Application 2019 & 2032
- Table 105: Global Enterprise Network Equipment Market Revenue Million Forecast, by Type 2019 & 2032
- Table 106: Global Enterprise Network Equipment Market Volume K Unit Forecast, by Type 2019 & 2032
- Table 107: Global Enterprise Network Equipment Market Revenue Million Forecast, by Country 2019 & 2032
- Table 108: Global Enterprise Network Equipment Market Volume K Unit Forecast, by Country 2019 & 2032
- Table 109: United Kingdom Enterprise Network Equipment Market Revenue (Million) Forecast, by Application 2019 & 2032
- Table 110: United Kingdom Enterprise Network Equipment Market Volume (K Unit) Forecast, by Application 2019 & 2032
- Table 111: Germany Enterprise Network Equipment Market Revenue (Million) Forecast, by Application 2019 & 2032
- Table 112: Germany Enterprise Network Equipment Market Volume (K Unit) Forecast, by Application 2019 & 2032
- Table 113: France Enterprise Network Equipment Market Revenue (Million) Forecast, by Application 2019 & 2032
- Table 114: France Enterprise Network Equipment Market Volume (K Unit) Forecast, by Application 2019 & 2032
- Table 115: Rest of Europe Enterprise Network Equipment Market Revenue (Million) Forecast, by Application 2019 & 2032
- Table 116: Rest of Europe Enterprise Network Equipment Market Volume (K Unit) Forecast, by Application 2019 & 2032
- Table 117: Global Enterprise Network Equipment Market Revenue Million Forecast, by Type 2019 & 2032
- Table 118: Global Enterprise Network Equipment Market Volume K Unit Forecast, by Type 2019 & 2032
- Table 119: Global Enterprise Network Equipment Market Revenue Million Forecast, by Country 2019 & 2032
- Table 120: Global Enterprise Network Equipment Market Volume K Unit Forecast, by Country 2019 & 2032
- Table 121: China Enterprise Network Equipment Market Revenue (Million) Forecast, by Application 2019 & 2032
- Table 122: China Enterprise Network Equipment Market Volume (K Unit) Forecast, by Application 2019 & 2032
- Table 123: India Enterprise Network Equipment Market Revenue (Million) Forecast, by Application 2019 & 2032
- Table 124: India Enterprise Network Equipment Market Volume (K Unit) Forecast, by Application 2019 & 2032
- Table 125: Japan Enterprise Network Equipment Market Revenue (Million) Forecast, by Application 2019 & 2032
- Table 126: Japan Enterprise Network Equipment Market Volume (K Unit) Forecast, by Application 2019 & 2032
- Table 127: Rest of Asia Pacific Enterprise Network Equipment Market Revenue (Million) Forecast, by Application 2019 & 2032
- Table 128: Rest of Asia Pacific Enterprise Network Equipment Market Volume (K Unit) Forecast, by Application 2019 & 2032
- Table 129: Global Enterprise Network Equipment Market Revenue Million Forecast, by Type 2019 & 2032
- Table 130: Global Enterprise Network Equipment Market Volume K Unit Forecast, by Type 2019 & 2032
- Table 131: Global Enterprise Network Equipment Market Revenue Million Forecast, by Country 2019 & 2032
- Table 132: Global Enterprise Network Equipment Market Volume K Unit Forecast, by Country 2019 & 2032
Frequently Asked Questions
1. What is the projected Compound Annual Growth Rate (CAGR) of the Enterprise Network Equipment Market?
The projected CAGR is approximately 11.35%.
2. Which companies are prominent players in the Enterprise Network Equipment Market?
Key companies in the market include NetScout Systems Inc, Vmware Inc, Aruba (Hewlett Packard Enterprise Development LP), Fortinet Inc, Arista Networks Inc, F5 Networks Inc, Dell EMC, Check Point Software Technologies Ltd, Cisco Systems Inc, Juniper Networks Inc, Extreme Networks Inc, Huawei Technologies Co Ltd, Palo Alto Networks Inc, New H3C Technologies Co Ltd .
3. What are the main segments of the Enterprise Network Equipment Market?
The market segments include Type.
4. Can you provide details about the market size?
The market size is estimated to be USD 72.44 Million as of 2022.
5. What are some drivers contributing to market growth?
Surging Bandwidth Requirements with IoT Prevalance; Government Initiations in Emerging Economies to Develop Smart Cities.
6. What are the notable trends driving market growth?
Network Security is Growing Due to Data Security Concerns.
7. Are there any restraints impacting market growth?
High Maintenance Cost Due to Security Concerns.
8. Can you provide examples of recent developments in the market?
October 2022: A fiber to the x (FTTx) and connected home-themed series of broadband solutions and products were introduced by ZTE Corporation, a global provider of information and communication technology solutions, at an event held in conjunction with Networks X in Amsterdam, the Netherlands. A 50G PON&10G PON Combo solution, the Light ODN solution, and a business optical gateway were included in the FTTx-themed series. ZTE thinks optical networks should have straightforward deployment, seamless upgrades, and straightforward operation and maintenance.
9. What pricing options are available for accessing the report?
Pricing options include single-user, multi-user, and enterprise licenses priced at USD 4750, USD 5250, and USD 8750 respectively.
10. Is the market size provided in terms of value or volume?
The market size is provided in terms of value, measured in Million and volume, measured in K Unit.
11. Are there any specific market keywords associated with the report?
Yes, the market keyword associated with the report is "Enterprise Network Equipment Market," which aids in identifying and referencing the specific market segment covered.
12. How do I determine which pricing option suits my needs best?
The pricing options vary based on user requirements and access needs. Individual users may opt for single-user licenses, while businesses requiring broader access may choose multi-user or enterprise licenses for cost-effective access to the report.
13. Are there any additional resources or data provided in the Enterprise Network Equipment Market report?
While the report offers comprehensive insights, it's advisable to review the specific contents or supplementary materials provided to ascertain if additional resources or data are available.
14. How can I stay updated on further developments or reports in the Enterprise Network Equipment Market?
To stay informed about further developments, trends, and reports in the Enterprise Network Equipment Market, consider subscribing to industry newsletters, following relevant companies and organizations, or regularly checking reputable industry news sources and publications.
Methodology
Step 1 - Identification of Relevant Samples Size from Population Database


Step 2 - Approaches for Defining Global Market Size (Value, Volume* & Price*)

Note*: In applicable scenarios
Step 3 - Data Sources
Primary Research
- Web Analytics
- Survey Reports
- Research Institute
- Latest Research Reports
- Opinion Leaders
Secondary Research
- Annual Reports
- White Paper
- Latest Press Release
- Industry Association
- Paid Database
- Investor Presentations

Step 4 - Data Triangulation
Involves using different sources of information in order to increase the validity of a study
These sources are likely to be stakeholders in a program - participants, other researchers, program staff, other community members, and so on.
Then we put all data in single framework & apply various statistical tools to find out the dynamic on the market.
During the analysis stage, feedback from the stakeholder groups would be compared to determine areas of agreement as well as areas of divergence


