
Key Insights
The global engineering plastic recycling market is experiencing robust growth, driven by increasing environmental concerns, stringent regulations on plastic waste, and the rising demand for sustainable materials. The 7.03% CAGR projected from 2025 to 2033 indicates a significant expansion, fueled by advancements in recycling technologies and the growing adoption of recycled plastics across various sectors. Key drivers include the increasing cost of virgin plastics, heightened consumer awareness of environmental issues, and government initiatives promoting circular economy models. The market is segmented by plastic type (Polycarbonate, PET, ABS/SAN, Polyamide, and others) and end-user industry (packaging, industrial yarn, electrical & electronics, and others). PET and Polycarbonate are expected to dominate the market due to their widespread use and established recycling infrastructure, while the demand for recycled ABS/SAN and Polyamide is rapidly growing due to their application in high-value products like automotive components and electronics. Geographical regions such as North America and Europe, with mature recycling infrastructure and stringent environmental policies, currently hold a larger market share. However, the Asia-Pacific region, driven by rapid industrialization and burgeoning populations, presents a significant growth opportunity in the coming years. Challenges remain, including the cost-effectiveness of recycling certain types of engineering plastics and the need for further technological advancements to improve recycling efficiency and quality.
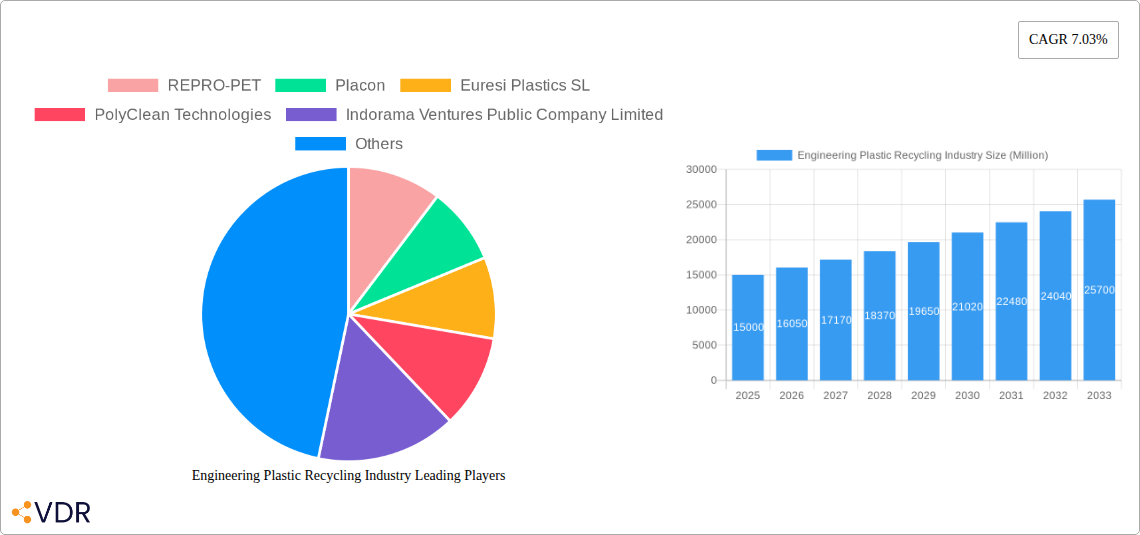
The competitive landscape is characterized by a mix of large multinational corporations and specialized recycling companies. Major players like Indorama Ventures, Reliance Industries, and Krones AG are investing heavily in expanding their recycling capacities and developing innovative recycling technologies. Smaller companies, focused on niche applications or specialized plastic types, are also playing a crucial role in driving innovation and market expansion. The market's future growth trajectory will depend on the continued development of efficient and cost-effective recycling technologies, the establishment of robust collection and sorting infrastructure, and supportive government policies that incentivize the use of recycled engineering plastics. The focus on developing high-quality recycled materials that meet the performance standards of virgin plastics is key to unlocking further market potential. This will further propel growth and adoption of recycled engineering plastics across various industries.
Engineering Plastic Recycling Industry: A Comprehensive Market Report (2019-2033)
This comprehensive report provides an in-depth analysis of the Engineering Plastic Recycling industry, encompassing market dynamics, growth trends, regional landscapes, key players, and future outlook. The study period covers 2019-2033, with 2025 as the base year and a forecast period of 2025-2033. The report segments the market by plastic type (Polycarbonate, Polyethylene Terephthalate (PET), Styrene Copolymers (ABS and SAN), Polyamide, Other Engineering Plastics) and end-user industry (Packaging, Industrial Yarn, Electrical and Electronics, Other End-user Industries). This detailed analysis is crucial for businesses, investors, and policymakers navigating this rapidly evolving sector.
Engineering Plastic Recycling Industry Market Dynamics & Structure
The Engineering Plastic Recycling market is experiencing significant growth driven by stringent environmental regulations, increasing consumer awareness of plastic waste, and technological advancements in recycling processes. Market concentration is moderate, with several large players and numerous smaller, specialized recyclers. Technological innovation, particularly in chemical recycling and advanced sorting technologies, is a key driver, while regulatory frameworks (e.g., Extended Producer Responsibility schemes) are shaping industry practices. Competition from virgin plastic remains a significant challenge, although the price gap is narrowing. Mergers and acquisitions (M&A) are prevalent, with larger companies seeking to expand their capacity and geographical reach. The market is also experiencing increased investments in research & development (R&D) for new recycling techniques.
- Market Concentration: Moderately concentrated, with a xx% market share held by the top 5 players.
- M&A Activity: xx deals recorded between 2019 and 2024, with an average deal value of xx million.
- Innovation Barriers: High capital expenditure requirements for new technologies, lack of standardized recycling processes, and inconsistent quality of recycled materials.
- Regulatory Landscape: Increasingly stringent regulations globally, particularly regarding plastic waste management and recycled content mandates.
- End-user Demographics: Growing demand from environmentally conscious consumers and brands committed to sustainability initiatives.
Engineering Plastic Recycling Industry Growth Trends & Insights
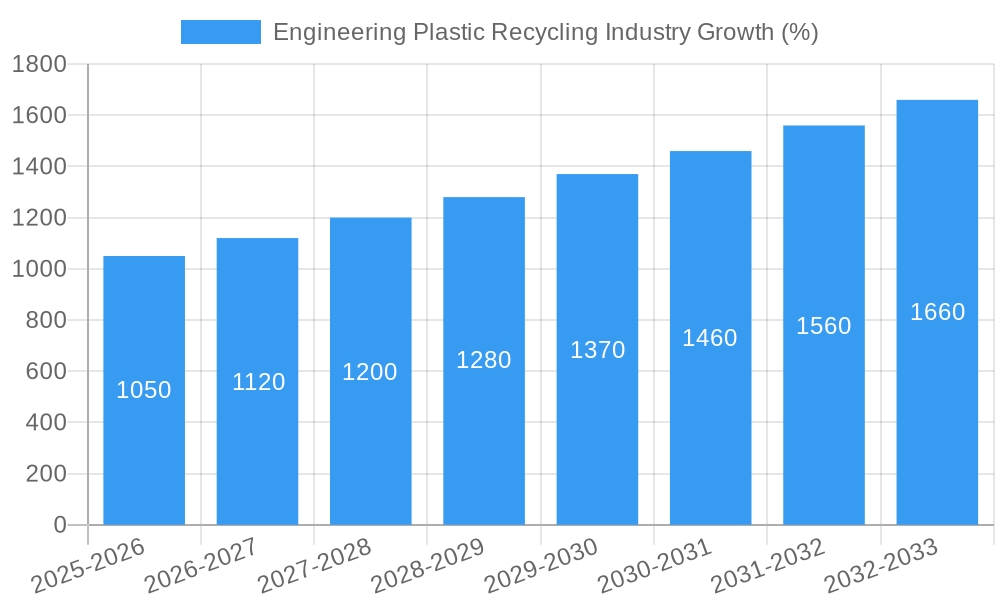
The global engineering plastic recycling market is exhibiting robust growth, fueled by rising environmental concerns and the increasing adoption of circular economy principles. The market size is projected to reach xx million by 2025 and xx million by 2033, registering a CAGR of xx% during the forecast period. This growth is attributed to several factors, including technological advancements in recycling processes, rising demand for recycled plastics across various industries, and supportive government policies promoting sustainable waste management practices. The adoption rate of recycled engineering plastics is steadily increasing across various end-use sectors, driven by cost savings, environmental benefits, and improved material performance. Technological disruptions, such as the introduction of chemical recycling methods, are further accelerating market growth and expanding the range of recyclable plastics. Consumer behaviour is shifting towards more sustainable choices, driving demand for recycled plastic products.
Dominant Regions, Countries, or Segments in Engineering Plastic Recycling Industry
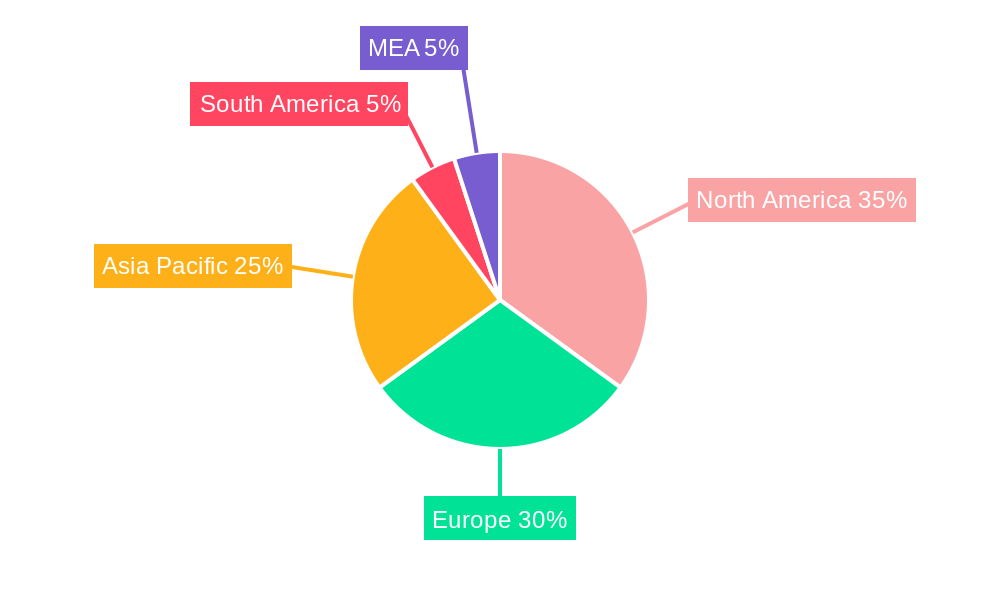
The European Union and North America are currently the leading regions in the engineering plastics recycling market due to stringent environmental regulations and well-established recycling infrastructure. Within these regions, Germany, the United Kingdom, and the United States are key players. However, Asia-Pacific is experiencing rapid growth, driven by increasing industrialization and growing environmental awareness. The PET segment holds the largest market share due to its high recyclability and widespread applications in packaging. The Packaging end-use industry is the major consumer of recycled engineering plastics.
- Key Drivers:
- Stringent environmental regulations (e.g., EU Plastic Strategy)
- Growing demand for sustainable packaging solutions
- Increasing investment in recycling infrastructure
- Government incentives and subsidies for recycled plastic usage.
- Dominant Segments: Polyethylene Terephthalate (PET) (xx million in 2025) and Packaging (xx million in 2025) hold the largest market shares.
Engineering Plastic Recycling Industry Product Landscape
The engineering plastic recycling industry offers a diverse range of recycled materials, tailored to meet specific end-use requirements. Continuous advancements in sorting and processing technologies result in higher quality recycled plastics, enabling their use in demanding applications like automotive parts and electronics. Key product innovations include enhanced mechanical properties, improved color stability, and greater consistency in material properties, addressing previous limitations associated with recycled plastics. These improvements are achieved through various processing techniques and material blends, resulting in products that are cost-competitive with virgin plastics while offering significant environmental benefits.
Key Drivers, Barriers & Challenges in Engineering Plastic Recycling Industry
Key Drivers:
- Increasing environmental regulations and consumer pressure for sustainability.
- Growing demand for recycled plastics from various industries.
- Technological advancements improving the quality and efficiency of recycling processes.
- Economic incentives and subsidies provided by governments to promote recycling.
Key Challenges:
- High capital investment required for advanced recycling technologies.
- Inconsistent quality of collected plastic waste, leading to processing challenges.
- Competition from cheaper virgin plastics remains a barrier.
- Lack of a fully circular economy infrastructure with significant gaps in collection and sorting.
Emerging Opportunities in Engineering Plastic Recycling Industry
The engineering plastic recycling industry presents significant emerging opportunities, including the expansion into new applications, the development of innovative technologies, and tapping into new and growing markets. The use of recycled plastics in construction materials and textiles represents substantial untapped potential. Advances in chemical recycling hold promise for breaking down complex plastics previously considered non-recyclable. Furthermore, the increasing awareness of the environmental impact of plastic waste and the related consumer preference towards eco-friendly solutions drives demand for more high-quality recycled plastics.
Growth Accelerators in the Engineering Plastic Recycling Industry Industry
Long-term growth is driven by several factors: continued advancements in recycling technologies that enable the processing of a wider range of plastics; strategic partnerships between recycling companies, brand owners, and retailers to enhance supply chains; and expansion into new geographical markets with growing environmental awareness and supportive government policies. These catalysts will accelerate the transition towards a truly circular economy for engineering plastics, unlocking significant economic and environmental benefits.
Key Players Shaping the Engineering Plastic Recycling Industry Market
- REPRO-PET
- Placon
- Euresi Plastics SL
- PolyClean Technologies
- Indorama Ventures Public Company Limited
- Reliance Industries Limited
- Krones AG
- Petco
- Clean Tech UK Ltd
- JFC Group
- Far Eastern New Century Corporation (Phoenix Technologies)
- TEIJIN LIMITED
- UltrePET LLC
- Alpek S A B de C V
- EF Plastics UK Ltd
Notable Milestones in Engineering Plastic Recycling Industry Sector
- February 2022: Indorama Ventures announced the acquisition of UCY Polymers CZ s.r.o. (UCY), a Czech Republic-based PET plastic recycler, increasing its annual PET bottle recycling capacity by approximately 1.12 billion units by 2025.
- October 2022: Indorama Ventures opened a PET Value bottle-to-bottle recycling plant in the Philippines in partnership with Coca-Cola Beverages Philippines, significantly boosting PET recycling capacity in the region.
In-Depth Engineering Plastic Recycling Industry Market Outlook
The future of the engineering plastic recycling industry is bright, driven by ongoing technological innovation, increasing environmental awareness, and supportive regulatory frameworks. Strategic partnerships and collaborations across the value chain will be crucial for scaling up recycling operations and creating a truly circular economy. The industry's focus on developing high-quality recycled plastics and expanding into new applications will unlock significant opportunities for growth and contribute to a more sustainable future. The market is poised for substantial expansion, particularly in developing economies with growing plastic waste challenges and increasing demand for sustainable materials.
Engineering Plastic Recycling Industry Segmentation
-
1. Plastic Type
- 1.1. Polycarbonate
- 1.2. Polyethylene Terephthalate (PET)
- 1.3. Styrene Copolymers (ABS and SAN)
- 1.4. Polyamide
- 1.5. Other Engineering Plastics
-
2. End-user Industry
- 2.1. Packaging
- 2.2. Industrial Yarn
- 2.3. Electrical and Electronics
- 2.4. Other End-user Industries
Engineering Plastic Recycling Industry Segmentation By Geography
-
1. Asia Pacific
- 1.1. China
- 1.2. India
- 1.3. Japan
- 1.4. South Korea
- 1.5. Rest of Asia Pacific
-
2. North America
- 2.1. United States
- 2.2. Canada
- 2.3. Mexico
-
3. Europe
- 3.1. Germany
- 3.2. United Kingdom
- 3.3. France
- 3.4. Italy
- 3.5. Rest of Europe
-
4. Rest of the World
- 4.1. South America
- 4.2. Middle East and Africa
Engineering Plastic Recycling Industry REPORT HIGHLIGHTS
| Aspects | Details |
|---|---|
| Study Period | 2019-2033 |
| Base Year | 2024 |
| Estimated Year | 2025 |
| Forecast Period | 2025-2033 |
| Historical Period | 2019-2024 |
| Growth Rate | CAGR of 7.03% from 2019-2033 |
| Segmentation |
|
Table of Contents
- 1. Introduction
- 1.1. Research Scope
- 1.2. Market Segmentation
- 1.3. Research Methodology
- 1.4. Definitions and Assumptions
- 2. Executive Summary
- 2.1. Introduction
- 3. Market Dynamics
- 3.1. Introduction
- 3.2. Market Drivers
- 3.2.1. Growing Emphasis on Sustainability among Consumer and Packaging Products; Increasing Use of Recycled Polyester; Other Drivers
- 3.3. Market Restrains
- 3.3.1. Difficulty in Collecting and Sorting Mixed Plastic; Other Restraints
- 3.4. Market Trends
- 3.4.1. Packaging Industry to Dominate the Market
- 4. Market Factor Analysis
- 4.1. Porters Five Forces
- 4.2. Supply/Value Chain
- 4.3. PESTEL analysis
- 4.4. Market Entropy
- 4.5. Patent/Trademark Analysis
- 5. Global Engineering Plastic Recycling Industry Analysis, Insights and Forecast, 2019-2031
- 5.1. Market Analysis, Insights and Forecast - by Plastic Type
- 5.1.1. Polycarbonate
- 5.1.2. Polyethylene Terephthalate (PET)
- 5.1.3. Styrene Copolymers (ABS and SAN)
- 5.1.4. Polyamide
- 5.1.5. Other Engineering Plastics
- 5.2. Market Analysis, Insights and Forecast - by End-user Industry
- 5.2.1. Packaging
- 5.2.2. Industrial Yarn
- 5.2.3. Electrical and Electronics
- 5.2.4. Other End-user Industries
- 5.3. Market Analysis, Insights and Forecast - by Region
- 5.3.1. Asia Pacific
- 5.3.2. North America
- 5.3.3. Europe
- 5.3.4. Rest of the World
- 5.1. Market Analysis, Insights and Forecast - by Plastic Type
- 6. Asia Pacific Engineering Plastic Recycling Industry Analysis, Insights and Forecast, 2019-2031
- 6.1. Market Analysis, Insights and Forecast - by Plastic Type
- 6.1.1. Polycarbonate
- 6.1.2. Polyethylene Terephthalate (PET)
- 6.1.3. Styrene Copolymers (ABS and SAN)
- 6.1.4. Polyamide
- 6.1.5. Other Engineering Plastics
- 6.2. Market Analysis, Insights and Forecast - by End-user Industry
- 6.2.1. Packaging
- 6.2.2. Industrial Yarn
- 6.2.3. Electrical and Electronics
- 6.2.4. Other End-user Industries
- 6.1. Market Analysis, Insights and Forecast - by Plastic Type
- 7. North America Engineering Plastic Recycling Industry Analysis, Insights and Forecast, 2019-2031
- 7.1. Market Analysis, Insights and Forecast - by Plastic Type
- 7.1.1. Polycarbonate
- 7.1.2. Polyethylene Terephthalate (PET)
- 7.1.3. Styrene Copolymers (ABS and SAN)
- 7.1.4. Polyamide
- 7.1.5. Other Engineering Plastics
- 7.2. Market Analysis, Insights and Forecast - by End-user Industry
- 7.2.1. Packaging
- 7.2.2. Industrial Yarn
- 7.2.3. Electrical and Electronics
- 7.2.4. Other End-user Industries
- 7.1. Market Analysis, Insights and Forecast - by Plastic Type
- 8. Europe Engineering Plastic Recycling Industry Analysis, Insights and Forecast, 2019-2031
- 8.1. Market Analysis, Insights and Forecast - by Plastic Type
- 8.1.1. Polycarbonate
- 8.1.2. Polyethylene Terephthalate (PET)
- 8.1.3. Styrene Copolymers (ABS and SAN)
- 8.1.4. Polyamide
- 8.1.5. Other Engineering Plastics
- 8.2. Market Analysis, Insights and Forecast - by End-user Industry
- 8.2.1. Packaging
- 8.2.2. Industrial Yarn
- 8.2.3. Electrical and Electronics
- 8.2.4. Other End-user Industries
- 8.1. Market Analysis, Insights and Forecast - by Plastic Type
- 9. Rest of the World Engineering Plastic Recycling Industry Analysis, Insights and Forecast, 2019-2031
- 9.1. Market Analysis, Insights and Forecast - by Plastic Type
- 9.1.1. Polycarbonate
- 9.1.2. Polyethylene Terephthalate (PET)
- 9.1.3. Styrene Copolymers (ABS and SAN)
- 9.1.4. Polyamide
- 9.1.5. Other Engineering Plastics
- 9.2. Market Analysis, Insights and Forecast - by End-user Industry
- 9.2.1. Packaging
- 9.2.2. Industrial Yarn
- 9.2.3. Electrical and Electronics
- 9.2.4. Other End-user Industries
- 9.1. Market Analysis, Insights and Forecast - by Plastic Type
- 10. North America Engineering Plastic Recycling Industry Analysis, Insights and Forecast, 2019-2031
- 10.1. Market Analysis, Insights and Forecast - By Country/Sub-region
- 10.1.1 United States
- 10.1.2 Canada
- 10.1.3 Mexico
- 11. Europe Engineering Plastic Recycling Industry Analysis, Insights and Forecast, 2019-2031
- 11.1. Market Analysis, Insights and Forecast - By Country/Sub-region
- 11.1.1 Germany
- 11.1.2 France
- 11.1.3 Italy
- 11.1.4 United Kingdom
- 11.1.5 Netherlands
- 11.1.6 Rest of Europe
- 12. Asia Pacific Engineering Plastic Recycling Industry Analysis, Insights and Forecast, 2019-2031
- 12.1. Market Analysis, Insights and Forecast - By Country/Sub-region
- 12.1.1 China
- 12.1.2 Japan
- 12.1.3 India
- 12.1.4 South Korea
- 12.1.5 Taiwan
- 12.1.6 Australia
- 12.1.7 Rest of Asia-Pacific
- 13. South America Engineering Plastic Recycling Industry Analysis, Insights and Forecast, 2019-2031
- 13.1. Market Analysis, Insights and Forecast - By Country/Sub-region
- 13.1.1 Brazil
- 13.1.2 Argentina
- 13.1.3 Rest of South America
- 14. MEA Engineering Plastic Recycling Industry Analysis, Insights and Forecast, 2019-2031
- 14.1. Market Analysis, Insights and Forecast - By Country/Sub-region
- 14.1.1 Middle East
- 14.1.2 Africa
- 15. Competitive Analysis
- 15.1. Global Market Share Analysis 2024
- 15.2. Company Profiles
- 15.2.1 REPRO-PET
- 15.2.1.1. Overview
- 15.2.1.2. Products
- 15.2.1.3. SWOT Analysis
- 15.2.1.4. Recent Developments
- 15.2.1.5. Financials (Based on Availability)
- 15.2.2 Placon
- 15.2.2.1. Overview
- 15.2.2.2. Products
- 15.2.2.3. SWOT Analysis
- 15.2.2.4. Recent Developments
- 15.2.2.5. Financials (Based on Availability)
- 15.2.3 Euresi Plastics SL
- 15.2.3.1. Overview
- 15.2.3.2. Products
- 15.2.3.3. SWOT Analysis
- 15.2.3.4. Recent Developments
- 15.2.3.5. Financials (Based on Availability)
- 15.2.4 PolyClean Technologies
- 15.2.4.1. Overview
- 15.2.4.2. Products
- 15.2.4.3. SWOT Analysis
- 15.2.4.4. Recent Developments
- 15.2.4.5. Financials (Based on Availability)
- 15.2.5 Indorama Ventures Public Company Limited
- 15.2.5.1. Overview
- 15.2.5.2. Products
- 15.2.5.3. SWOT Analysis
- 15.2.5.4. Recent Developments
- 15.2.5.5. Financials (Based on Availability)
- 15.2.6 Reliance Industries Limited
- 15.2.6.1. Overview
- 15.2.6.2. Products
- 15.2.6.3. SWOT Analysis
- 15.2.6.4. Recent Developments
- 15.2.6.5. Financials (Based on Availability)
- 15.2.7 Krones AG
- 15.2.7.1. Overview
- 15.2.7.2. Products
- 15.2.7.3. SWOT Analysis
- 15.2.7.4. Recent Developments
- 15.2.7.5. Financials (Based on Availability)
- 15.2.8 Petco
- 15.2.8.1. Overview
- 15.2.8.2. Products
- 15.2.8.3. SWOT Analysis
- 15.2.8.4. Recent Developments
- 15.2.8.5. Financials (Based on Availability)
- 15.2.9 Clean Tech UK Ltd
- 15.2.9.1. Overview
- 15.2.9.2. Products
- 15.2.9.3. SWOT Analysis
- 15.2.9.4. Recent Developments
- 15.2.9.5. Financials (Based on Availability)
- 15.2.10 JFC Group
- 15.2.10.1. Overview
- 15.2.10.2. Products
- 15.2.10.3. SWOT Analysis
- 15.2.10.4. Recent Developments
- 15.2.10.5. Financials (Based on Availability)
- 15.2.11 Far Eastern New Century Corporation (Phoenix Technologies)
- 15.2.11.1. Overview
- 15.2.11.2. Products
- 15.2.11.3. SWOT Analysis
- 15.2.11.4. Recent Developments
- 15.2.11.5. Financials (Based on Availability)
- 15.2.12 TEIJIN LIMITED
- 15.2.12.1. Overview
- 15.2.12.2. Products
- 15.2.12.3. SWOT Analysis
- 15.2.12.4. Recent Developments
- 15.2.12.5. Financials (Based on Availability)
- 15.2.13 UltrePET LLC
- 15.2.13.1. Overview
- 15.2.13.2. Products
- 15.2.13.3. SWOT Analysis
- 15.2.13.4. Recent Developments
- 15.2.13.5. Financials (Based on Availability)
- 15.2.14 Alpek S A B de C V
- 15.2.14.1. Overview
- 15.2.14.2. Products
- 15.2.14.3. SWOT Analysis
- 15.2.14.4. Recent Developments
- 15.2.14.5. Financials (Based on Availability)
- 15.2.15 EF Plastics UK Ltd
- 15.2.15.1. Overview
- 15.2.15.2. Products
- 15.2.15.3. SWOT Analysis
- 15.2.15.4. Recent Developments
- 15.2.15.5. Financials (Based on Availability)
- 15.2.1 REPRO-PET
List of Figures
- Figure 1: Global Engineering Plastic Recycling Industry Revenue Breakdown (Million, %) by Region 2024 & 2032
- Figure 2: Global Engineering Plastic Recycling Industry Volume Breakdown (K Tons, %) by Region 2024 & 2032
- Figure 3: North America Engineering Plastic Recycling Industry Revenue (Million), by Country 2024 & 2032
- Figure 4: North America Engineering Plastic Recycling Industry Volume (K Tons), by Country 2024 & 2032
- Figure 5: North America Engineering Plastic Recycling Industry Revenue Share (%), by Country 2024 & 2032
- Figure 6: North America Engineering Plastic Recycling Industry Volume Share (%), by Country 2024 & 2032
- Figure 7: Europe Engineering Plastic Recycling Industry Revenue (Million), by Country 2024 & 2032
- Figure 8: Europe Engineering Plastic Recycling Industry Volume (K Tons), by Country 2024 & 2032
- Figure 9: Europe Engineering Plastic Recycling Industry Revenue Share (%), by Country 2024 & 2032
- Figure 10: Europe Engineering Plastic Recycling Industry Volume Share (%), by Country 2024 & 2032
- Figure 11: Asia Pacific Engineering Plastic Recycling Industry Revenue (Million), by Country 2024 & 2032
- Figure 12: Asia Pacific Engineering Plastic Recycling Industry Volume (K Tons), by Country 2024 & 2032
- Figure 13: Asia Pacific Engineering Plastic Recycling Industry Revenue Share (%), by Country 2024 & 2032
- Figure 14: Asia Pacific Engineering Plastic Recycling Industry Volume Share (%), by Country 2024 & 2032
- Figure 15: South America Engineering Plastic Recycling Industry Revenue (Million), by Country 2024 & 2032
- Figure 16: South America Engineering Plastic Recycling Industry Volume (K Tons), by Country 2024 & 2032
- Figure 17: South America Engineering Plastic Recycling Industry Revenue Share (%), by Country 2024 & 2032
- Figure 18: South America Engineering Plastic Recycling Industry Volume Share (%), by Country 2024 & 2032
- Figure 19: MEA Engineering Plastic Recycling Industry Revenue (Million), by Country 2024 & 2032
- Figure 20: MEA Engineering Plastic Recycling Industry Volume (K Tons), by Country 2024 & 2032
- Figure 21: MEA Engineering Plastic Recycling Industry Revenue Share (%), by Country 2024 & 2032
- Figure 22: MEA Engineering Plastic Recycling Industry Volume Share (%), by Country 2024 & 2032
- Figure 23: Asia Pacific Engineering Plastic Recycling Industry Revenue (Million), by Plastic Type 2024 & 2032
- Figure 24: Asia Pacific Engineering Plastic Recycling Industry Volume (K Tons), by Plastic Type 2024 & 2032
- Figure 25: Asia Pacific Engineering Plastic Recycling Industry Revenue Share (%), by Plastic Type 2024 & 2032
- Figure 26: Asia Pacific Engineering Plastic Recycling Industry Volume Share (%), by Plastic Type 2024 & 2032
- Figure 27: Asia Pacific Engineering Plastic Recycling Industry Revenue (Million), by End-user Industry 2024 & 2032
- Figure 28: Asia Pacific Engineering Plastic Recycling Industry Volume (K Tons), by End-user Industry 2024 & 2032
- Figure 29: Asia Pacific Engineering Plastic Recycling Industry Revenue Share (%), by End-user Industry 2024 & 2032
- Figure 30: Asia Pacific Engineering Plastic Recycling Industry Volume Share (%), by End-user Industry 2024 & 2032
- Figure 31: Asia Pacific Engineering Plastic Recycling Industry Revenue (Million), by Country 2024 & 2032
- Figure 32: Asia Pacific Engineering Plastic Recycling Industry Volume (K Tons), by Country 2024 & 2032
- Figure 33: Asia Pacific Engineering Plastic Recycling Industry Revenue Share (%), by Country 2024 & 2032
- Figure 34: Asia Pacific Engineering Plastic Recycling Industry Volume Share (%), by Country 2024 & 2032
- Figure 35: North America Engineering Plastic Recycling Industry Revenue (Million), by Plastic Type 2024 & 2032
- Figure 36: North America Engineering Plastic Recycling Industry Volume (K Tons), by Plastic Type 2024 & 2032
- Figure 37: North America Engineering Plastic Recycling Industry Revenue Share (%), by Plastic Type 2024 & 2032
- Figure 38: North America Engineering Plastic Recycling Industry Volume Share (%), by Plastic Type 2024 & 2032
- Figure 39: North America Engineering Plastic Recycling Industry Revenue (Million), by End-user Industry 2024 & 2032
- Figure 40: North America Engineering Plastic Recycling Industry Volume (K Tons), by End-user Industry 2024 & 2032
- Figure 41: North America Engineering Plastic Recycling Industry Revenue Share (%), by End-user Industry 2024 & 2032
- Figure 42: North America Engineering Plastic Recycling Industry Volume Share (%), by End-user Industry 2024 & 2032
- Figure 43: North America Engineering Plastic Recycling Industry Revenue (Million), by Country 2024 & 2032
- Figure 44: North America Engineering Plastic Recycling Industry Volume (K Tons), by Country 2024 & 2032
- Figure 45: North America Engineering Plastic Recycling Industry Revenue Share (%), by Country 2024 & 2032
- Figure 46: North America Engineering Plastic Recycling Industry Volume Share (%), by Country 2024 & 2032
- Figure 47: Europe Engineering Plastic Recycling Industry Revenue (Million), by Plastic Type 2024 & 2032
- Figure 48: Europe Engineering Plastic Recycling Industry Volume (K Tons), by Plastic Type 2024 & 2032
- Figure 49: Europe Engineering Plastic Recycling Industry Revenue Share (%), by Plastic Type 2024 & 2032
- Figure 50: Europe Engineering Plastic Recycling Industry Volume Share (%), by Plastic Type 2024 & 2032
- Figure 51: Europe Engineering Plastic Recycling Industry Revenue (Million), by End-user Industry 2024 & 2032
- Figure 52: Europe Engineering Plastic Recycling Industry Volume (K Tons), by End-user Industry 2024 & 2032
- Figure 53: Europe Engineering Plastic Recycling Industry Revenue Share (%), by End-user Industry 2024 & 2032
- Figure 54: Europe Engineering Plastic Recycling Industry Volume Share (%), by End-user Industry 2024 & 2032
- Figure 55: Europe Engineering Plastic Recycling Industry Revenue (Million), by Country 2024 & 2032
- Figure 56: Europe Engineering Plastic Recycling Industry Volume (K Tons), by Country 2024 & 2032
- Figure 57: Europe Engineering Plastic Recycling Industry Revenue Share (%), by Country 2024 & 2032
- Figure 58: Europe Engineering Plastic Recycling Industry Volume Share (%), by Country 2024 & 2032
- Figure 59: Rest of the World Engineering Plastic Recycling Industry Revenue (Million), by Plastic Type 2024 & 2032
- Figure 60: Rest of the World Engineering Plastic Recycling Industry Volume (K Tons), by Plastic Type 2024 & 2032
- Figure 61: Rest of the World Engineering Plastic Recycling Industry Revenue Share (%), by Plastic Type 2024 & 2032
- Figure 62: Rest of the World Engineering Plastic Recycling Industry Volume Share (%), by Plastic Type 2024 & 2032
- Figure 63: Rest of the World Engineering Plastic Recycling Industry Revenue (Million), by End-user Industry 2024 & 2032
- Figure 64: Rest of the World Engineering Plastic Recycling Industry Volume (K Tons), by End-user Industry 2024 & 2032
- Figure 65: Rest of the World Engineering Plastic Recycling Industry Revenue Share (%), by End-user Industry 2024 & 2032
- Figure 66: Rest of the World Engineering Plastic Recycling Industry Volume Share (%), by End-user Industry 2024 & 2032
- Figure 67: Rest of the World Engineering Plastic Recycling Industry Revenue (Million), by Country 2024 & 2032
- Figure 68: Rest of the World Engineering Plastic Recycling Industry Volume (K Tons), by Country 2024 & 2032
- Figure 69: Rest of the World Engineering Plastic Recycling Industry Revenue Share (%), by Country 2024 & 2032
- Figure 70: Rest of the World Engineering Plastic Recycling Industry Volume Share (%), by Country 2024 & 2032
List of Tables
- Table 1: Global Engineering Plastic Recycling Industry Revenue Million Forecast, by Region 2019 & 2032
- Table 2: Global Engineering Plastic Recycling Industry Volume K Tons Forecast, by Region 2019 & 2032
- Table 3: Global Engineering Plastic Recycling Industry Revenue Million Forecast, by Plastic Type 2019 & 2032
- Table 4: Global Engineering Plastic Recycling Industry Volume K Tons Forecast, by Plastic Type 2019 & 2032
- Table 5: Global Engineering Plastic Recycling Industry Revenue Million Forecast, by End-user Industry 2019 & 2032
- Table 6: Global Engineering Plastic Recycling Industry Volume K Tons Forecast, by End-user Industry 2019 & 2032
- Table 7: Global Engineering Plastic Recycling Industry Revenue Million Forecast, by Region 2019 & 2032
- Table 8: Global Engineering Plastic Recycling Industry Volume K Tons Forecast, by Region 2019 & 2032
- Table 9: Global Engineering Plastic Recycling Industry Revenue Million Forecast, by Country 2019 & 2032
- Table 10: Global Engineering Plastic Recycling Industry Volume K Tons Forecast, by Country 2019 & 2032
- Table 11: United States Engineering Plastic Recycling Industry Revenue (Million) Forecast, by Application 2019 & 2032
- Table 12: United States Engineering Plastic Recycling Industry Volume (K Tons) Forecast, by Application 2019 & 2032
- Table 13: Canada Engineering Plastic Recycling Industry Revenue (Million) Forecast, by Application 2019 & 2032
- Table 14: Canada Engineering Plastic Recycling Industry Volume (K Tons) Forecast, by Application 2019 & 2032
- Table 15: Mexico Engineering Plastic Recycling Industry Revenue (Million) Forecast, by Application 2019 & 2032
- Table 16: Mexico Engineering Plastic Recycling Industry Volume (K Tons) Forecast, by Application 2019 & 2032
- Table 17: Global Engineering Plastic Recycling Industry Revenue Million Forecast, by Country 2019 & 2032
- Table 18: Global Engineering Plastic Recycling Industry Volume K Tons Forecast, by Country 2019 & 2032
- Table 19: Germany Engineering Plastic Recycling Industry Revenue (Million) Forecast, by Application 2019 & 2032
- Table 20: Germany Engineering Plastic Recycling Industry Volume (K Tons) Forecast, by Application 2019 & 2032
- Table 21: France Engineering Plastic Recycling Industry Revenue (Million) Forecast, by Application 2019 & 2032
- Table 22: France Engineering Plastic Recycling Industry Volume (K Tons) Forecast, by Application 2019 & 2032
- Table 23: Italy Engineering Plastic Recycling Industry Revenue (Million) Forecast, by Application 2019 & 2032
- Table 24: Italy Engineering Plastic Recycling Industry Volume (K Tons) Forecast, by Application 2019 & 2032
- Table 25: United Kingdom Engineering Plastic Recycling Industry Revenue (Million) Forecast, by Application 2019 & 2032
- Table 26: United Kingdom Engineering Plastic Recycling Industry Volume (K Tons) Forecast, by Application 2019 & 2032
- Table 27: Netherlands Engineering Plastic Recycling Industry Revenue (Million) Forecast, by Application 2019 & 2032
- Table 28: Netherlands Engineering Plastic Recycling Industry Volume (K Tons) Forecast, by Application 2019 & 2032
- Table 29: Rest of Europe Engineering Plastic Recycling Industry Revenue (Million) Forecast, by Application 2019 & 2032
- Table 30: Rest of Europe Engineering Plastic Recycling Industry Volume (K Tons) Forecast, by Application 2019 & 2032
- Table 31: Global Engineering Plastic Recycling Industry Revenue Million Forecast, by Country 2019 & 2032
- Table 32: Global Engineering Plastic Recycling Industry Volume K Tons Forecast, by Country 2019 & 2032
- Table 33: China Engineering Plastic Recycling Industry Revenue (Million) Forecast, by Application 2019 & 2032
- Table 34: China Engineering Plastic Recycling Industry Volume (K Tons) Forecast, by Application 2019 & 2032
- Table 35: Japan Engineering Plastic Recycling Industry Revenue (Million) Forecast, by Application 2019 & 2032
- Table 36: Japan Engineering Plastic Recycling Industry Volume (K Tons) Forecast, by Application 2019 & 2032
- Table 37: India Engineering Plastic Recycling Industry Revenue (Million) Forecast, by Application 2019 & 2032
- Table 38: India Engineering Plastic Recycling Industry Volume (K Tons) Forecast, by Application 2019 & 2032
- Table 39: South Korea Engineering Plastic Recycling Industry Revenue (Million) Forecast, by Application 2019 & 2032
- Table 40: South Korea Engineering Plastic Recycling Industry Volume (K Tons) Forecast, by Application 2019 & 2032
- Table 41: Taiwan Engineering Plastic Recycling Industry Revenue (Million) Forecast, by Application 2019 & 2032
- Table 42: Taiwan Engineering Plastic Recycling Industry Volume (K Tons) Forecast, by Application 2019 & 2032
- Table 43: Australia Engineering Plastic Recycling Industry Revenue (Million) Forecast, by Application 2019 & 2032
- Table 44: Australia Engineering Plastic Recycling Industry Volume (K Tons) Forecast, by Application 2019 & 2032
- Table 45: Rest of Asia-Pacific Engineering Plastic Recycling Industry Revenue (Million) Forecast, by Application 2019 & 2032
- Table 46: Rest of Asia-Pacific Engineering Plastic Recycling Industry Volume (K Tons) Forecast, by Application 2019 & 2032
- Table 47: Global Engineering Plastic Recycling Industry Revenue Million Forecast, by Country 2019 & 2032
- Table 48: Global Engineering Plastic Recycling Industry Volume K Tons Forecast, by Country 2019 & 2032
- Table 49: Brazil Engineering Plastic Recycling Industry Revenue (Million) Forecast, by Application 2019 & 2032
- Table 50: Brazil Engineering Plastic Recycling Industry Volume (K Tons) Forecast, by Application 2019 & 2032
- Table 51: Argentina Engineering Plastic Recycling Industry Revenue (Million) Forecast, by Application 2019 & 2032
- Table 52: Argentina Engineering Plastic Recycling Industry Volume (K Tons) Forecast, by Application 2019 & 2032
- Table 53: Rest of South America Engineering Plastic Recycling Industry Revenue (Million) Forecast, by Application 2019 & 2032
- Table 54: Rest of South America Engineering Plastic Recycling Industry Volume (K Tons) Forecast, by Application 2019 & 2032
- Table 55: Global Engineering Plastic Recycling Industry Revenue Million Forecast, by Country 2019 & 2032
- Table 56: Global Engineering Plastic Recycling Industry Volume K Tons Forecast, by Country 2019 & 2032
- Table 57: Middle East Engineering Plastic Recycling Industry Revenue (Million) Forecast, by Application 2019 & 2032
- Table 58: Middle East Engineering Plastic Recycling Industry Volume (K Tons) Forecast, by Application 2019 & 2032
- Table 59: Africa Engineering Plastic Recycling Industry Revenue (Million) Forecast, by Application 2019 & 2032
- Table 60: Africa Engineering Plastic Recycling Industry Volume (K Tons) Forecast, by Application 2019 & 2032
- Table 61: Global Engineering Plastic Recycling Industry Revenue Million Forecast, by Plastic Type 2019 & 2032
- Table 62: Global Engineering Plastic Recycling Industry Volume K Tons Forecast, by Plastic Type 2019 & 2032
- Table 63: Global Engineering Plastic Recycling Industry Revenue Million Forecast, by End-user Industry 2019 & 2032
- Table 64: Global Engineering Plastic Recycling Industry Volume K Tons Forecast, by End-user Industry 2019 & 2032
- Table 65: Global Engineering Plastic Recycling Industry Revenue Million Forecast, by Country 2019 & 2032
- Table 66: Global Engineering Plastic Recycling Industry Volume K Tons Forecast, by Country 2019 & 2032
- Table 67: China Engineering Plastic Recycling Industry Revenue (Million) Forecast, by Application 2019 & 2032
- Table 68: China Engineering Plastic Recycling Industry Volume (K Tons) Forecast, by Application 2019 & 2032
- Table 69: India Engineering Plastic Recycling Industry Revenue (Million) Forecast, by Application 2019 & 2032
- Table 70: India Engineering Plastic Recycling Industry Volume (K Tons) Forecast, by Application 2019 & 2032
- Table 71: Japan Engineering Plastic Recycling Industry Revenue (Million) Forecast, by Application 2019 & 2032
- Table 72: Japan Engineering Plastic Recycling Industry Volume (K Tons) Forecast, by Application 2019 & 2032
- Table 73: South Korea Engineering Plastic Recycling Industry Revenue (Million) Forecast, by Application 2019 & 2032
- Table 74: South Korea Engineering Plastic Recycling Industry Volume (K Tons) Forecast, by Application 2019 & 2032
- Table 75: Rest of Asia Pacific Engineering Plastic Recycling Industry Revenue (Million) Forecast, by Application 2019 & 2032
- Table 76: Rest of Asia Pacific Engineering Plastic Recycling Industry Volume (K Tons) Forecast, by Application 2019 & 2032
- Table 77: Global Engineering Plastic Recycling Industry Revenue Million Forecast, by Plastic Type 2019 & 2032
- Table 78: Global Engineering Plastic Recycling Industry Volume K Tons Forecast, by Plastic Type 2019 & 2032
- Table 79: Global Engineering Plastic Recycling Industry Revenue Million Forecast, by End-user Industry 2019 & 2032
- Table 80: Global Engineering Plastic Recycling Industry Volume K Tons Forecast, by End-user Industry 2019 & 2032
- Table 81: Global Engineering Plastic Recycling Industry Revenue Million Forecast, by Country 2019 & 2032
- Table 82: Global Engineering Plastic Recycling Industry Volume K Tons Forecast, by Country 2019 & 2032
- Table 83: United States Engineering Plastic Recycling Industry Revenue (Million) Forecast, by Application 2019 & 2032
- Table 84: United States Engineering Plastic Recycling Industry Volume (K Tons) Forecast, by Application 2019 & 2032
- Table 85: Canada Engineering Plastic Recycling Industry Revenue (Million) Forecast, by Application 2019 & 2032
- Table 86: Canada Engineering Plastic Recycling Industry Volume (K Tons) Forecast, by Application 2019 & 2032
- Table 87: Mexico Engineering Plastic Recycling Industry Revenue (Million) Forecast, by Application 2019 & 2032
- Table 88: Mexico Engineering Plastic Recycling Industry Volume (K Tons) Forecast, by Application 2019 & 2032
- Table 89: Global Engineering Plastic Recycling Industry Revenue Million Forecast, by Plastic Type 2019 & 2032
- Table 90: Global Engineering Plastic Recycling Industry Volume K Tons Forecast, by Plastic Type 2019 & 2032
- Table 91: Global Engineering Plastic Recycling Industry Revenue Million Forecast, by End-user Industry 2019 & 2032
- Table 92: Global Engineering Plastic Recycling Industry Volume K Tons Forecast, by End-user Industry 2019 & 2032
- Table 93: Global Engineering Plastic Recycling Industry Revenue Million Forecast, by Country 2019 & 2032
- Table 94: Global Engineering Plastic Recycling Industry Volume K Tons Forecast, by Country 2019 & 2032
- Table 95: Germany Engineering Plastic Recycling Industry Revenue (Million) Forecast, by Application 2019 & 2032
- Table 96: Germany Engineering Plastic Recycling Industry Volume (K Tons) Forecast, by Application 2019 & 2032
- Table 97: United Kingdom Engineering Plastic Recycling Industry Revenue (Million) Forecast, by Application 2019 & 2032
- Table 98: United Kingdom Engineering Plastic Recycling Industry Volume (K Tons) Forecast, by Application 2019 & 2032
- Table 99: France Engineering Plastic Recycling Industry Revenue (Million) Forecast, by Application 2019 & 2032
- Table 100: France Engineering Plastic Recycling Industry Volume (K Tons) Forecast, by Application 2019 & 2032
- Table 101: Italy Engineering Plastic Recycling Industry Revenue (Million) Forecast, by Application 2019 & 2032
- Table 102: Italy Engineering Plastic Recycling Industry Volume (K Tons) Forecast, by Application 2019 & 2032
- Table 103: Rest of Europe Engineering Plastic Recycling Industry Revenue (Million) Forecast, by Application 2019 & 2032
- Table 104: Rest of Europe Engineering Plastic Recycling Industry Volume (K Tons) Forecast, by Application 2019 & 2032
- Table 105: Global Engineering Plastic Recycling Industry Revenue Million Forecast, by Plastic Type 2019 & 2032
- Table 106: Global Engineering Plastic Recycling Industry Volume K Tons Forecast, by Plastic Type 2019 & 2032
- Table 107: Global Engineering Plastic Recycling Industry Revenue Million Forecast, by End-user Industry 2019 & 2032
- Table 108: Global Engineering Plastic Recycling Industry Volume K Tons Forecast, by End-user Industry 2019 & 2032
- Table 109: Global Engineering Plastic Recycling Industry Revenue Million Forecast, by Country 2019 & 2032
- Table 110: Global Engineering Plastic Recycling Industry Volume K Tons Forecast, by Country 2019 & 2032
- Table 111: South America Engineering Plastic Recycling Industry Revenue (Million) Forecast, by Application 2019 & 2032
- Table 112: South America Engineering Plastic Recycling Industry Volume (K Tons) Forecast, by Application 2019 & 2032
- Table 113: Middle East and Africa Engineering Plastic Recycling Industry Revenue (Million) Forecast, by Application 2019 & 2032
- Table 114: Middle East and Africa Engineering Plastic Recycling Industry Volume (K Tons) Forecast, by Application 2019 & 2032
Frequently Asked Questions
1. What is the projected Compound Annual Growth Rate (CAGR) of the Engineering Plastic Recycling Industry?
The projected CAGR is approximately 7.03%.
2. Which companies are prominent players in the Engineering Plastic Recycling Industry?
Key companies in the market include REPRO-PET, Placon, Euresi Plastics SL, PolyClean Technologies, Indorama Ventures Public Company Limited, Reliance Industries Limited, Krones AG, Petco, Clean Tech UK Ltd, JFC Group, Far Eastern New Century Corporation (Phoenix Technologies), TEIJIN LIMITED, UltrePET LLC, Alpek S A B de C V, EF Plastics UK Ltd.
3. What are the main segments of the Engineering Plastic Recycling Industry?
The market segments include Plastic Type, End-user Industry.
4. Can you provide details about the market size?
The market size is estimated to be USD XX Million as of 2022.
5. What are some drivers contributing to market growth?
Growing Emphasis on Sustainability among Consumer and Packaging Products; Increasing Use of Recycled Polyester; Other Drivers.
6. What are the notable trends driving market growth?
Packaging Industry to Dominate the Market.
7. Are there any restraints impacting market growth?
Difficulty in Collecting and Sorting Mixed Plastic; Other Restraints.
8. Can you provide examples of recent developments in the market?
October 2022: Indorama Venturas announced the opening of a PET Value bottle-to-bottle recycling plant in the Philippines in partnership with Coca-Cola Beverages Philippines.
9. What pricing options are available for accessing the report?
Pricing options include single-user, multi-user, and enterprise licenses priced at USD 4750, USD 5250, and USD 8750 respectively.
10. Is the market size provided in terms of value or volume?
The market size is provided in terms of value, measured in Million and volume, measured in K Tons.
11. Are there any specific market keywords associated with the report?
Yes, the market keyword associated with the report is "Engineering Plastic Recycling Industry," which aids in identifying and referencing the specific market segment covered.
12. How do I determine which pricing option suits my needs best?
The pricing options vary based on user requirements and access needs. Individual users may opt for single-user licenses, while businesses requiring broader access may choose multi-user or enterprise licenses for cost-effective access to the report.
13. Are there any additional resources or data provided in the Engineering Plastic Recycling Industry report?
While the report offers comprehensive insights, it's advisable to review the specific contents or supplementary materials provided to ascertain if additional resources or data are available.
14. How can I stay updated on further developments or reports in the Engineering Plastic Recycling Industry?
To stay informed about further developments, trends, and reports in the Engineering Plastic Recycling Industry, consider subscribing to industry newsletters, following relevant companies and organizations, or regularly checking reputable industry news sources and publications.
Methodology
Step 1 - Identification of Relevant Samples Size from Population Database


Step 2 - Approaches for Defining Global Market Size (Value, Volume* & Price*)

Note*: In applicable scenarios
Step 3 - Data Sources
Primary Research
- Web Analytics
- Survey Reports
- Research Institute
- Latest Research Reports
- Opinion Leaders
Secondary Research
- Annual Reports
- White Paper
- Latest Press Release
- Industry Association
- Paid Database
- Investor Presentations

Step 4 - Data Triangulation
Involves using different sources of information in order to increase the validity of a study
These sources are likely to be stakeholders in a program - participants, other researchers, program staff, other community members, and so on.
Then we put all data in single framework & apply various statistical tools to find out the dynamic on the market.
During the analysis stage, feedback from the stakeholder groups would be compared to determine areas of agreement as well as areas of divergence


