
Key Insights
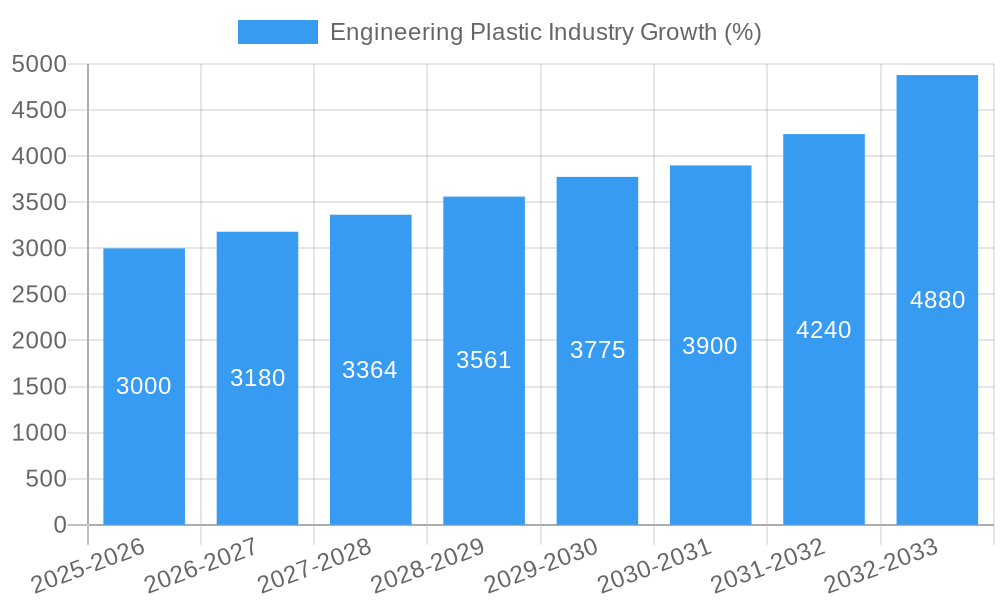
The global engineering plastics market is experiencing robust growth, driven by increasing demand across diverse sectors. The market, estimated at $50 billion in 2025, is projected to exhibit a Compound Annual Growth Rate (CAGR) of 6% from 2025 to 2033, reaching approximately $80 billion by 2033. This expansion is fueled by several key factors. The automotive industry's shift towards lightweighting for improved fuel efficiency is a major driver, with engineering plastics playing a crucial role in replacing traditional materials. Similarly, the burgeoning electronics and electrical sectors, particularly in renewable energy technologies and advanced consumer devices, are significantly contributing to market growth. Furthermore, the construction industry's adoption of high-performance plastics for infrastructure projects and building materials is further boosting demand. The increasing focus on sustainability and the development of bio-based and recyclable engineering plastics are also shaping market trends.
However, market growth faces certain constraints. Fluctuations in raw material prices, particularly oil and gas, can significantly impact profitability and pricing. Moreover, the emergence of alternative materials and potential supply chain disruptions pose challenges. The market is segmented based on polymer type (e.g., polyethylene, polypropylene, polyamide), application (e.g., automotive, electronics, packaging), and geographical region. Key players such as Alfa S A B de C V, BASF SE, Celanese Corporation, and others compete based on product innovation, cost-effectiveness, and market reach. The competitive landscape is characterized by both established industry giants and emerging players focusing on niche applications and sustainable solutions. Future growth will depend on continued technological advancements, strategic partnerships, and adapting to evolving regulatory frameworks related to environmental sustainability.

Engineering Plastic Industry Market Report: 2019-2033
This comprehensive report provides an in-depth analysis of the Engineering Plastic Industry, encompassing market dynamics, growth trends, regional landscapes, product innovations, and key player strategies. The study covers the historical period (2019-2024), the base year (2025), and forecasts until 2033, offering invaluable insights for industry professionals, investors, and strategic decision-makers. The report meticulously examines the parent market (Plastics Industry) and the child markets within engineering plastics, offering granular segmentation analysis. Market values are presented in million units.
Engineering Plastic Industry Market Dynamics & Structure
This section analyzes the competitive landscape, technological advancements, regulatory influences, and market trends shaping the engineering plastics industry. The report assesses market concentration, identifying leading players and their market share percentages. We delve into the impact of technological innovation, exploring both drivers (e.g., advancements in polymer science) and barriers (e.g., high R&D costs). Furthermore, the analysis covers regulatory frameworks impacting production and application, examining the influence of environmental regulations and safety standards. The report also explores the presence and impact of competitive product substitutes and analyzes M&A activities within the industry, providing quantitative data on deal volumes and qualitative assessments of their impact on market structure.
- Market Concentration: The market is moderately concentrated, with the top 5 players holding approximately xx% market share in 2024.
- Technological Innovation: Key drivers include advancements in polymer chemistry leading to higher performance materials. Barriers include high R&D investment and time-to-market challenges.
- Regulatory Framework: Stringent environmental regulations and safety standards drive innovation in sustainable and bio-based materials.
- Competitive Substitutes: Metals and other advanced materials pose competitive challenges.
- End-User Demographics: Automotive, electronics, and healthcare are major end-use segments.
- M&A Trends: xx M&A deals were recorded between 2019 and 2024, primarily focused on expanding product portfolios and geographical reach.
Engineering Plastic Industry Growth Trends & Insights
This section analyzes the evolution of the engineering plastic market size, adoption rates across various end-use sectors, and the influence of technological disruptions on market growth. The report uses comprehensive data to project future market size and penetration rates. It also examines shifts in consumer preferences and their impact on product demand. Specific metrics like CAGR (Compound Annual Growth Rate) and market penetration rates are provided for key segments. The analysis leverages internal market research data (XXX) to provide accurate and detailed insights.
- The global engineering plastic market is expected to reach xx million units by 2033, exhibiting a CAGR of xx% during the forecast period (2025-2033).
- Adoption rates are highest in the automotive and electronics sectors, driven by lightweighting and performance requirements.
- Technological disruptions, like 3D printing and additive manufacturing, are creating new opportunities in specialized applications.
Dominant Regions, Countries, or Segments in Engineering Plastic Industry
This section identifies the leading regions, countries, or segments driving market growth. We analyze the dominance factors, including market share, growth potential, and contributing economic and infrastructural elements. Bullet points highlight key drivers, while paragraphs analyze the underlying factors contributing to regional leadership.
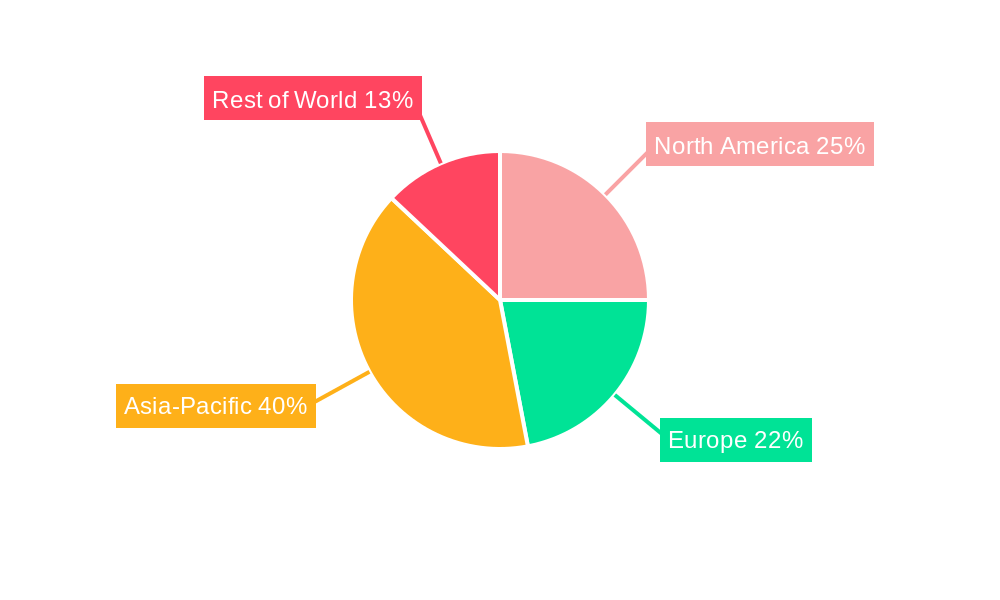
- Leading Region: Asia Pacific is projected to remain the dominant region, driven by strong economic growth and increased manufacturing activity in countries like China and India.
- Key Drivers:
- Rapid industrialization and urbanization.
- Increasing demand from the automotive and electronics industries.
- Favorable government policies promoting manufacturing.
- Growth Potential: Significant growth potential exists in emerging economies with expanding infrastructure development and rising disposable incomes.
Engineering Plastic Industry Product Landscape
This section details the latest innovations in engineering plastics, encompassing material properties, applications, and unique selling propositions. We highlight technological advancements and their impact on product performance, emphasizing advancements in polymer chemistry and processing techniques resulting in superior strength, durability, and lighter weight materials.
Recent innovations include high-performance polymers with enhanced thermal stability, chemical resistance, and biocompatibility for use in demanding applications such as aerospace, medical devices, and electronics. These advancements are further enhanced by innovative manufacturing processes such as 3D printing which enables intricate designs and customized parts.
Key Drivers, Barriers & Challenges in Engineering Plastic Industry
This section outlines the primary factors driving market growth, including technological advancements, economic factors, and supportive government policies. It also analyzes key challenges and restraints, such as supply chain disruptions, regulatory hurdles, and competitive pressures. Quantifiable impacts are provided where data is available.
Key Drivers:
- Technological advancements leading to improved material properties and processing techniques.
- Increasing demand from key end-use sectors such as automotive, electronics, and healthcare.
- Government initiatives promoting the use of lightweight and high-performance materials.
Key Challenges:
- Fluctuations in raw material prices impacting production costs.
- Stringent environmental regulations requiring manufacturers to adopt sustainable practices.
- Intense competition from established players and new entrants.
Emerging Opportunities in Engineering Plastic Industry
This section highlights emerging trends and growth opportunities in the engineering plastic market, focusing on untapped markets, innovative applications, and evolving consumer preferences.
- Expanding applications in renewable energy technologies.
- Growing demand for bio-based and biodegradable engineering plastics.
- Increased use of additive manufacturing for customized product designs.
Growth Accelerators in the Engineering Plastic Industry Industry
This section discusses long-term growth catalysts, including technological breakthroughs and strategic partnerships. We examine how market expansion strategies and collaborations drive sustained market expansion and innovation.
Technological advancements in material science, strategic partnerships to expand market reach, and the growing adoption of sustainable manufacturing practices are key growth accelerators for the engineering plastics industry. Focus on lightweighting and improving material properties will continue to drive market growth.
Key Players Shaping the Engineering Plastic Industry Market
- Alfa S A B de C V
- BASF SE
- Celanese Corporation
- CHIMEI
- Covestro AG
- Dongyue Group
- DuPont
- Far Eastern New Century Corporation
- Indorama Ventures Public Company Limited
- LG Chem
- Mitsubishi Chemical Corporation
- SABIC
- Solvay
- Toray Industries Inc
- Victrex
Notable Milestones in Engineering Plastic Industry Sector
- February 2023: Covestro AG introduced Makrolon 3638 polycarbonate for healthcare and life sciences applications.
- February 2023: Victrex PLC announced plans to expand its medical division, Invibio Biomaterial Solutions.
- March 2023: Victrex PLC launched a new implantable PEEK-OPTIMA polymer for medical device additives.
In-Depth Engineering Plastic Industry Market Outlook
The engineering plastics market is poised for significant growth, driven by continuous technological advancements, increasing demand from diverse end-use sectors, and a growing focus on sustainability. Strategic investments in R&D, strategic partnerships, and expansion into new geographical markets will be crucial for players to capitalize on emerging opportunities and maintain a competitive edge in this dynamic industry. The market’s future is bright, with numerous avenues for innovation and growth.
Engineering Plastic Industry Segmentation
-
1. End User Industry
- 1.1. Aerospace
- 1.2. Automotive
- 1.3. Building and Construction
- 1.4. Electrical and Electronics
- 1.5. Industrial and Machinery
- 1.6. Packaging
- 1.7. Other End-user Industries
-
2. Resin Type
-
2.1. Fluoropolymer
-
2.1.1. By Sub Resin Type
- 2.1.1.1. Ethylenetetrafluoroethylene (ETFE)
- 2.1.1.2. Fluorinated Ethylene-propylene (FEP)
- 2.1.1.3. Polytetrafluoroethylene (PTFE)
- 2.1.1.4. Polyvinylfluoride (PVF)
- 2.1.1.5. Polyvinylidene Fluoride (PVDF)
- 2.1.1.6. Other Sub Resin Types
-
2.1.1. By Sub Resin Type
- 2.2. Liquid Crystal Polymer (LCP)
-
2.3. Polyamide (PA)
- 2.3.1. Aramid
- 2.3.2. Polyamide (PA) 6
- 2.3.3. Polyamide (PA) 66
- 2.3.4. Polyphthalamide
- 2.4. Polybutylene Terephthalate (PBT)
- 2.5. Polycarbonate (PC)
- 2.6. Polyether Ether Ketone (PEEK)
- 2.7. Polyethylene Terephthalate (PET)
- 2.8. Polyimide (PI)
- 2.9. Polymethyl Methacrylate (PMMA)
- 2.10. Polyoxymethylene (POM)
- 2.11. Styrene Copolymers (ABS and SAN)
-
2.1. Fluoropolymer
Engineering Plastic Industry Segmentation By Geography
-
1. North America
- 1.1. United States
- 1.2. Canada
- 1.3. Mexico
-
2. South America
- 2.1. Brazil
- 2.2. Argentina
- 2.3. Rest of South America
-
3. Europe
- 3.1. United Kingdom
- 3.2. Germany
- 3.3. France
- 3.4. Italy
- 3.5. Spain
- 3.6. Russia
- 3.7. Benelux
- 3.8. Nordics
- 3.9. Rest of Europe
-
4. Middle East & Africa
- 4.1. Turkey
- 4.2. Israel
- 4.3. GCC
- 4.4. North Africa
- 4.5. South Africa
- 4.6. Rest of Middle East & Africa
-
5. Asia Pacific
- 5.1. China
- 5.2. India
- 5.3. Japan
- 5.4. South Korea
- 5.5. ASEAN
- 5.6. Oceania
- 5.7. Rest of Asia Pacific
Engineering Plastic Industry REPORT HIGHLIGHTS
| Aspects | Details |
|---|---|
| Study Period | 2019-2033 |
| Base Year | 2024 |
| Estimated Year | 2025 |
| Forecast Period | 2025-2033 |
| Historical Period | 2019-2024 |
| Growth Rate | CAGR of % from 2019-2033 |
| Segmentation |
|
Table of Contents
- 1. Introduction
- 1.1. Research Scope
- 1.2. Market Segmentation
- 1.3. Research Methodology
- 1.4. Definitions and Assumptions
- 2. Executive Summary
- 2.1. Introduction
- 3. Market Dynamics
- 3.1. Introduction
- 3.2. Market Drivers
- 3.3. Market Restrains
- 3.4. Market Trends
- 3.4.1. OTHER KEY INDUSTRY TRENDS COVERED IN THE REPORT
- 4. Market Factor Analysis
- 4.1. Porters Five Forces
- 4.2. Supply/Value Chain
- 4.3. PESTEL analysis
- 4.4. Market Entropy
- 4.5. Patent/Trademark Analysis
- 5. Global Engineering Plastic Industry Analysis, Insights and Forecast, 2019-2031
- 5.1. Market Analysis, Insights and Forecast - by End User Industry
- 5.1.1. Aerospace
- 5.1.2. Automotive
- 5.1.3. Building and Construction
- 5.1.4. Electrical and Electronics
- 5.1.5. Industrial and Machinery
- 5.1.6. Packaging
- 5.1.7. Other End-user Industries
- 5.2. Market Analysis, Insights and Forecast - by Resin Type
- 5.2.1. Fluoropolymer
- 5.2.1.1. By Sub Resin Type
- 5.2.1.1.1. Ethylenetetrafluoroethylene (ETFE)
- 5.2.1.1.2. Fluorinated Ethylene-propylene (FEP)
- 5.2.1.1.3. Polytetrafluoroethylene (PTFE)
- 5.2.1.1.4. Polyvinylfluoride (PVF)
- 5.2.1.1.5. Polyvinylidene Fluoride (PVDF)
- 5.2.1.1.6. Other Sub Resin Types
- 5.2.1.1. By Sub Resin Type
- 5.2.2. Liquid Crystal Polymer (LCP)
- 5.2.3. Polyamide (PA)
- 5.2.3.1. Aramid
- 5.2.3.2. Polyamide (PA) 6
- 5.2.3.3. Polyamide (PA) 66
- 5.2.3.4. Polyphthalamide
- 5.2.4. Polybutylene Terephthalate (PBT)
- 5.2.5. Polycarbonate (PC)
- 5.2.6. Polyether Ether Ketone (PEEK)
- 5.2.7. Polyethylene Terephthalate (PET)
- 5.2.8. Polyimide (PI)
- 5.2.9. Polymethyl Methacrylate (PMMA)
- 5.2.10. Polyoxymethylene (POM)
- 5.2.11. Styrene Copolymers (ABS and SAN)
- 5.2.1. Fluoropolymer
- 5.3. Market Analysis, Insights and Forecast - by Region
- 5.3.1. North America
- 5.3.2. South America
- 5.3.3. Europe
- 5.3.4. Middle East & Africa
- 5.3.5. Asia Pacific
- 5.1. Market Analysis, Insights and Forecast - by End User Industry
- 6. North America Engineering Plastic Industry Analysis, Insights and Forecast, 2019-2031
- 6.1. Market Analysis, Insights and Forecast - by End User Industry
- 6.1.1. Aerospace
- 6.1.2. Automotive
- 6.1.3. Building and Construction
- 6.1.4. Electrical and Electronics
- 6.1.5. Industrial and Machinery
- 6.1.6. Packaging
- 6.1.7. Other End-user Industries
- 6.2. Market Analysis, Insights and Forecast - by Resin Type
- 6.2.1. Fluoropolymer
- 6.2.1.1. By Sub Resin Type
- 6.2.1.1.1. Ethylenetetrafluoroethylene (ETFE)
- 6.2.1.1.2. Fluorinated Ethylene-propylene (FEP)
- 6.2.1.1.3. Polytetrafluoroethylene (PTFE)
- 6.2.1.1.4. Polyvinylfluoride (PVF)
- 6.2.1.1.5. Polyvinylidene Fluoride (PVDF)
- 6.2.1.1.6. Other Sub Resin Types
- 6.2.1.1. By Sub Resin Type
- 6.2.2. Liquid Crystal Polymer (LCP)
- 6.2.3. Polyamide (PA)
- 6.2.3.1. Aramid
- 6.2.3.2. Polyamide (PA) 6
- 6.2.3.3. Polyamide (PA) 66
- 6.2.3.4. Polyphthalamide
- 6.2.4. Polybutylene Terephthalate (PBT)
- 6.2.5. Polycarbonate (PC)
- 6.2.6. Polyether Ether Ketone (PEEK)
- 6.2.7. Polyethylene Terephthalate (PET)
- 6.2.8. Polyimide (PI)
- 6.2.9. Polymethyl Methacrylate (PMMA)
- 6.2.10. Polyoxymethylene (POM)
- 6.2.11. Styrene Copolymers (ABS and SAN)
- 6.2.1. Fluoropolymer
- 6.1. Market Analysis, Insights and Forecast - by End User Industry
- 7. South America Engineering Plastic Industry Analysis, Insights and Forecast, 2019-2031
- 7.1. Market Analysis, Insights and Forecast - by End User Industry
- 7.1.1. Aerospace
- 7.1.2. Automotive
- 7.1.3. Building and Construction
- 7.1.4. Electrical and Electronics
- 7.1.5. Industrial and Machinery
- 7.1.6. Packaging
- 7.1.7. Other End-user Industries
- 7.2. Market Analysis, Insights and Forecast - by Resin Type
- 7.2.1. Fluoropolymer
- 7.2.1.1. By Sub Resin Type
- 7.2.1.1.1. Ethylenetetrafluoroethylene (ETFE)
- 7.2.1.1.2. Fluorinated Ethylene-propylene (FEP)
- 7.2.1.1.3. Polytetrafluoroethylene (PTFE)
- 7.2.1.1.4. Polyvinylfluoride (PVF)
- 7.2.1.1.5. Polyvinylidene Fluoride (PVDF)
- 7.2.1.1.6. Other Sub Resin Types
- 7.2.1.1. By Sub Resin Type
- 7.2.2. Liquid Crystal Polymer (LCP)
- 7.2.3. Polyamide (PA)
- 7.2.3.1. Aramid
- 7.2.3.2. Polyamide (PA) 6
- 7.2.3.3. Polyamide (PA) 66
- 7.2.3.4. Polyphthalamide
- 7.2.4. Polybutylene Terephthalate (PBT)
- 7.2.5. Polycarbonate (PC)
- 7.2.6. Polyether Ether Ketone (PEEK)
- 7.2.7. Polyethylene Terephthalate (PET)
- 7.2.8. Polyimide (PI)
- 7.2.9. Polymethyl Methacrylate (PMMA)
- 7.2.10. Polyoxymethylene (POM)
- 7.2.11. Styrene Copolymers (ABS and SAN)
- 7.2.1. Fluoropolymer
- 7.1. Market Analysis, Insights and Forecast - by End User Industry
- 8. Europe Engineering Plastic Industry Analysis, Insights and Forecast, 2019-2031
- 8.1. Market Analysis, Insights and Forecast - by End User Industry
- 8.1.1. Aerospace
- 8.1.2. Automotive
- 8.1.3. Building and Construction
- 8.1.4. Electrical and Electronics
- 8.1.5. Industrial and Machinery
- 8.1.6. Packaging
- 8.1.7. Other End-user Industries
- 8.2. Market Analysis, Insights and Forecast - by Resin Type
- 8.2.1. Fluoropolymer
- 8.2.1.1. By Sub Resin Type
- 8.2.1.1.1. Ethylenetetrafluoroethylene (ETFE)
- 8.2.1.1.2. Fluorinated Ethylene-propylene (FEP)
- 8.2.1.1.3. Polytetrafluoroethylene (PTFE)
- 8.2.1.1.4. Polyvinylfluoride (PVF)
- 8.2.1.1.5. Polyvinylidene Fluoride (PVDF)
- 8.2.1.1.6. Other Sub Resin Types
- 8.2.1.1. By Sub Resin Type
- 8.2.2. Liquid Crystal Polymer (LCP)
- 8.2.3. Polyamide (PA)
- 8.2.3.1. Aramid
- 8.2.3.2. Polyamide (PA) 6
- 8.2.3.3. Polyamide (PA) 66
- 8.2.3.4. Polyphthalamide
- 8.2.4. Polybutylene Terephthalate (PBT)
- 8.2.5. Polycarbonate (PC)
- 8.2.6. Polyether Ether Ketone (PEEK)
- 8.2.7. Polyethylene Terephthalate (PET)
- 8.2.8. Polyimide (PI)
- 8.2.9. Polymethyl Methacrylate (PMMA)
- 8.2.10. Polyoxymethylene (POM)
- 8.2.11. Styrene Copolymers (ABS and SAN)
- 8.2.1. Fluoropolymer
- 8.1. Market Analysis, Insights and Forecast - by End User Industry
- 9. Middle East & Africa Engineering Plastic Industry Analysis, Insights and Forecast, 2019-2031
- 9.1. Market Analysis, Insights and Forecast - by End User Industry
- 9.1.1. Aerospace
- 9.1.2. Automotive
- 9.1.3. Building and Construction
- 9.1.4. Electrical and Electronics
- 9.1.5. Industrial and Machinery
- 9.1.6. Packaging
- 9.1.7. Other End-user Industries
- 9.2. Market Analysis, Insights and Forecast - by Resin Type
- 9.2.1. Fluoropolymer
- 9.2.1.1. By Sub Resin Type
- 9.2.1.1.1. Ethylenetetrafluoroethylene (ETFE)
- 9.2.1.1.2. Fluorinated Ethylene-propylene (FEP)
- 9.2.1.1.3. Polytetrafluoroethylene (PTFE)
- 9.2.1.1.4. Polyvinylfluoride (PVF)
- 9.2.1.1.5. Polyvinylidene Fluoride (PVDF)
- 9.2.1.1.6. Other Sub Resin Types
- 9.2.1.1. By Sub Resin Type
- 9.2.2. Liquid Crystal Polymer (LCP)
- 9.2.3. Polyamide (PA)
- 9.2.3.1. Aramid
- 9.2.3.2. Polyamide (PA) 6
- 9.2.3.3. Polyamide (PA) 66
- 9.2.3.4. Polyphthalamide
- 9.2.4. Polybutylene Terephthalate (PBT)
- 9.2.5. Polycarbonate (PC)
- 9.2.6. Polyether Ether Ketone (PEEK)
- 9.2.7. Polyethylene Terephthalate (PET)
- 9.2.8. Polyimide (PI)
- 9.2.9. Polymethyl Methacrylate (PMMA)
- 9.2.10. Polyoxymethylene (POM)
- 9.2.11. Styrene Copolymers (ABS and SAN)
- 9.2.1. Fluoropolymer
- 9.1. Market Analysis, Insights and Forecast - by End User Industry
- 10. Asia Pacific Engineering Plastic Industry Analysis, Insights and Forecast, 2019-2031
- 10.1. Market Analysis, Insights and Forecast - by End User Industry
- 10.1.1. Aerospace
- 10.1.2. Automotive
- 10.1.3. Building and Construction
- 10.1.4. Electrical and Electronics
- 10.1.5. Industrial and Machinery
- 10.1.6. Packaging
- 10.1.7. Other End-user Industries
- 10.2. Market Analysis, Insights and Forecast - by Resin Type
- 10.2.1. Fluoropolymer
- 10.2.1.1. By Sub Resin Type
- 10.2.1.1.1. Ethylenetetrafluoroethylene (ETFE)
- 10.2.1.1.2. Fluorinated Ethylene-propylene (FEP)
- 10.2.1.1.3. Polytetrafluoroethylene (PTFE)
- 10.2.1.1.4. Polyvinylfluoride (PVF)
- 10.2.1.1.5. Polyvinylidene Fluoride (PVDF)
- 10.2.1.1.6. Other Sub Resin Types
- 10.2.1.1. By Sub Resin Type
- 10.2.2. Liquid Crystal Polymer (LCP)
- 10.2.3. Polyamide (PA)
- 10.2.3.1. Aramid
- 10.2.3.2. Polyamide (PA) 6
- 10.2.3.3. Polyamide (PA) 66
- 10.2.3.4. Polyphthalamide
- 10.2.4. Polybutylene Terephthalate (PBT)
- 10.2.5. Polycarbonate (PC)
- 10.2.6. Polyether Ether Ketone (PEEK)
- 10.2.7. Polyethylene Terephthalate (PET)
- 10.2.8. Polyimide (PI)
- 10.2.9. Polymethyl Methacrylate (PMMA)
- 10.2.10. Polyoxymethylene (POM)
- 10.2.11. Styrene Copolymers (ABS and SAN)
- 10.2.1. Fluoropolymer
- 10.1. Market Analysis, Insights and Forecast - by End User Industry
- 11. Competitive Analysis
- 11.1. Global Market Share Analysis 2024
- 11.2. Company Profiles
- 11.2.1 Alfa S A B de C V
- 11.2.1.1. Overview
- 11.2.1.2. Products
- 11.2.1.3. SWOT Analysis
- 11.2.1.4. Recent Developments
- 11.2.1.5. Financials (Based on Availability)
- 11.2.2 BASF SE
- 11.2.2.1. Overview
- 11.2.2.2. Products
- 11.2.2.3. SWOT Analysis
- 11.2.2.4. Recent Developments
- 11.2.2.5. Financials (Based on Availability)
- 11.2.3 Celanese Corporation
- 11.2.3.1. Overview
- 11.2.3.2. Products
- 11.2.3.3. SWOT Analysis
- 11.2.3.4. Recent Developments
- 11.2.3.5. Financials (Based on Availability)
- 11.2.4 CHIMEI
- 11.2.4.1. Overview
- 11.2.4.2. Products
- 11.2.4.3. SWOT Analysis
- 11.2.4.4. Recent Developments
- 11.2.4.5. Financials (Based on Availability)
- 11.2.5 Covestro AG
- 11.2.5.1. Overview
- 11.2.5.2. Products
- 11.2.5.3. SWOT Analysis
- 11.2.5.4. Recent Developments
- 11.2.5.5. Financials (Based on Availability)
- 11.2.6 Dongyue Group
- 11.2.6.1. Overview
- 11.2.6.2. Products
- 11.2.6.3. SWOT Analysis
- 11.2.6.4. Recent Developments
- 11.2.6.5. Financials (Based on Availability)
- 11.2.7 DuPont
- 11.2.7.1. Overview
- 11.2.7.2. Products
- 11.2.7.3. SWOT Analysis
- 11.2.7.4. Recent Developments
- 11.2.7.5. Financials (Based on Availability)
- 11.2.8 Far Eastern New Century Corporation
- 11.2.8.1. Overview
- 11.2.8.2. Products
- 11.2.8.3. SWOT Analysis
- 11.2.8.4. Recent Developments
- 11.2.8.5. Financials (Based on Availability)
- 11.2.9 Indorama Ventures Public Company Limited
- 11.2.9.1. Overview
- 11.2.9.2. Products
- 11.2.9.3. SWOT Analysis
- 11.2.9.4. Recent Developments
- 11.2.9.5. Financials (Based on Availability)
- 11.2.10 LG Chem
- 11.2.10.1. Overview
- 11.2.10.2. Products
- 11.2.10.3. SWOT Analysis
- 11.2.10.4. Recent Developments
- 11.2.10.5. Financials (Based on Availability)
- 11.2.11 Mitsubishi Chemical Corporation
- 11.2.11.1. Overview
- 11.2.11.2. Products
- 11.2.11.3. SWOT Analysis
- 11.2.11.4. Recent Developments
- 11.2.11.5. Financials (Based on Availability)
- 11.2.12 SABIC
- 11.2.12.1. Overview
- 11.2.12.2. Products
- 11.2.12.3. SWOT Analysis
- 11.2.12.4. Recent Developments
- 11.2.12.5. Financials (Based on Availability)
- 11.2.13 Solvay
- 11.2.13.1. Overview
- 11.2.13.2. Products
- 11.2.13.3. SWOT Analysis
- 11.2.13.4. Recent Developments
- 11.2.13.5. Financials (Based on Availability)
- 11.2.14 Toray Industries Inc
- 11.2.14.1. Overview
- 11.2.14.2. Products
- 11.2.14.3. SWOT Analysis
- 11.2.14.4. Recent Developments
- 11.2.14.5. Financials (Based on Availability)
- 11.2.15 Victre
- 11.2.15.1. Overview
- 11.2.15.2. Products
- 11.2.15.3. SWOT Analysis
- 11.2.15.4. Recent Developments
- 11.2.15.5. Financials (Based on Availability)
- 11.2.1 Alfa S A B de C V
List of Figures
- Figure 1: Global Engineering Plastic Industry Revenue Breakdown (Million, %) by Region 2024 & 2032
- Figure 2: North America Engineering Plastic Industry Revenue (Million), by End User Industry 2024 & 2032
- Figure 3: North America Engineering Plastic Industry Revenue Share (%), by End User Industry 2024 & 2032
- Figure 4: North America Engineering Plastic Industry Revenue (Million), by Resin Type 2024 & 2032
- Figure 5: North America Engineering Plastic Industry Revenue Share (%), by Resin Type 2024 & 2032
- Figure 6: North America Engineering Plastic Industry Revenue (Million), by Country 2024 & 2032
- Figure 7: North America Engineering Plastic Industry Revenue Share (%), by Country 2024 & 2032
- Figure 8: South America Engineering Plastic Industry Revenue (Million), by End User Industry 2024 & 2032
- Figure 9: South America Engineering Plastic Industry Revenue Share (%), by End User Industry 2024 & 2032
- Figure 10: South America Engineering Plastic Industry Revenue (Million), by Resin Type 2024 & 2032
- Figure 11: South America Engineering Plastic Industry Revenue Share (%), by Resin Type 2024 & 2032
- Figure 12: South America Engineering Plastic Industry Revenue (Million), by Country 2024 & 2032
- Figure 13: South America Engineering Plastic Industry Revenue Share (%), by Country 2024 & 2032
- Figure 14: Europe Engineering Plastic Industry Revenue (Million), by End User Industry 2024 & 2032
- Figure 15: Europe Engineering Plastic Industry Revenue Share (%), by End User Industry 2024 & 2032
- Figure 16: Europe Engineering Plastic Industry Revenue (Million), by Resin Type 2024 & 2032
- Figure 17: Europe Engineering Plastic Industry Revenue Share (%), by Resin Type 2024 & 2032
- Figure 18: Europe Engineering Plastic Industry Revenue (Million), by Country 2024 & 2032
- Figure 19: Europe Engineering Plastic Industry Revenue Share (%), by Country 2024 & 2032
- Figure 20: Middle East & Africa Engineering Plastic Industry Revenue (Million), by End User Industry 2024 & 2032
- Figure 21: Middle East & Africa Engineering Plastic Industry Revenue Share (%), by End User Industry 2024 & 2032
- Figure 22: Middle East & Africa Engineering Plastic Industry Revenue (Million), by Resin Type 2024 & 2032
- Figure 23: Middle East & Africa Engineering Plastic Industry Revenue Share (%), by Resin Type 2024 & 2032
- Figure 24: Middle East & Africa Engineering Plastic Industry Revenue (Million), by Country 2024 & 2032
- Figure 25: Middle East & Africa Engineering Plastic Industry Revenue Share (%), by Country 2024 & 2032
- Figure 26: Asia Pacific Engineering Plastic Industry Revenue (Million), by End User Industry 2024 & 2032
- Figure 27: Asia Pacific Engineering Plastic Industry Revenue Share (%), by End User Industry 2024 & 2032
- Figure 28: Asia Pacific Engineering Plastic Industry Revenue (Million), by Resin Type 2024 & 2032
- Figure 29: Asia Pacific Engineering Plastic Industry Revenue Share (%), by Resin Type 2024 & 2032
- Figure 30: Asia Pacific Engineering Plastic Industry Revenue (Million), by Country 2024 & 2032
- Figure 31: Asia Pacific Engineering Plastic Industry Revenue Share (%), by Country 2024 & 2032
List of Tables
- Table 1: Global Engineering Plastic Industry Revenue Million Forecast, by Region 2019 & 2032
- Table 2: Global Engineering Plastic Industry Revenue Million Forecast, by End User Industry 2019 & 2032
- Table 3: Global Engineering Plastic Industry Revenue Million Forecast, by Resin Type 2019 & 2032
- Table 4: Global Engineering Plastic Industry Revenue Million Forecast, by Region 2019 & 2032
- Table 5: Global Engineering Plastic Industry Revenue Million Forecast, by End User Industry 2019 & 2032
- Table 6: Global Engineering Plastic Industry Revenue Million Forecast, by Resin Type 2019 & 2032
- Table 7: Global Engineering Plastic Industry Revenue Million Forecast, by Country 2019 & 2032
- Table 8: United States Engineering Plastic Industry Revenue (Million) Forecast, by Application 2019 & 2032
- Table 9: Canada Engineering Plastic Industry Revenue (Million) Forecast, by Application 2019 & 2032
- Table 10: Mexico Engineering Plastic Industry Revenue (Million) Forecast, by Application 2019 & 2032
- Table 11: Global Engineering Plastic Industry Revenue Million Forecast, by End User Industry 2019 & 2032
- Table 12: Global Engineering Plastic Industry Revenue Million Forecast, by Resin Type 2019 & 2032
- Table 13: Global Engineering Plastic Industry Revenue Million Forecast, by Country 2019 & 2032
- Table 14: Brazil Engineering Plastic Industry Revenue (Million) Forecast, by Application 2019 & 2032
- Table 15: Argentina Engineering Plastic Industry Revenue (Million) Forecast, by Application 2019 & 2032
- Table 16: Rest of South America Engineering Plastic Industry Revenue (Million) Forecast, by Application 2019 & 2032
- Table 17: Global Engineering Plastic Industry Revenue Million Forecast, by End User Industry 2019 & 2032
- Table 18: Global Engineering Plastic Industry Revenue Million Forecast, by Resin Type 2019 & 2032
- Table 19: Global Engineering Plastic Industry Revenue Million Forecast, by Country 2019 & 2032
- Table 20: United Kingdom Engineering Plastic Industry Revenue (Million) Forecast, by Application 2019 & 2032
- Table 21: Germany Engineering Plastic Industry Revenue (Million) Forecast, by Application 2019 & 2032
- Table 22: France Engineering Plastic Industry Revenue (Million) Forecast, by Application 2019 & 2032
- Table 23: Italy Engineering Plastic Industry Revenue (Million) Forecast, by Application 2019 & 2032
- Table 24: Spain Engineering Plastic Industry Revenue (Million) Forecast, by Application 2019 & 2032
- Table 25: Russia Engineering Plastic Industry Revenue (Million) Forecast, by Application 2019 & 2032
- Table 26: Benelux Engineering Plastic Industry Revenue (Million) Forecast, by Application 2019 & 2032
- Table 27: Nordics Engineering Plastic Industry Revenue (Million) Forecast, by Application 2019 & 2032
- Table 28: Rest of Europe Engineering Plastic Industry Revenue (Million) Forecast, by Application 2019 & 2032
- Table 29: Global Engineering Plastic Industry Revenue Million Forecast, by End User Industry 2019 & 2032
- Table 30: Global Engineering Plastic Industry Revenue Million Forecast, by Resin Type 2019 & 2032
- Table 31: Global Engineering Plastic Industry Revenue Million Forecast, by Country 2019 & 2032
- Table 32: Turkey Engineering Plastic Industry Revenue (Million) Forecast, by Application 2019 & 2032
- Table 33: Israel Engineering Plastic Industry Revenue (Million) Forecast, by Application 2019 & 2032
- Table 34: GCC Engineering Plastic Industry Revenue (Million) Forecast, by Application 2019 & 2032
- Table 35: North Africa Engineering Plastic Industry Revenue (Million) Forecast, by Application 2019 & 2032
- Table 36: South Africa Engineering Plastic Industry Revenue (Million) Forecast, by Application 2019 & 2032
- Table 37: Rest of Middle East & Africa Engineering Plastic Industry Revenue (Million) Forecast, by Application 2019 & 2032
- Table 38: Global Engineering Plastic Industry Revenue Million Forecast, by End User Industry 2019 & 2032
- Table 39: Global Engineering Plastic Industry Revenue Million Forecast, by Resin Type 2019 & 2032
- Table 40: Global Engineering Plastic Industry Revenue Million Forecast, by Country 2019 & 2032
- Table 41: China Engineering Plastic Industry Revenue (Million) Forecast, by Application 2019 & 2032
- Table 42: India Engineering Plastic Industry Revenue (Million) Forecast, by Application 2019 & 2032
- Table 43: Japan Engineering Plastic Industry Revenue (Million) Forecast, by Application 2019 & 2032
- Table 44: South Korea Engineering Plastic Industry Revenue (Million) Forecast, by Application 2019 & 2032
- Table 45: ASEAN Engineering Plastic Industry Revenue (Million) Forecast, by Application 2019 & 2032
- Table 46: Oceania Engineering Plastic Industry Revenue (Million) Forecast, by Application 2019 & 2032
- Table 47: Rest of Asia Pacific Engineering Plastic Industry Revenue (Million) Forecast, by Application 2019 & 2032
Frequently Asked Questions
1. What is the projected Compound Annual Growth Rate (CAGR) of the Engineering Plastic Industry?
The projected CAGR is approximately N/A%.
2. Which companies are prominent players in the Engineering Plastic Industry?
Key companies in the market include Alfa S A B de C V, BASF SE, Celanese Corporation, CHIMEI, Covestro AG, Dongyue Group, DuPont, Far Eastern New Century Corporation, Indorama Ventures Public Company Limited, LG Chem, Mitsubishi Chemical Corporation, SABIC, Solvay, Toray Industries Inc, Victre.
3. What are the main segments of the Engineering Plastic Industry?
The market segments include End User Industry, Resin Type.
4. Can you provide details about the market size?
The market size is estimated to be USD XX Million as of 2022.
5. What are some drivers contributing to market growth?
N/A
6. What are the notable trends driving market growth?
OTHER KEY INDUSTRY TRENDS COVERED IN THE REPORT.
7. Are there any restraints impacting market growth?
N/A
8. Can you provide examples of recent developments in the market?
March 2023: Victrex PLC introduced a new type of implantable PEEK-OPTIMA polymer that is specifically designed for use in the manufacturing processes of medical device additives, such as fused deposition modeling (FDM) and fused filament fabrication (FFF).February 2023: Victrex PLC revealed its plans to invest in the expansion of its medical division, Invibio Biomaterial Solutions, which includes establishing a new product development facility in Leeds, United Kingdom.February 2023: Covestro AG introduced Makrolon 3638 polycarbonate for healthcare and life sciences applications such as drug delivery devices, wellness and wearable devices, and single-use containers for biopharmaceutical manufacturing.
9. What pricing options are available for accessing the report?
Pricing options include single-user, multi-user, and enterprise licenses priced at USD 3800, USD 4500, and USD 5800 respectively.
10. Is the market size provided in terms of value or volume?
The market size is provided in terms of value, measured in Million.
11. Are there any specific market keywords associated with the report?
Yes, the market keyword associated with the report is "Engineering Plastic Industry," which aids in identifying and referencing the specific market segment covered.
12. How do I determine which pricing option suits my needs best?
The pricing options vary based on user requirements and access needs. Individual users may opt for single-user licenses, while businesses requiring broader access may choose multi-user or enterprise licenses for cost-effective access to the report.
13. Are there any additional resources or data provided in the Engineering Plastic Industry report?
While the report offers comprehensive insights, it's advisable to review the specific contents or supplementary materials provided to ascertain if additional resources or data are available.
14. How can I stay updated on further developments or reports in the Engineering Plastic Industry?
To stay informed about further developments, trends, and reports in the Engineering Plastic Industry, consider subscribing to industry newsletters, following relevant companies and organizations, or regularly checking reputable industry news sources and publications.
Methodology
Step 1 - Identification of Relevant Samples Size from Population Database


Step 2 - Approaches for Defining Global Market Size (Value, Volume* & Price*)

Note*: In applicable scenarios
Step 3 - Data Sources
Primary Research
- Web Analytics
- Survey Reports
- Research Institute
- Latest Research Reports
- Opinion Leaders
Secondary Research
- Annual Reports
- White Paper
- Latest Press Release
- Industry Association
- Paid Database
- Investor Presentations

Step 4 - Data Triangulation
Involves using different sources of information in order to increase the validity of a study
These sources are likely to be stakeholders in a program - participants, other researchers, program staff, other community members, and so on.
Then we put all data in single framework & apply various statistical tools to find out the dynamic on the market.
During the analysis stage, feedback from the stakeholder groups would be compared to determine areas of agreement as well as areas of divergence


