
Key Insights
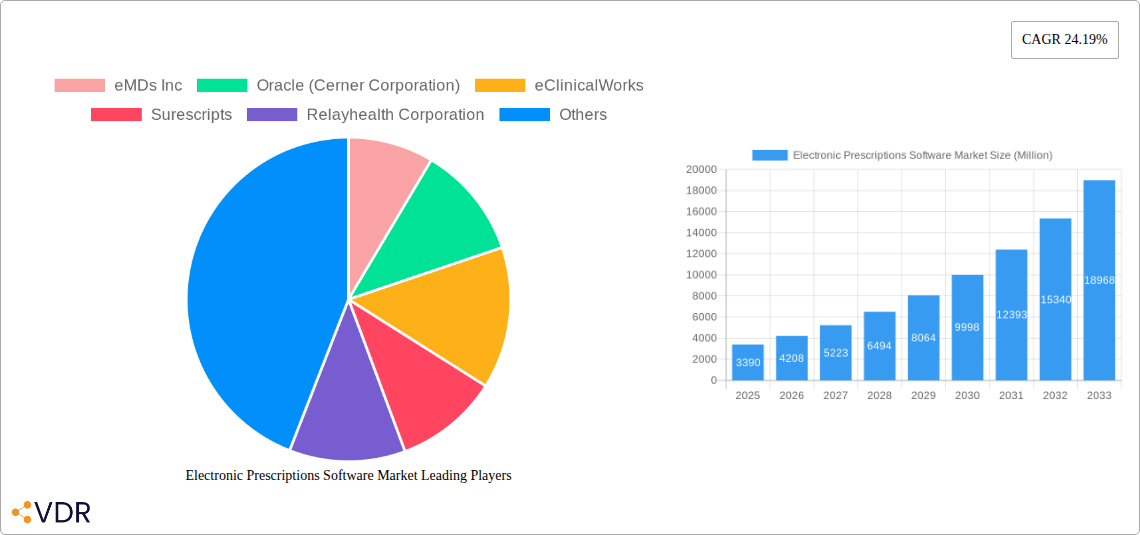
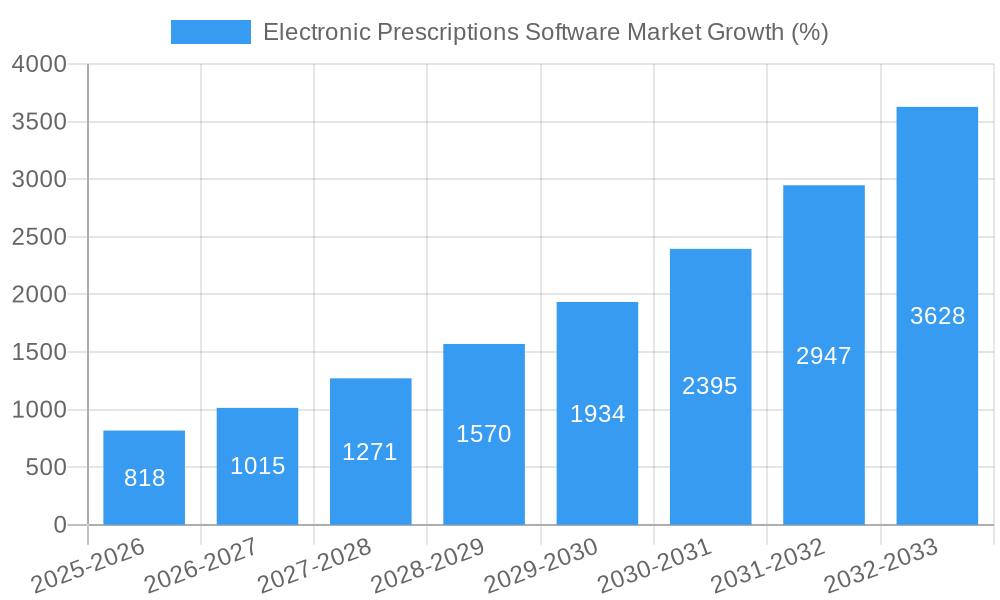
The Electronic Prescriptions Software (EPS) market is experiencing robust growth, driven by the increasing adoption of electronic health records (EHRs), the rising prevalence of chronic diseases requiring regular medication, and government initiatives promoting digital healthcare. The market, valued at $3.39 billion in 2025, is projected to expand significantly over the forecast period (2025-2033), fueled by a compound annual growth rate (CAGR) of 24.19%. This growth is fueled by several key factors. The shift towards value-based care models incentivizes providers to adopt efficient and cost-effective solutions like EPS, reducing medication errors and improving patient outcomes. Furthermore, the integration of EPS with other healthcare IT systems, such as pharmacy management systems and patient portals, enhances workflow efficiency and improves communication among healthcare providers and patients. The increasing demand for interoperability and data security further drives market growth, leading to a preference for cloud-based and integrated EPS systems. Competition among established players like eMDs, Oracle (Cerner), and Allscripts, alongside emerging innovative companies, further intensifies market dynamics and fosters innovation in features and functionality.
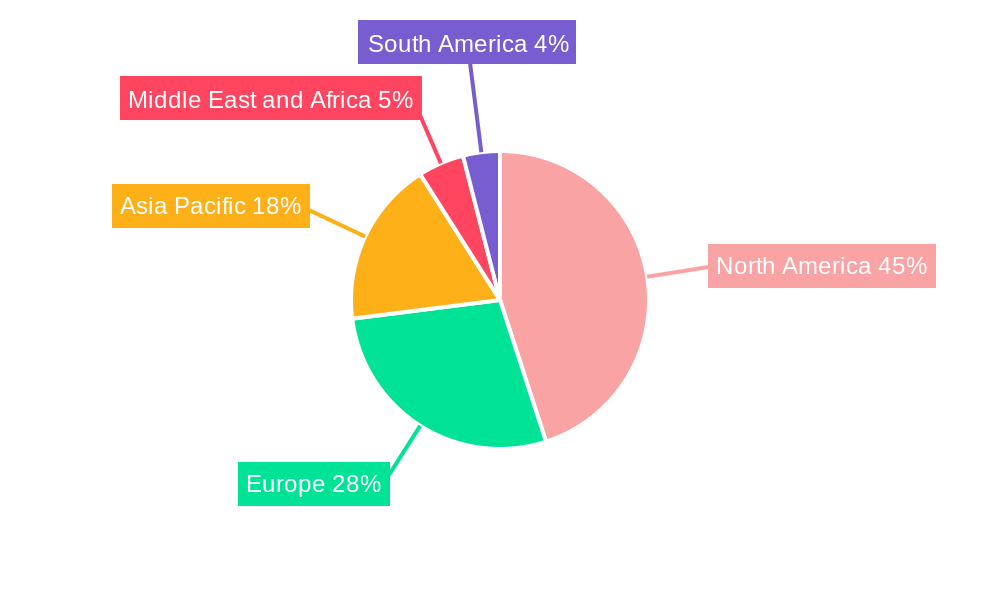
The market segmentation reveals a diverse landscape. Hardware, software, and services contribute to the overall value chain. Stand-alone and integrated systems cater to various healthcare provider needs, while cloud, web-based, and on-premise delivery modes offer flexibility. Hospitals and clinics represent major end-user segments, with hospitals leading in adoption due to their larger scale and sophisticated IT infrastructure. Regional variations exist, with North America currently holding a significant market share due to early adoption and advanced healthcare infrastructure. However, the Asia-Pacific region is anticipated to experience substantial growth due to increasing healthcare spending and technological advancements. The market faces some restraints, including concerns regarding data security and privacy, the need for robust technical support and training, and the cost of implementation and integration with existing systems. However, the overall positive impact of EPS on healthcare efficiency and patient safety ensures that these challenges are actively being addressed, supporting the continued strong growth of the market.
Electronic Prescriptions Software Market: A Comprehensive Report (2019-2033)
This in-depth report provides a comprehensive analysis of the Electronic Prescriptions Software Market, encompassing market dynamics, growth trends, regional dominance, product landscape, and key players. With a focus on the parent market of Healthcare IT and the child market of E-Prescribing Solutions, this report offers invaluable insights for stakeholders across the industry. The study period covers 2019-2033, with a base year of 2025 and a forecast period of 2025-2033. The market size is presented in Million USD.
Electronic Prescriptions Software Market Dynamics & Structure
The Electronic Prescriptions Software Market is experiencing significant growth driven by technological advancements, stringent regulatory frameworks promoting digital healthcare, and increasing demand for efficient healthcare delivery. Market concentration is moderate, with several key players vying for market share. The market structure is characterized by a blend of established players and emerging startups.
- Market Concentration: Moderately concentrated, with the top 5 players holding approximately xx% of the market share in 2024.
- Technological Innovation Drivers: AI-powered prescription assistance, interoperability improvements, and cloud-based solutions are major drivers. Barriers to innovation include data security concerns and integration complexities across different healthcare systems.
- Regulatory Frameworks: HIPAA compliance and other regional regulations significantly influence market dynamics. Government initiatives promoting e-prescribing are accelerating market adoption.
- Competitive Product Substitutes: Limited direct substitutes exist, but manual prescription methods pose indirect competition.
- End-User Demographics: Hospitals and clinics represent the largest segment of end-users, followed by independent physician practices.
- M&A Trends: The market has witnessed a moderate number of M&A activities in recent years, with an estimated xx deals between 2019 and 2024, primarily focused on enhancing product portfolios and expanding market reach. For example, Meddo's acquisition of Doxper in 2021 significantly broadened its patient base.
Electronic Prescriptions Software Market Growth Trends & Insights
The Electronic Prescriptions Software Market is experiencing robust growth, fueled by increasing adoption rates among healthcare providers and rising demand for improved efficiency and reduced medication errors. The market size is estimated at xx million USD in 2025 and is projected to reach xx million USD by 2033, exhibiting a CAGR of xx% during the forecast period. This growth is attributed to several factors, including the increasing prevalence of chronic diseases, rising healthcare costs, and government initiatives promoting electronic health records (EHR) adoption. The market penetration of e-prescribing solutions is steadily increasing, with significant growth expected in developing economies. Technological disruptions, such as the integration of AI and machine learning, are further enhancing the capabilities of e-prescribing software, improving accuracy and patient safety. Consumer behavior shifts towards digital healthcare services are also contributing to market expansion.
Dominant Regions, Countries, or Segments in Electronic Prescriptions Software Market
North America currently holds the largest market share, driven by high technology adoption rates, robust healthcare infrastructure, and favorable regulatory environment. However, significant growth potential exists in Asia-Pacific and other emerging markets.
- Component: Software dominates the market, followed by Services and then Hardware.
- Type of System: Integrated e-prescribing systems are witnessing higher adoption than stand-alone systems.
- Delivery Mode: Cloud-based solutions are gaining traction due to their scalability and cost-effectiveness.
- End Users: Hospitals and Clinics segment dominates the market.
Key drivers in North America include advanced healthcare infrastructure, high technological adoption rates, and strong regulatory support for e-prescribing. Europe is another significant market with high adoption rates, while Asia-Pacific is poised for rapid growth due to increasing healthcare expenditure and government initiatives.
Electronic Prescriptions Software Market Product Landscape
Electronic prescription software solutions are constantly evolving, incorporating advanced features like AI-driven drug interaction warnings, automated prescription refills, and seamless integration with EHR systems. These enhancements improve patient safety, streamline workflows, and reduce administrative burdens for healthcare providers. Key product innovations include cloud-based platforms, improved interoperability, and the integration of telehealth capabilities. Unique selling propositions often include enhanced security features, user-friendly interfaces, and customizable functionalities.
Key Drivers, Barriers & Challenges in Electronic Prescriptions Software Market
Key Drivers:
- Increasing government mandates for electronic health records (EHR) adoption.
- Rising demand for improved patient safety and reduced medication errors.
- Growing adoption of cloud-based technologies in the healthcare sector.
- Increased focus on interoperability and data exchange between healthcare systems.
Key Barriers and Challenges:
- High initial investment costs associated with implementation and integration.
- Concerns regarding data security and privacy breaches.
- Resistance to change among some healthcare providers.
- Interoperability issues between different software systems and EHRs. The cost of integration can be a significant deterrent, impacting approximately xx% of smaller clinics.
Emerging Opportunities in Electronic Prescriptions Software Market
- Expansion into untapped markets in developing countries.
- Integration of telemedicine capabilities into e-prescribing platforms.
- Development of AI-powered tools for drug interaction detection and personalized medication management.
- Focus on user-friendly interface design to enhance adoption rates.
Growth Accelerators in the Electronic Prescriptions Software Market Industry
Technological advancements, strategic partnerships, and expansion into emerging markets are key growth accelerators. The integration of AI and machine learning is significantly improving the accuracy and efficiency of e-prescribing systems. Strategic collaborations between software vendors, healthcare providers, and pharmaceutical companies are driving market expansion. Furthermore, government initiatives promoting digital healthcare are accelerating adoption rates globally.
Key Players Shaping the Electronic Prescriptions Software Market Market
- eMDs Inc
- Oracle (Cerner Corporation)
- eClinicalWorks
- Surescripts
- Relayhealth Corporation
- Allscripts Healthcare Solutions Inc (Veradigm)
- NextGen Healthcare Inc
- DrFirst
- Athenahealth Inc
Notable Milestones in Electronic Prescriptions Software Market Sector
- March 2022: FDB launched FDB Vela, a cloud-native e-prescribing network improving medication information flow.
- August 2021: Meddo acquired Doxper, expanding its patient base and clinic reach in India.
In-Depth Electronic Prescriptions Software Market Market Outlook
The Electronic Prescriptions Software Market is poised for continued robust growth, driven by technological advancements and increasing adoption rates. Opportunities abound in the integration of AI, expansion into underserved markets, and the development of innovative solutions that improve patient care and streamline healthcare workflows. Strategic partnerships and proactive adaptation to evolving regulatory landscapes will be crucial for success in this dynamic market. The future potential is significant, with projections indicating substantial market expansion over the next decade.
Electronic Prescriptions Software Market Segmentation
-
1. Component
- 1.1. Hardware
- 1.2. Software
- 1.3. Services
-
2. Type of System
- 2.1. Stand-alone E-prescribing System
- 2.2. Integrated E-prescribing System
-
3. Delivery Mode
- 3.1. Cloud Based
- 3.2. Web Based
- 3.3. On-Premise
-
4. End Users
- 4.1. Hospitals
- 4.2. Clinics
Electronic Prescriptions Software Market Segmentation By Geography
-
1. North America
- 1.1. United States
- 1.2. Canada
- 1.3. Mexico
-
2. Europe
- 2.1. Germany
- 2.2. United Kingdom
- 2.3. France
- 2.4. Italy
- 2.5. Spain
- 2.6. Rest of Europe
-
3. Asia Pacific
- 3.1. China
- 3.2. Japan
- 3.3. India
- 3.4. Australia
- 3.5. South Korea
- 3.6. Rest of Asia Pacific
-
4. Middle East and Africa
- 4.1. GCC
- 4.2. South Africa
- 4.3. Rest of Middle East and Africa
-
5. South America
- 5.1. Brazil
- 5.2. Argentina
- 5.3. Rest of South America
Electronic Prescriptions Software Market REPORT HIGHLIGHTS
| Aspects | Details |
|---|---|
| Study Period | 2019-2033 |
| Base Year | 2024 |
| Estimated Year | 2025 |
| Forecast Period | 2025-2033 |
| Historical Period | 2019-2024 |
| Growth Rate | CAGR of 24.19% from 2019-2033 |
| Segmentation |
|
Table of Contents
- 1. Introduction
- 1.1. Research Scope
- 1.2. Market Segmentation
- 1.3. Research Methodology
- 1.4. Definitions and Assumptions
- 2. Executive Summary
- 2.1. Introduction
- 3. Market Dynamics
- 3.1. Introduction
- 3.2. Market Drivers
- 3.2.1. Minimisation of Prescription Errors; Rising Demand for E-prescription System; Better Quality of Healthcare and Cost Reduction
- 3.3. Market Restrains
- 3.3.1. Security and Workflow Issues; Lack of Skilled Personnel to Handle the Systems
- 3.4. Market Trends
- 3.4.1. Stand-alone E-prescribing System Segment is Expected to Witness Growth Over the Forecast Period
- 4. Market Factor Analysis
- 4.1. Porters Five Forces
- 4.2. Supply/Value Chain
- 4.3. PESTEL analysis
- 4.4. Market Entropy
- 4.5. Patent/Trademark Analysis
- 5. Global Electronic Prescriptions Software Market Analysis, Insights and Forecast, 2019-2031
- 5.1. Market Analysis, Insights and Forecast - by Component
- 5.1.1. Hardware
- 5.1.2. Software
- 5.1.3. Services
- 5.2. Market Analysis, Insights and Forecast - by Type of System
- 5.2.1. Stand-alone E-prescribing System
- 5.2.2. Integrated E-prescribing System
- 5.3. Market Analysis, Insights and Forecast - by Delivery Mode
- 5.3.1. Cloud Based
- 5.3.2. Web Based
- 5.3.3. On-Premise
- 5.4. Market Analysis, Insights and Forecast - by End Users
- 5.4.1. Hospitals
- 5.4.2. Clinics
- 5.5. Market Analysis, Insights and Forecast - by Region
- 5.5.1. North America
- 5.5.2. Europe
- 5.5.3. Asia Pacific
- 5.5.4. Middle East and Africa
- 5.5.5. South America
- 5.1. Market Analysis, Insights and Forecast - by Component
- 6. North America Electronic Prescriptions Software Market Analysis, Insights and Forecast, 2019-2031
- 6.1. Market Analysis, Insights and Forecast - by Component
- 6.1.1. Hardware
- 6.1.2. Software
- 6.1.3. Services
- 6.2. Market Analysis, Insights and Forecast - by Type of System
- 6.2.1. Stand-alone E-prescribing System
- 6.2.2. Integrated E-prescribing System
- 6.3. Market Analysis, Insights and Forecast - by Delivery Mode
- 6.3.1. Cloud Based
- 6.3.2. Web Based
- 6.3.3. On-Premise
- 6.4. Market Analysis, Insights and Forecast - by End Users
- 6.4.1. Hospitals
- 6.4.2. Clinics
- 6.1. Market Analysis, Insights and Forecast - by Component
- 7. Europe Electronic Prescriptions Software Market Analysis, Insights and Forecast, 2019-2031
- 7.1. Market Analysis, Insights and Forecast - by Component
- 7.1.1. Hardware
- 7.1.2. Software
- 7.1.3. Services
- 7.2. Market Analysis, Insights and Forecast - by Type of System
- 7.2.1. Stand-alone E-prescribing System
- 7.2.2. Integrated E-prescribing System
- 7.3. Market Analysis, Insights and Forecast - by Delivery Mode
- 7.3.1. Cloud Based
- 7.3.2. Web Based
- 7.3.3. On-Premise
- 7.4. Market Analysis, Insights and Forecast - by End Users
- 7.4.1. Hospitals
- 7.4.2. Clinics
- 7.1. Market Analysis, Insights and Forecast - by Component
- 8. Asia Pacific Electronic Prescriptions Software Market Analysis, Insights and Forecast, 2019-2031
- 8.1. Market Analysis, Insights and Forecast - by Component
- 8.1.1. Hardware
- 8.1.2. Software
- 8.1.3. Services
- 8.2. Market Analysis, Insights and Forecast - by Type of System
- 8.2.1. Stand-alone E-prescribing System
- 8.2.2. Integrated E-prescribing System
- 8.3. Market Analysis, Insights and Forecast - by Delivery Mode
- 8.3.1. Cloud Based
- 8.3.2. Web Based
- 8.3.3. On-Premise
- 8.4. Market Analysis, Insights and Forecast - by End Users
- 8.4.1. Hospitals
- 8.4.2. Clinics
- 8.1. Market Analysis, Insights and Forecast - by Component
- 9. Middle East and Africa Electronic Prescriptions Software Market Analysis, Insights and Forecast, 2019-2031
- 9.1. Market Analysis, Insights and Forecast - by Component
- 9.1.1. Hardware
- 9.1.2. Software
- 9.1.3. Services
- 9.2. Market Analysis, Insights and Forecast - by Type of System
- 9.2.1. Stand-alone E-prescribing System
- 9.2.2. Integrated E-prescribing System
- 9.3. Market Analysis, Insights and Forecast - by Delivery Mode
- 9.3.1. Cloud Based
- 9.3.2. Web Based
- 9.3.3. On-Premise
- 9.4. Market Analysis, Insights and Forecast - by End Users
- 9.4.1. Hospitals
- 9.4.2. Clinics
- 9.1. Market Analysis, Insights and Forecast - by Component
- 10. South America Electronic Prescriptions Software Market Analysis, Insights and Forecast, 2019-2031
- 10.1. Market Analysis, Insights and Forecast - by Component
- 10.1.1. Hardware
- 10.1.2. Software
- 10.1.3. Services
- 10.2. Market Analysis, Insights and Forecast - by Type of System
- 10.2.1. Stand-alone E-prescribing System
- 10.2.2. Integrated E-prescribing System
- 10.3. Market Analysis, Insights and Forecast - by Delivery Mode
- 10.3.1. Cloud Based
- 10.3.2. Web Based
- 10.3.3. On-Premise
- 10.4. Market Analysis, Insights and Forecast - by End Users
- 10.4.1. Hospitals
- 10.4.2. Clinics
- 10.1. Market Analysis, Insights and Forecast - by Component
- 11. North America Electronic Prescriptions Software Market Analysis, Insights and Forecast, 2019-2031
- 11.1. Market Analysis, Insights and Forecast - By Country/Sub-region
- 11.1.1 United States
- 11.1.2 Canada
- 11.1.3 Mexico
- 12. Europe Electronic Prescriptions Software Market Analysis, Insights and Forecast, 2019-2031
- 12.1. Market Analysis, Insights and Forecast - By Country/Sub-region
- 12.1.1 Germany
- 12.1.2 United Kingdom
- 12.1.3 France
- 12.1.4 Italy
- 12.1.5 Spain
- 12.1.6 Rest of Europe
- 13. Asia Pacific Electronic Prescriptions Software Market Analysis, Insights and Forecast, 2019-2031
- 13.1. Market Analysis, Insights and Forecast - By Country/Sub-region
- 13.1.1 China
- 13.1.2 Japan
- 13.1.3 India
- 13.1.4 Australia
- 13.1.5 South Korea
- 13.1.6 Rest of Asia Pacific
- 14. Middle East and Africa Electronic Prescriptions Software Market Analysis, Insights and Forecast, 2019-2031
- 14.1. Market Analysis, Insights and Forecast - By Country/Sub-region
- 14.1.1 GCC
- 14.1.2 South Africa
- 14.1.3 Rest of Middle East and Africa
- 15. South America Electronic Prescriptions Software Market Analysis, Insights and Forecast, 2019-2031
- 15.1. Market Analysis, Insights and Forecast - By Country/Sub-region
- 15.1.1 Brazil
- 15.1.2 Argentina
- 15.1.3 Rest of South America
- 16. Competitive Analysis
- 16.1. Global Market Share Analysis 2024
- 16.2. Company Profiles
- 16.2.1 eMDs Inc
- 16.2.1.1. Overview
- 16.2.1.2. Products
- 16.2.1.3. SWOT Analysis
- 16.2.1.4. Recent Developments
- 16.2.1.5. Financials (Based on Availability)
- 16.2.2 Oracle (Cerner Corporation)
- 16.2.2.1. Overview
- 16.2.2.2. Products
- 16.2.2.3. SWOT Analysis
- 16.2.2.4. Recent Developments
- 16.2.2.5. Financials (Based on Availability)
- 16.2.3 eClinicalWorks
- 16.2.3.1. Overview
- 16.2.3.2. Products
- 16.2.3.3. SWOT Analysis
- 16.2.3.4. Recent Developments
- 16.2.3.5. Financials (Based on Availability)
- 16.2.4 Surescripts
- 16.2.4.1. Overview
- 16.2.4.2. Products
- 16.2.4.3. SWOT Analysis
- 16.2.4.4. Recent Developments
- 16.2.4.5. Financials (Based on Availability)
- 16.2.5 Relayhealth Corporation
- 16.2.5.1. Overview
- 16.2.5.2. Products
- 16.2.5.3. SWOT Analysis
- 16.2.5.4. Recent Developments
- 16.2.5.5. Financials (Based on Availability)
- 16.2.6 Allscripts Healthcare Solutions Inc (Veradigm)
- 16.2.6.1. Overview
- 16.2.6.2. Products
- 16.2.6.3. SWOT Analysis
- 16.2.6.4. Recent Developments
- 16.2.6.5. Financials (Based on Availability)
- 16.2.7 NextGen Healthcare Inc
- 16.2.7.1. Overview
- 16.2.7.2. Products
- 16.2.7.3. SWOT Analysis
- 16.2.7.4. Recent Developments
- 16.2.7.5. Financials (Based on Availability)
- 16.2.8 DrFirst
- 16.2.8.1. Overview
- 16.2.8.2. Products
- 16.2.8.3. SWOT Analysis
- 16.2.8.4. Recent Developments
- 16.2.8.5. Financials (Based on Availability)
- 16.2.9 Athenahealth Inc
- 16.2.9.1. Overview
- 16.2.9.2. Products
- 16.2.9.3. SWOT Analysis
- 16.2.9.4. Recent Developments
- 16.2.9.5. Financials (Based on Availability)
- 16.2.1 eMDs Inc
List of Figures
- Figure 1: Global Electronic Prescriptions Software Market Revenue Breakdown (Million, %) by Region 2024 & 2032
- Figure 2: Global Electronic Prescriptions Software Market Volume Breakdown (K Unit, %) by Region 2024 & 2032
- Figure 3: North America Electronic Prescriptions Software Market Revenue (Million), by Country 2024 & 2032
- Figure 4: North America Electronic Prescriptions Software Market Volume (K Unit), by Country 2024 & 2032
- Figure 5: North America Electronic Prescriptions Software Market Revenue Share (%), by Country 2024 & 2032
- Figure 6: North America Electronic Prescriptions Software Market Volume Share (%), by Country 2024 & 2032
- Figure 7: Europe Electronic Prescriptions Software Market Revenue (Million), by Country 2024 & 2032
- Figure 8: Europe Electronic Prescriptions Software Market Volume (K Unit), by Country 2024 & 2032
- Figure 9: Europe Electronic Prescriptions Software Market Revenue Share (%), by Country 2024 & 2032
- Figure 10: Europe Electronic Prescriptions Software Market Volume Share (%), by Country 2024 & 2032
- Figure 11: Asia Pacific Electronic Prescriptions Software Market Revenue (Million), by Country 2024 & 2032
- Figure 12: Asia Pacific Electronic Prescriptions Software Market Volume (K Unit), by Country 2024 & 2032
- Figure 13: Asia Pacific Electronic Prescriptions Software Market Revenue Share (%), by Country 2024 & 2032
- Figure 14: Asia Pacific Electronic Prescriptions Software Market Volume Share (%), by Country 2024 & 2032
- Figure 15: Middle East and Africa Electronic Prescriptions Software Market Revenue (Million), by Country 2024 & 2032
- Figure 16: Middle East and Africa Electronic Prescriptions Software Market Volume (K Unit), by Country 2024 & 2032
- Figure 17: Middle East and Africa Electronic Prescriptions Software Market Revenue Share (%), by Country 2024 & 2032
- Figure 18: Middle East and Africa Electronic Prescriptions Software Market Volume Share (%), by Country 2024 & 2032
- Figure 19: South America Electronic Prescriptions Software Market Revenue (Million), by Country 2024 & 2032
- Figure 20: South America Electronic Prescriptions Software Market Volume (K Unit), by Country 2024 & 2032
- Figure 21: South America Electronic Prescriptions Software Market Revenue Share (%), by Country 2024 & 2032
- Figure 22: South America Electronic Prescriptions Software Market Volume Share (%), by Country 2024 & 2032
- Figure 23: North America Electronic Prescriptions Software Market Revenue (Million), by Component 2024 & 2032
- Figure 24: North America Electronic Prescriptions Software Market Volume (K Unit), by Component 2024 & 2032
- Figure 25: North America Electronic Prescriptions Software Market Revenue Share (%), by Component 2024 & 2032
- Figure 26: North America Electronic Prescriptions Software Market Volume Share (%), by Component 2024 & 2032
- Figure 27: North America Electronic Prescriptions Software Market Revenue (Million), by Type of System 2024 & 2032
- Figure 28: North America Electronic Prescriptions Software Market Volume (K Unit), by Type of System 2024 & 2032
- Figure 29: North America Electronic Prescriptions Software Market Revenue Share (%), by Type of System 2024 & 2032
- Figure 30: North America Electronic Prescriptions Software Market Volume Share (%), by Type of System 2024 & 2032
- Figure 31: North America Electronic Prescriptions Software Market Revenue (Million), by Delivery Mode 2024 & 2032
- Figure 32: North America Electronic Prescriptions Software Market Volume (K Unit), by Delivery Mode 2024 & 2032
- Figure 33: North America Electronic Prescriptions Software Market Revenue Share (%), by Delivery Mode 2024 & 2032
- Figure 34: North America Electronic Prescriptions Software Market Volume Share (%), by Delivery Mode 2024 & 2032
- Figure 35: North America Electronic Prescriptions Software Market Revenue (Million), by End Users 2024 & 2032
- Figure 36: North America Electronic Prescriptions Software Market Volume (K Unit), by End Users 2024 & 2032
- Figure 37: North America Electronic Prescriptions Software Market Revenue Share (%), by End Users 2024 & 2032
- Figure 38: North America Electronic Prescriptions Software Market Volume Share (%), by End Users 2024 & 2032
- Figure 39: North America Electronic Prescriptions Software Market Revenue (Million), by Country 2024 & 2032
- Figure 40: North America Electronic Prescriptions Software Market Volume (K Unit), by Country 2024 & 2032
- Figure 41: North America Electronic Prescriptions Software Market Revenue Share (%), by Country 2024 & 2032
- Figure 42: North America Electronic Prescriptions Software Market Volume Share (%), by Country 2024 & 2032
- Figure 43: Europe Electronic Prescriptions Software Market Revenue (Million), by Component 2024 & 2032
- Figure 44: Europe Electronic Prescriptions Software Market Volume (K Unit), by Component 2024 & 2032
- Figure 45: Europe Electronic Prescriptions Software Market Revenue Share (%), by Component 2024 & 2032
- Figure 46: Europe Electronic Prescriptions Software Market Volume Share (%), by Component 2024 & 2032
- Figure 47: Europe Electronic Prescriptions Software Market Revenue (Million), by Type of System 2024 & 2032
- Figure 48: Europe Electronic Prescriptions Software Market Volume (K Unit), by Type of System 2024 & 2032
- Figure 49: Europe Electronic Prescriptions Software Market Revenue Share (%), by Type of System 2024 & 2032
- Figure 50: Europe Electronic Prescriptions Software Market Volume Share (%), by Type of System 2024 & 2032
- Figure 51: Europe Electronic Prescriptions Software Market Revenue (Million), by Delivery Mode 2024 & 2032
- Figure 52: Europe Electronic Prescriptions Software Market Volume (K Unit), by Delivery Mode 2024 & 2032
- Figure 53: Europe Electronic Prescriptions Software Market Revenue Share (%), by Delivery Mode 2024 & 2032
- Figure 54: Europe Electronic Prescriptions Software Market Volume Share (%), by Delivery Mode 2024 & 2032
- Figure 55: Europe Electronic Prescriptions Software Market Revenue (Million), by End Users 2024 & 2032
- Figure 56: Europe Electronic Prescriptions Software Market Volume (K Unit), by End Users 2024 & 2032
- Figure 57: Europe Electronic Prescriptions Software Market Revenue Share (%), by End Users 2024 & 2032
- Figure 58: Europe Electronic Prescriptions Software Market Volume Share (%), by End Users 2024 & 2032
- Figure 59: Europe Electronic Prescriptions Software Market Revenue (Million), by Country 2024 & 2032
- Figure 60: Europe Electronic Prescriptions Software Market Volume (K Unit), by Country 2024 & 2032
- Figure 61: Europe Electronic Prescriptions Software Market Revenue Share (%), by Country 2024 & 2032
- Figure 62: Europe Electronic Prescriptions Software Market Volume Share (%), by Country 2024 & 2032
- Figure 63: Asia Pacific Electronic Prescriptions Software Market Revenue (Million), by Component 2024 & 2032
- Figure 64: Asia Pacific Electronic Prescriptions Software Market Volume (K Unit), by Component 2024 & 2032
- Figure 65: Asia Pacific Electronic Prescriptions Software Market Revenue Share (%), by Component 2024 & 2032
- Figure 66: Asia Pacific Electronic Prescriptions Software Market Volume Share (%), by Component 2024 & 2032
- Figure 67: Asia Pacific Electronic Prescriptions Software Market Revenue (Million), by Type of System 2024 & 2032
- Figure 68: Asia Pacific Electronic Prescriptions Software Market Volume (K Unit), by Type of System 2024 & 2032
- Figure 69: Asia Pacific Electronic Prescriptions Software Market Revenue Share (%), by Type of System 2024 & 2032
- Figure 70: Asia Pacific Electronic Prescriptions Software Market Volume Share (%), by Type of System 2024 & 2032
- Figure 71: Asia Pacific Electronic Prescriptions Software Market Revenue (Million), by Delivery Mode 2024 & 2032
- Figure 72: Asia Pacific Electronic Prescriptions Software Market Volume (K Unit), by Delivery Mode 2024 & 2032
- Figure 73: Asia Pacific Electronic Prescriptions Software Market Revenue Share (%), by Delivery Mode 2024 & 2032
- Figure 74: Asia Pacific Electronic Prescriptions Software Market Volume Share (%), by Delivery Mode 2024 & 2032
- Figure 75: Asia Pacific Electronic Prescriptions Software Market Revenue (Million), by End Users 2024 & 2032
- Figure 76: Asia Pacific Electronic Prescriptions Software Market Volume (K Unit), by End Users 2024 & 2032
- Figure 77: Asia Pacific Electronic Prescriptions Software Market Revenue Share (%), by End Users 2024 & 2032
- Figure 78: Asia Pacific Electronic Prescriptions Software Market Volume Share (%), by End Users 2024 & 2032
- Figure 79: Asia Pacific Electronic Prescriptions Software Market Revenue (Million), by Country 2024 & 2032
- Figure 80: Asia Pacific Electronic Prescriptions Software Market Volume (K Unit), by Country 2024 & 2032
- Figure 81: Asia Pacific Electronic Prescriptions Software Market Revenue Share (%), by Country 2024 & 2032
- Figure 82: Asia Pacific Electronic Prescriptions Software Market Volume Share (%), by Country 2024 & 2032
- Figure 83: Middle East and Africa Electronic Prescriptions Software Market Revenue (Million), by Component 2024 & 2032
- Figure 84: Middle East and Africa Electronic Prescriptions Software Market Volume (K Unit), by Component 2024 & 2032
- Figure 85: Middle East and Africa Electronic Prescriptions Software Market Revenue Share (%), by Component 2024 & 2032
- Figure 86: Middle East and Africa Electronic Prescriptions Software Market Volume Share (%), by Component 2024 & 2032
- Figure 87: Middle East and Africa Electronic Prescriptions Software Market Revenue (Million), by Type of System 2024 & 2032
- Figure 88: Middle East and Africa Electronic Prescriptions Software Market Volume (K Unit), by Type of System 2024 & 2032
- Figure 89: Middle East and Africa Electronic Prescriptions Software Market Revenue Share (%), by Type of System 2024 & 2032
- Figure 90: Middle East and Africa Electronic Prescriptions Software Market Volume Share (%), by Type of System 2024 & 2032
- Figure 91: Middle East and Africa Electronic Prescriptions Software Market Revenue (Million), by Delivery Mode 2024 & 2032
- Figure 92: Middle East and Africa Electronic Prescriptions Software Market Volume (K Unit), by Delivery Mode 2024 & 2032
- Figure 93: Middle East and Africa Electronic Prescriptions Software Market Revenue Share (%), by Delivery Mode 2024 & 2032
- Figure 94: Middle East and Africa Electronic Prescriptions Software Market Volume Share (%), by Delivery Mode 2024 & 2032
- Figure 95: Middle East and Africa Electronic Prescriptions Software Market Revenue (Million), by End Users 2024 & 2032
- Figure 96: Middle East and Africa Electronic Prescriptions Software Market Volume (K Unit), by End Users 2024 & 2032
- Figure 97: Middle East and Africa Electronic Prescriptions Software Market Revenue Share (%), by End Users 2024 & 2032
- Figure 98: Middle East and Africa Electronic Prescriptions Software Market Volume Share (%), by End Users 2024 & 2032
- Figure 99: Middle East and Africa Electronic Prescriptions Software Market Revenue (Million), by Country 2024 & 2032
- Figure 100: Middle East and Africa Electronic Prescriptions Software Market Volume (K Unit), by Country 2024 & 2032
- Figure 101: Middle East and Africa Electronic Prescriptions Software Market Revenue Share (%), by Country 2024 & 2032
- Figure 102: Middle East and Africa Electronic Prescriptions Software Market Volume Share (%), by Country 2024 & 2032
- Figure 103: South America Electronic Prescriptions Software Market Revenue (Million), by Component 2024 & 2032
- Figure 104: South America Electronic Prescriptions Software Market Volume (K Unit), by Component 2024 & 2032
- Figure 105: South America Electronic Prescriptions Software Market Revenue Share (%), by Component 2024 & 2032
- Figure 106: South America Electronic Prescriptions Software Market Volume Share (%), by Component 2024 & 2032
- Figure 107: South America Electronic Prescriptions Software Market Revenue (Million), by Type of System 2024 & 2032
- Figure 108: South America Electronic Prescriptions Software Market Volume (K Unit), by Type of System 2024 & 2032
- Figure 109: South America Electronic Prescriptions Software Market Revenue Share (%), by Type of System 2024 & 2032
- Figure 110: South America Electronic Prescriptions Software Market Volume Share (%), by Type of System 2024 & 2032
- Figure 111: South America Electronic Prescriptions Software Market Revenue (Million), by Delivery Mode 2024 & 2032
- Figure 112: South America Electronic Prescriptions Software Market Volume (K Unit), by Delivery Mode 2024 & 2032
- Figure 113: South America Electronic Prescriptions Software Market Revenue Share (%), by Delivery Mode 2024 & 2032
- Figure 114: South America Electronic Prescriptions Software Market Volume Share (%), by Delivery Mode 2024 & 2032
- Figure 115: South America Electronic Prescriptions Software Market Revenue (Million), by End Users 2024 & 2032
- Figure 116: South America Electronic Prescriptions Software Market Volume (K Unit), by End Users 2024 & 2032
- Figure 117: South America Electronic Prescriptions Software Market Revenue Share (%), by End Users 2024 & 2032
- Figure 118: South America Electronic Prescriptions Software Market Volume Share (%), by End Users 2024 & 2032
- Figure 119: South America Electronic Prescriptions Software Market Revenue (Million), by Country 2024 & 2032
- Figure 120: South America Electronic Prescriptions Software Market Volume (K Unit), by Country 2024 & 2032
- Figure 121: South America Electronic Prescriptions Software Market Revenue Share (%), by Country 2024 & 2032
- Figure 122: South America Electronic Prescriptions Software Market Volume Share (%), by Country 2024 & 2032
List of Tables
- Table 1: Global Electronic Prescriptions Software Market Revenue Million Forecast, by Region 2019 & 2032
- Table 2: Global Electronic Prescriptions Software Market Volume K Unit Forecast, by Region 2019 & 2032
- Table 3: Global Electronic Prescriptions Software Market Revenue Million Forecast, by Component 2019 & 2032
- Table 4: Global Electronic Prescriptions Software Market Volume K Unit Forecast, by Component 2019 & 2032
- Table 5: Global Electronic Prescriptions Software Market Revenue Million Forecast, by Type of System 2019 & 2032
- Table 6: Global Electronic Prescriptions Software Market Volume K Unit Forecast, by Type of System 2019 & 2032
- Table 7: Global Electronic Prescriptions Software Market Revenue Million Forecast, by Delivery Mode 2019 & 2032
- Table 8: Global Electronic Prescriptions Software Market Volume K Unit Forecast, by Delivery Mode 2019 & 2032
- Table 9: Global Electronic Prescriptions Software Market Revenue Million Forecast, by End Users 2019 & 2032
- Table 10: Global Electronic Prescriptions Software Market Volume K Unit Forecast, by End Users 2019 & 2032
- Table 11: Global Electronic Prescriptions Software Market Revenue Million Forecast, by Region 2019 & 2032
- Table 12: Global Electronic Prescriptions Software Market Volume K Unit Forecast, by Region 2019 & 2032
- Table 13: Global Electronic Prescriptions Software Market Revenue Million Forecast, by Country 2019 & 2032
- Table 14: Global Electronic Prescriptions Software Market Volume K Unit Forecast, by Country 2019 & 2032
- Table 15: United States Electronic Prescriptions Software Market Revenue (Million) Forecast, by Application 2019 & 2032
- Table 16: United States Electronic Prescriptions Software Market Volume (K Unit) Forecast, by Application 2019 & 2032
- Table 17: Canada Electronic Prescriptions Software Market Revenue (Million) Forecast, by Application 2019 & 2032
- Table 18: Canada Electronic Prescriptions Software Market Volume (K Unit) Forecast, by Application 2019 & 2032
- Table 19: Mexico Electronic Prescriptions Software Market Revenue (Million) Forecast, by Application 2019 & 2032
- Table 20: Mexico Electronic Prescriptions Software Market Volume (K Unit) Forecast, by Application 2019 & 2032
- Table 21: Global Electronic Prescriptions Software Market Revenue Million Forecast, by Country 2019 & 2032
- Table 22: Global Electronic Prescriptions Software Market Volume K Unit Forecast, by Country 2019 & 2032
- Table 23: Germany Electronic Prescriptions Software Market Revenue (Million) Forecast, by Application 2019 & 2032
- Table 24: Germany Electronic Prescriptions Software Market Volume (K Unit) Forecast, by Application 2019 & 2032
- Table 25: United Kingdom Electronic Prescriptions Software Market Revenue (Million) Forecast, by Application 2019 & 2032
- Table 26: United Kingdom Electronic Prescriptions Software Market Volume (K Unit) Forecast, by Application 2019 & 2032
- Table 27: France Electronic Prescriptions Software Market Revenue (Million) Forecast, by Application 2019 & 2032
- Table 28: France Electronic Prescriptions Software Market Volume (K Unit) Forecast, by Application 2019 & 2032
- Table 29: Italy Electronic Prescriptions Software Market Revenue (Million) Forecast, by Application 2019 & 2032
- Table 30: Italy Electronic Prescriptions Software Market Volume (K Unit) Forecast, by Application 2019 & 2032
- Table 31: Spain Electronic Prescriptions Software Market Revenue (Million) Forecast, by Application 2019 & 2032
- Table 32: Spain Electronic Prescriptions Software Market Volume (K Unit) Forecast, by Application 2019 & 2032
- Table 33: Rest of Europe Electronic Prescriptions Software Market Revenue (Million) Forecast, by Application 2019 & 2032
- Table 34: Rest of Europe Electronic Prescriptions Software Market Volume (K Unit) Forecast, by Application 2019 & 2032
- Table 35: Global Electronic Prescriptions Software Market Revenue Million Forecast, by Country 2019 & 2032
- Table 36: Global Electronic Prescriptions Software Market Volume K Unit Forecast, by Country 2019 & 2032
- Table 37: China Electronic Prescriptions Software Market Revenue (Million) Forecast, by Application 2019 & 2032
- Table 38: China Electronic Prescriptions Software Market Volume (K Unit) Forecast, by Application 2019 & 2032
- Table 39: Japan Electronic Prescriptions Software Market Revenue (Million) Forecast, by Application 2019 & 2032
- Table 40: Japan Electronic Prescriptions Software Market Volume (K Unit) Forecast, by Application 2019 & 2032
- Table 41: India Electronic Prescriptions Software Market Revenue (Million) Forecast, by Application 2019 & 2032
- Table 42: India Electronic Prescriptions Software Market Volume (K Unit) Forecast, by Application 2019 & 2032
- Table 43: Australia Electronic Prescriptions Software Market Revenue (Million) Forecast, by Application 2019 & 2032
- Table 44: Australia Electronic Prescriptions Software Market Volume (K Unit) Forecast, by Application 2019 & 2032
- Table 45: South Korea Electronic Prescriptions Software Market Revenue (Million) Forecast, by Application 2019 & 2032
- Table 46: South Korea Electronic Prescriptions Software Market Volume (K Unit) Forecast, by Application 2019 & 2032
- Table 47: Rest of Asia Pacific Electronic Prescriptions Software Market Revenue (Million) Forecast, by Application 2019 & 2032
- Table 48: Rest of Asia Pacific Electronic Prescriptions Software Market Volume (K Unit) Forecast, by Application 2019 & 2032
- Table 49: Global Electronic Prescriptions Software Market Revenue Million Forecast, by Country 2019 & 2032
- Table 50: Global Electronic Prescriptions Software Market Volume K Unit Forecast, by Country 2019 & 2032
- Table 51: GCC Electronic Prescriptions Software Market Revenue (Million) Forecast, by Application 2019 & 2032
- Table 52: GCC Electronic Prescriptions Software Market Volume (K Unit) Forecast, by Application 2019 & 2032
- Table 53: South Africa Electronic Prescriptions Software Market Revenue (Million) Forecast, by Application 2019 & 2032
- Table 54: South Africa Electronic Prescriptions Software Market Volume (K Unit) Forecast, by Application 2019 & 2032
- Table 55: Rest of Middle East and Africa Electronic Prescriptions Software Market Revenue (Million) Forecast, by Application 2019 & 2032
- Table 56: Rest of Middle East and Africa Electronic Prescriptions Software Market Volume (K Unit) Forecast, by Application 2019 & 2032
- Table 57: Global Electronic Prescriptions Software Market Revenue Million Forecast, by Country 2019 & 2032
- Table 58: Global Electronic Prescriptions Software Market Volume K Unit Forecast, by Country 2019 & 2032
- Table 59: Brazil Electronic Prescriptions Software Market Revenue (Million) Forecast, by Application 2019 & 2032
- Table 60: Brazil Electronic Prescriptions Software Market Volume (K Unit) Forecast, by Application 2019 & 2032
- Table 61: Argentina Electronic Prescriptions Software Market Revenue (Million) Forecast, by Application 2019 & 2032
- Table 62: Argentina Electronic Prescriptions Software Market Volume (K Unit) Forecast, by Application 2019 & 2032
- Table 63: Rest of South America Electronic Prescriptions Software Market Revenue (Million) Forecast, by Application 2019 & 2032
- Table 64: Rest of South America Electronic Prescriptions Software Market Volume (K Unit) Forecast, by Application 2019 & 2032
- Table 65: Global Electronic Prescriptions Software Market Revenue Million Forecast, by Component 2019 & 2032
- Table 66: Global Electronic Prescriptions Software Market Volume K Unit Forecast, by Component 2019 & 2032
- Table 67: Global Electronic Prescriptions Software Market Revenue Million Forecast, by Type of System 2019 & 2032
- Table 68: Global Electronic Prescriptions Software Market Volume K Unit Forecast, by Type of System 2019 & 2032
- Table 69: Global Electronic Prescriptions Software Market Revenue Million Forecast, by Delivery Mode 2019 & 2032
- Table 70: Global Electronic Prescriptions Software Market Volume K Unit Forecast, by Delivery Mode 2019 & 2032
- Table 71: Global Electronic Prescriptions Software Market Revenue Million Forecast, by End Users 2019 & 2032
- Table 72: Global Electronic Prescriptions Software Market Volume K Unit Forecast, by End Users 2019 & 2032
- Table 73: Global Electronic Prescriptions Software Market Revenue Million Forecast, by Country 2019 & 2032
- Table 74: Global Electronic Prescriptions Software Market Volume K Unit Forecast, by Country 2019 & 2032
- Table 75: United States Electronic Prescriptions Software Market Revenue (Million) Forecast, by Application 2019 & 2032
- Table 76: United States Electronic Prescriptions Software Market Volume (K Unit) Forecast, by Application 2019 & 2032
- Table 77: Canada Electronic Prescriptions Software Market Revenue (Million) Forecast, by Application 2019 & 2032
- Table 78: Canada Electronic Prescriptions Software Market Volume (K Unit) Forecast, by Application 2019 & 2032
- Table 79: Mexico Electronic Prescriptions Software Market Revenue (Million) Forecast, by Application 2019 & 2032
- Table 80: Mexico Electronic Prescriptions Software Market Volume (K Unit) Forecast, by Application 2019 & 2032
- Table 81: Global Electronic Prescriptions Software Market Revenue Million Forecast, by Component 2019 & 2032
- Table 82: Global Electronic Prescriptions Software Market Volume K Unit Forecast, by Component 2019 & 2032
- Table 83: Global Electronic Prescriptions Software Market Revenue Million Forecast, by Type of System 2019 & 2032
- Table 84: Global Electronic Prescriptions Software Market Volume K Unit Forecast, by Type of System 2019 & 2032
- Table 85: Global Electronic Prescriptions Software Market Revenue Million Forecast, by Delivery Mode 2019 & 2032
- Table 86: Global Electronic Prescriptions Software Market Volume K Unit Forecast, by Delivery Mode 2019 & 2032
- Table 87: Global Electronic Prescriptions Software Market Revenue Million Forecast, by End Users 2019 & 2032
- Table 88: Global Electronic Prescriptions Software Market Volume K Unit Forecast, by End Users 2019 & 2032
- Table 89: Global Electronic Prescriptions Software Market Revenue Million Forecast, by Country 2019 & 2032
- Table 90: Global Electronic Prescriptions Software Market Volume K Unit Forecast, by Country 2019 & 2032
- Table 91: Germany Electronic Prescriptions Software Market Revenue (Million) Forecast, by Application 2019 & 2032
- Table 92: Germany Electronic Prescriptions Software Market Volume (K Unit) Forecast, by Application 2019 & 2032
- Table 93: United Kingdom Electronic Prescriptions Software Market Revenue (Million) Forecast, by Application 2019 & 2032
- Table 94: United Kingdom Electronic Prescriptions Software Market Volume (K Unit) Forecast, by Application 2019 & 2032
- Table 95: France Electronic Prescriptions Software Market Revenue (Million) Forecast, by Application 2019 & 2032
- Table 96: France Electronic Prescriptions Software Market Volume (K Unit) Forecast, by Application 2019 & 2032
- Table 97: Italy Electronic Prescriptions Software Market Revenue (Million) Forecast, by Application 2019 & 2032
- Table 98: Italy Electronic Prescriptions Software Market Volume (K Unit) Forecast, by Application 2019 & 2032
- Table 99: Spain Electronic Prescriptions Software Market Revenue (Million) Forecast, by Application 2019 & 2032
- Table 100: Spain Electronic Prescriptions Software Market Volume (K Unit) Forecast, by Application 2019 & 2032
- Table 101: Rest of Europe Electronic Prescriptions Software Market Revenue (Million) Forecast, by Application 2019 & 2032
- Table 102: Rest of Europe Electronic Prescriptions Software Market Volume (K Unit) Forecast, by Application 2019 & 2032
- Table 103: Global Electronic Prescriptions Software Market Revenue Million Forecast, by Component 2019 & 2032
- Table 104: Global Electronic Prescriptions Software Market Volume K Unit Forecast, by Component 2019 & 2032
- Table 105: Global Electronic Prescriptions Software Market Revenue Million Forecast, by Type of System 2019 & 2032
- Table 106: Global Electronic Prescriptions Software Market Volume K Unit Forecast, by Type of System 2019 & 2032
- Table 107: Global Electronic Prescriptions Software Market Revenue Million Forecast, by Delivery Mode 2019 & 2032
- Table 108: Global Electronic Prescriptions Software Market Volume K Unit Forecast, by Delivery Mode 2019 & 2032
- Table 109: Global Electronic Prescriptions Software Market Revenue Million Forecast, by End Users 2019 & 2032
- Table 110: Global Electronic Prescriptions Software Market Volume K Unit Forecast, by End Users 2019 & 2032
- Table 111: Global Electronic Prescriptions Software Market Revenue Million Forecast, by Country 2019 & 2032
- Table 112: Global Electronic Prescriptions Software Market Volume K Unit Forecast, by Country 2019 & 2032
- Table 113: China Electronic Prescriptions Software Market Revenue (Million) Forecast, by Application 2019 & 2032
- Table 114: China Electronic Prescriptions Software Market Volume (K Unit) Forecast, by Application 2019 & 2032
- Table 115: Japan Electronic Prescriptions Software Market Revenue (Million) Forecast, by Application 2019 & 2032
- Table 116: Japan Electronic Prescriptions Software Market Volume (K Unit) Forecast, by Application 2019 & 2032
- Table 117: India Electronic Prescriptions Software Market Revenue (Million) Forecast, by Application 2019 & 2032
- Table 118: India Electronic Prescriptions Software Market Volume (K Unit) Forecast, by Application 2019 & 2032
- Table 119: Australia Electronic Prescriptions Software Market Revenue (Million) Forecast, by Application 2019 & 2032
- Table 120: Australia Electronic Prescriptions Software Market Volume (K Unit) Forecast, by Application 2019 & 2032
- Table 121: South Korea Electronic Prescriptions Software Market Revenue (Million) Forecast, by Application 2019 & 2032
- Table 122: South Korea Electronic Prescriptions Software Market Volume (K Unit) Forecast, by Application 2019 & 2032
- Table 123: Rest of Asia Pacific Electronic Prescriptions Software Market Revenue (Million) Forecast, by Application 2019 & 2032
- Table 124: Rest of Asia Pacific Electronic Prescriptions Software Market Volume (K Unit) Forecast, by Application 2019 & 2032
- Table 125: Global Electronic Prescriptions Software Market Revenue Million Forecast, by Component 2019 & 2032
- Table 126: Global Electronic Prescriptions Software Market Volume K Unit Forecast, by Component 2019 & 2032
- Table 127: Global Electronic Prescriptions Software Market Revenue Million Forecast, by Type of System 2019 & 2032
- Table 128: Global Electronic Prescriptions Software Market Volume K Unit Forecast, by Type of System 2019 & 2032
- Table 129: Global Electronic Prescriptions Software Market Revenue Million Forecast, by Delivery Mode 2019 & 2032
- Table 130: Global Electronic Prescriptions Software Market Volume K Unit Forecast, by Delivery Mode 2019 & 2032
- Table 131: Global Electronic Prescriptions Software Market Revenue Million Forecast, by End Users 2019 & 2032
- Table 132: Global Electronic Prescriptions Software Market Volume K Unit Forecast, by End Users 2019 & 2032
- Table 133: Global Electronic Prescriptions Software Market Revenue Million Forecast, by Country 2019 & 2032
- Table 134: Global Electronic Prescriptions Software Market Volume K Unit Forecast, by Country 2019 & 2032
- Table 135: GCC Electronic Prescriptions Software Market Revenue (Million) Forecast, by Application 2019 & 2032
- Table 136: GCC Electronic Prescriptions Software Market Volume (K Unit) Forecast, by Application 2019 & 2032
- Table 137: South Africa Electronic Prescriptions Software Market Revenue (Million) Forecast, by Application 2019 & 2032
- Table 138: South Africa Electronic Prescriptions Software Market Volume (K Unit) Forecast, by Application 2019 & 2032
- Table 139: Rest of Middle East and Africa Electronic Prescriptions Software Market Revenue (Million) Forecast, by Application 2019 & 2032
- Table 140: Rest of Middle East and Africa Electronic Prescriptions Software Market Volume (K Unit) Forecast, by Application 2019 & 2032
- Table 141: Global Electronic Prescriptions Software Market Revenue Million Forecast, by Component 2019 & 2032
- Table 142: Global Electronic Prescriptions Software Market Volume K Unit Forecast, by Component 2019 & 2032
- Table 143: Global Electronic Prescriptions Software Market Revenue Million Forecast, by Type of System 2019 & 2032
- Table 144: Global Electronic Prescriptions Software Market Volume K Unit Forecast, by Type of System 2019 & 2032
- Table 145: Global Electronic Prescriptions Software Market Revenue Million Forecast, by Delivery Mode 2019 & 2032
- Table 146: Global Electronic Prescriptions Software Market Volume K Unit Forecast, by Delivery Mode 2019 & 2032
- Table 147: Global Electronic Prescriptions Software Market Revenue Million Forecast, by End Users 2019 & 2032
- Table 148: Global Electronic Prescriptions Software Market Volume K Unit Forecast, by End Users 2019 & 2032
- Table 149: Global Electronic Prescriptions Software Market Revenue Million Forecast, by Country 2019 & 2032
- Table 150: Global Electronic Prescriptions Software Market Volume K Unit Forecast, by Country 2019 & 2032
- Table 151: Brazil Electronic Prescriptions Software Market Revenue (Million) Forecast, by Application 2019 & 2032
- Table 152: Brazil Electronic Prescriptions Software Market Volume (K Unit) Forecast, by Application 2019 & 2032
- Table 153: Argentina Electronic Prescriptions Software Market Revenue (Million) Forecast, by Application 2019 & 2032
- Table 154: Argentina Electronic Prescriptions Software Market Volume (K Unit) Forecast, by Application 2019 & 2032
- Table 155: Rest of South America Electronic Prescriptions Software Market Revenue (Million) Forecast, by Application 2019 & 2032
- Table 156: Rest of South America Electronic Prescriptions Software Market Volume (K Unit) Forecast, by Application 2019 & 2032
Frequently Asked Questions
1. What is the projected Compound Annual Growth Rate (CAGR) of the Electronic Prescriptions Software Market?
The projected CAGR is approximately 24.19%.
2. Which companies are prominent players in the Electronic Prescriptions Software Market?
Key companies in the market include eMDs Inc, Oracle (Cerner Corporation), eClinicalWorks, Surescripts, Relayhealth Corporation, Allscripts Healthcare Solutions Inc (Veradigm), NextGen Healthcare Inc, DrFirst, Athenahealth Inc.
3. What are the main segments of the Electronic Prescriptions Software Market?
The market segments include Component, Type of System, Delivery Mode, End Users.
4. Can you provide details about the market size?
The market size is estimated to be USD 3.39 Million as of 2022.
5. What are some drivers contributing to market growth?
Minimisation of Prescription Errors; Rising Demand for E-prescription System; Better Quality of Healthcare and Cost Reduction.
6. What are the notable trends driving market growth?
Stand-alone E-prescribing System Segment is Expected to Witness Growth Over the Forecast Period.
7. Are there any restraints impacting market growth?
Security and Workflow Issues; Lack of Skilled Personnel to Handle the Systems.
8. Can you provide examples of recent developments in the market?
In March 2022, FDB (First Databank, Inc.), launched FDB Vela, a new, cloud-native e-prescribing network that enables the seamless flow of critical medication prescription information, benefits verification, and clinical decision support between prescribers, payers, pharmacies, and other constituents.
9. What pricing options are available for accessing the report?
Pricing options include single-user, multi-user, and enterprise licenses priced at USD 4750, USD 5250, and USD 8750 respectively.
10. Is the market size provided in terms of value or volume?
The market size is provided in terms of value, measured in Million and volume, measured in K Unit.
11. Are there any specific market keywords associated with the report?
Yes, the market keyword associated with the report is "Electronic Prescriptions Software Market," which aids in identifying and referencing the specific market segment covered.
12. How do I determine which pricing option suits my needs best?
The pricing options vary based on user requirements and access needs. Individual users may opt for single-user licenses, while businesses requiring broader access may choose multi-user or enterprise licenses for cost-effective access to the report.
13. Are there any additional resources or data provided in the Electronic Prescriptions Software Market report?
While the report offers comprehensive insights, it's advisable to review the specific contents or supplementary materials provided to ascertain if additional resources or data are available.
14. How can I stay updated on further developments or reports in the Electronic Prescriptions Software Market?
To stay informed about further developments, trends, and reports in the Electronic Prescriptions Software Market, consider subscribing to industry newsletters, following relevant companies and organizations, or regularly checking reputable industry news sources and publications.
Methodology
Step 1 - Identification of Relevant Samples Size from Population Database


Step 2 - Approaches for Defining Global Market Size (Value, Volume* & Price*)

Note*: In applicable scenarios
Step 3 - Data Sources
Primary Research
- Web Analytics
- Survey Reports
- Research Institute
- Latest Research Reports
- Opinion Leaders
Secondary Research
- Annual Reports
- White Paper
- Latest Press Release
- Industry Association
- Paid Database
- Investor Presentations

Step 4 - Data Triangulation
Involves using different sources of information in order to increase the validity of a study
These sources are likely to be stakeholders in a program - participants, other researchers, program staff, other community members, and so on.
Then we put all data in single framework & apply various statistical tools to find out the dynamic on the market.
During the analysis stage, feedback from the stakeholder groups would be compared to determine areas of agreement as well as areas of divergence


