

Key Insights
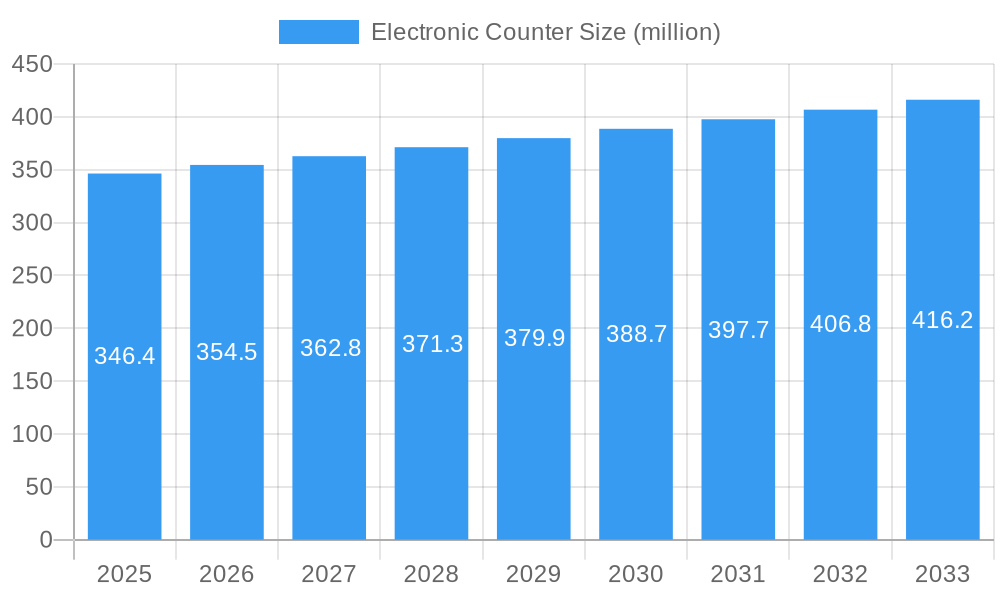
The global Electronic Counter market is poised for steady growth, projected to reach \$346.4 million by 2025, driven by a compound annual growth rate (CAGR) of 2.3% through 2033. This expansion is fueled by the increasing demand for automation and precision in manufacturing and production sectors, where electronic counters are indispensable for accurate process control and data acquisition. The "Packing" application segment is a significant contributor, witnessing substantial adoption as businesses streamline packaging operations for enhanced efficiency and reduced waste. Furthermore, the burgeoning adoption of advanced display technologies like LCD and LED displays in electronic counters enhances their usability and data readability, making them more attractive to a wider range of industries. Emerging economies, particularly in the Asia Pacific region, are expected to exhibit robust growth due to rapid industrialization and the increasing integration of smart manufacturing solutions.
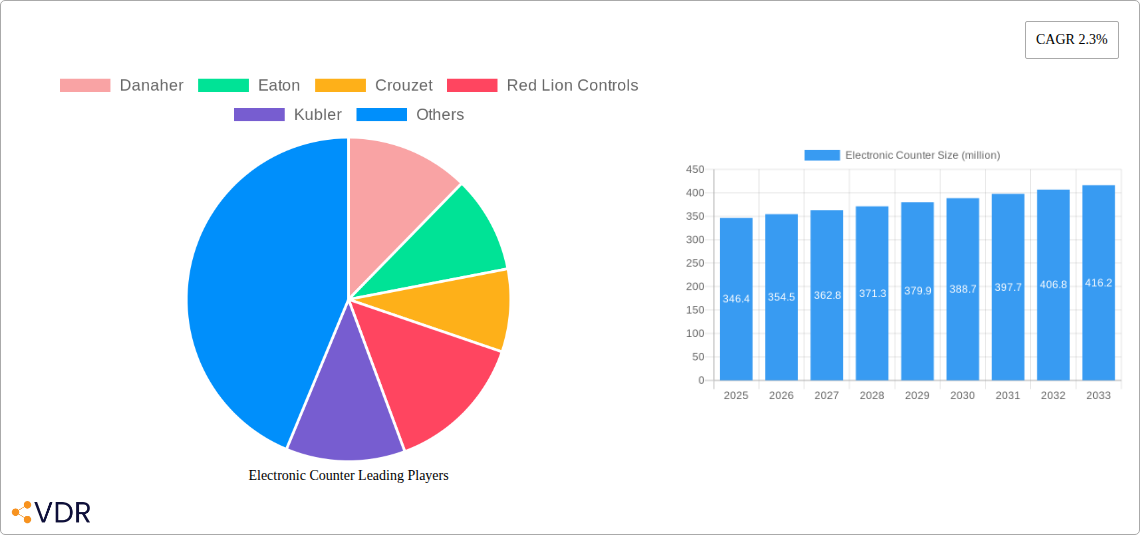
Electronic Counter Market Size (In Million)
Despite a positive outlook, the market faces certain challenges. High initial investment costs for sophisticated electronic counter systems and the availability of alternative, less expensive mechanical counters in certain niche applications could restrain rapid growth. However, the continuous innovation in product features, such as enhanced connectivity, digital interfaces, and improved durability, is expected to offset these restraints. The market is characterized by the presence of established players like Danaher and Eaton, alongside emerging companies, fostering a competitive landscape focused on technological advancements and cost-effectiveness. The increasing trend towards Industry 4.0 and the Internet of Things (IoT) will further propel the demand for smart electronic counters that can seamlessly integrate into connected industrial ecosystems, enabling real-time monitoring and predictive maintenance.
Electronic Counter Company Market Share
Comprehensive Report on the Global Electronic Counter Market: Dynamics, Growth, and Future Outlook (2019-2033)
This in-depth report provides a comprehensive analysis of the global Electronic Counter market, covering its dynamics, growth trajectories, regional dominance, product landscape, and future outlook from 2019 to 2033. With a base year of 2025 and a forecast period extending to 2033, this study offers critical insights for industry stakeholders, including manufacturers, suppliers, investors, and end-users. Leveraging advanced analytical methodologies and extensive market intelligence, the report delves into market concentration, technological innovation drivers, regulatory frameworks, competitive product substitutes, end-user demographics, and M&A trends. It also examines market size evolution, adoption rates, technological disruptions, and consumer behavior shifts, identifying leading regions, countries, and segments driving market growth across various applications and display types.
Electronic Counter Market Dynamics & Structure
The global Electronic Counter market exhibits a moderately consolidated structure, with a few key players holding significant market share. Technological innovation remains a primary driver, with advancements in sensor integration, wireless connectivity, and miniaturization pushing the boundaries of counter functionality. Robust regulatory frameworks, particularly concerning industrial safety and accuracy in measurement, are shaping product development and market entry. Competitive product substitutes, while present in niche applications, are largely overcome by the specialized precision and data logging capabilities of electronic counters. End-user demographics are shifting towards industries demanding greater automation and real-time data, particularly in manufacturing and packaging. Mergers and acquisitions (M&A) are a notable trend, with larger conglomerates acquiring specialized firms to expand their product portfolios and geographical reach. For instance, in the historical period (2019-2024), the market witnessed an estimated 5-7 M&A deals annually, primarily focused on acquiring innovative technologies or market access. Barriers to innovation include the high cost of R&D for advanced features and the need for stringent product certification processes.
- Market Concentration: Moderately consolidated, with key players like Danaher and Eaton dominating.
- Technological Innovation Drivers: Miniaturization, IoT integration, advanced sensor technology, improved display clarity.
- Regulatory Frameworks: Stringent standards for accuracy, safety (e.g., CE, UL certifications), and data privacy.
- Competitive Product Substitutes: Mechanical counters, simple tally counters, basic manual logging systems (limited in advanced applications).
- End-User Demographics: Increasing adoption in automated manufacturing, pharmaceuticals, food & beverage, and logistics.
- M&A Trends: Strategic acquisitions for technology enhancement and market expansion; an estimated 25-35 deals during the historical period (2019-2024).
- Innovation Barriers: High R&D investment, long product development cycles, complex certification processes.
Electronic Counter Growth Trends & Insights
The global Electronic Counter market is poised for robust growth, projected at a Compound Annual Growth Rate (CAGR) of approximately 5.8% from 2025 to 2033. This expansion is fueled by the increasing demand for precision automation and data-driven decision-making across diverse industries. The market size is expected to grow from an estimated $1.5 billion in 2025 to over $2.3 billion by 2033. Adoption rates are accelerating, particularly for counters with advanced features like data logging, remote monitoring capabilities, and integration with Industrial Internet of Things (IIoT) platforms. Technological disruptions, such as the advent of AI-powered predictive maintenance analytics that can utilize counter data, are creating new application avenues. Consumer behavior shifts are also playing a crucial role, with businesses increasingly prioritizing efficiency, traceability, and operational optimization. The penetration of digital displays and smart counters is rapidly increasing, outperforming traditional analogue models in industrial settings. For instance, the adoption of IIoT-enabled counters is projected to grow at a CAGR of over 7.5% during the forecast period. This trend is driven by the need for real-time production monitoring, quality control, and inventory management, all of which are significantly enhanced by accurate and accessible counting data. The shift towards Industry 4.0 principles across manufacturing sectors further bolsters the demand for sophisticated electronic counters that can seamlessly integrate into smart factory ecosystems.
Dominant Regions, Countries, or Segments in Electronic Counter
The Manufacturing/Production segment, driven by the global push for Industry 4.0 and automation, is expected to be the dominant force in the Electronic Counter market, accounting for an estimated 55% of the total market share by 2025. Within this segment, countries like China, Germany, the United States, and Japan are leading the charge due to their advanced manufacturing capabilities and significant investments in smart factory initiatives. The Asia-Pacific region, particularly China, is a powerhouse of manufacturing and is thus a primary consumer of electronic counters. Its dominance is bolstered by favorable government policies promoting industrial automation, substantial foreign direct investment in manufacturing facilities, and a vast domestic market. The "Others" application segment, encompassing sectors like agriculture, healthcare, and research, is also showing significant growth potential, driven by niche applications requiring precise counting for research, patient monitoring, and yield assessment.
In terms of display types, Digital Displays (including LCD and LED) are steadily outperforming Analogue Displays, capturing an estimated 70% of the market share by 2025. This is attributed to their superior readability, data display capabilities, and compatibility with digital systems.
- Dominant Segment (Application): Manufacturing/Production.
- Key Drivers: Industry 4.0 adoption, automation mandates, need for real-time production data, efficiency improvements.
- Market Share (2025): Estimated 55% of the total market.
- Growth Potential: High, with continuous investment in smart manufacturing.
- Dominant Region/Countries: Asia-Pacific (especially China), North America (USA), Europe (Germany).
- Key Drivers: Robust industrial bases, government initiatives for automation, technological advancements, skilled workforce.
- Market Share (2025): Asia-Pacific estimated 40%, North America 25%, Europe 20%.
- Growth Potential: Significant, driven by ongoing industrial upgrades and expansion.
- Dominant Segment (Type): Digital Displays (LCD and LED).
- Key Drivers: Enhanced readability, data integration, connectivity options, versatility in industrial environments.
- Market Share (2025): Estimated 70% of the total market.
- Growth Potential: Continued dominance as technology advances and costs decrease.
Electronic Counter Product Landscape
The electronic counter product landscape is characterized by a surge in intelligent and connected devices. Innovations are heavily focused on enhancing functionality, accuracy, and user experience. Modern electronic counters offer advanced features such as on-board data logging, wireless communication protocols (e.g., Wi-Fi, Bluetooth, LoRaWAN) for remote monitoring and integration with SCADA and IIoT systems, and improved energy efficiency. High-resolution LCD and vivid LED displays provide clear, easily readable information, even in challenging industrial environments. Product differentiation often lies in the specificity of their application, with specialized counters designed for unique tasks in packaging lines (e.g., counting individual items), manufacturing processes (e.g., batch counting, cycle counting), and other specialized industries. Performance metrics emphasize high counting speeds (up to 50,000 counts per minute), exceptional accuracy rates (e.g., ±1 count), and robust environmental resistance (IP ratings for dust and water). The integration of advanced sensor technologies, such as proximity sensors and optical sensors, further enhances their application versatility and reliability.
Key Drivers, Barriers & Challenges in Electronic Counter
Key Drivers:
- Industrial Automation & IIoT Integration: The widespread adoption of Industry 4.0 and the Industrial Internet of Things (IIoT) is a primary catalyst, driving demand for electronic counters that can provide real-time data for automated processes and performance monitoring.
- Demand for Precision & Accuracy: Industries like pharmaceuticals, food & beverage, and electronics require highly accurate counting for quality control, inventory management, and regulatory compliance, favoring sophisticated electronic counters.
- Technological Advancements: Continuous innovation in sensor technology, display clarity, connectivity, and miniaturization makes electronic counters more versatile, efficient, and cost-effective.
- Government Initiatives: Support for industrial modernization and smart manufacturing policies in various countries are boosting market adoption.
Barriers & Challenges:
- High Initial Investment Costs: For some advanced features, the initial cost of electronic counters can be a barrier for smaller enterprises compared to simpler mechanical alternatives.
- Technical Expertise Requirements: Integration and maintenance of sophisticated electronic counters, especially those with IoT capabilities, may require a certain level of technical expertise from end-users.
- Supply Chain Disruptions: Global supply chain volatility for electronic components can impact production volumes and lead times.
- Intense Competition: The market faces intense competition from established players and emerging regional manufacturers, leading to price pressures.
- Cybersecurity Concerns: As counters become more connected, ensuring the security of data transmitted and stored becomes a critical challenge.
Emerging Opportunities in Electronic Counter
Emerging opportunities in the electronic counter market lie in the expansion of IIoT integration and the development of predictive maintenance capabilities. The growing demand for smart factories and Industry 4.0 solutions is creating a significant market for counters that can seamlessly integrate into broader industrial networks, providing valuable data for real-time monitoring, process optimization, and asset management. Furthermore, the trend towards sustainable manufacturing is opening doors for energy-efficient electronic counters and those that contribute to waste reduction through precise material handling and counting. Niche applications in emerging sectors like advanced agriculture technology (e.g., seed counting, yield monitoring) and specialized laboratory equipment are also presenting untapped market potential. The development of AI-driven analytics that leverage counter data for predictive maintenance, identifying potential equipment failures before they occur, represents a significant growth avenue.
Growth Accelerators in the Electronic Counter Industry
Several factors are acting as growth accelerators for the electronic counter industry. The relentless pursuit of operational efficiency and cost reduction across all manufacturing sectors is a primary driver. As businesses strive to optimize their production lines, minimize waste, and improve inventory management, the demand for accurate and reliable electronic counters escalates. Technological breakthroughs, such as the development of more powerful microcontrollers, advanced sensor technologies with higher accuracy and faster response times, and more energy-efficient display solutions, are continuously enhancing the capabilities and attractiveness of electronic counters. Strategic partnerships between electronic counter manufacturers and software developers, particularly those specializing in IIoT platforms and data analytics, are creating synergistic opportunities for integrated solutions that offer enhanced value to end-users. Market expansion strategies, including entry into developing economies with nascent industrial sectors and the development of customized solutions for specific industry needs, are also contributing significantly to long-term growth.
Key Players Shaping the Electronic Counter Market
- Danaher
- Eaton
- Crouzet
- Red Lion Controls
- Kubler
- Trumeter Technologies
- KOYO Electronics Industries
- HOKUYO
- Line Seiki
- Shanghai Fengxian Zhelin electric instrument
- Simex
- Laurel Electronics
- ZONHO
Notable Milestones in Electronic Counter Sector
- 2019: Increased adoption of IoT-enabled counters for remote monitoring in manufacturing facilities.
- 2020: Launch of highly compact electronic counters with enhanced environmental resistance for harsh industrial applications.
- 2021: Introduction of AI-powered analytics integrated with electronic counters for predictive maintenance insights.
- 2022: Growing demand for energy-efficient electronic counters driven by sustainability initiatives.
- 2023: Significant advancements in touch-screen interface and user-friendly software for complex counting operations.
- 2024: Expansion of electronic counter applications into niche sectors like advanced agriculture and laboratory automation.
In-Depth Electronic Counter Market Outlook
The future outlook for the Electronic Counter market is exceptionally bright, driven by sustained demand for automation, data-driven insights, and operational efficiency. Growth accelerators such as advancements in IIoT connectivity, the increasing sophistication of predictive analytics powered by counter data, and the continuous drive for precision in manufacturing will fuel expansion. Strategic partnerships and market expansion into emerging economies with growing industrial bases will further bolster growth. The market is expected to witness continued innovation in product design, focusing on enhanced user interfaces, improved connectivity, and greater environmental resilience. This forward trajectory indicates a robust and evolving market, ripe with opportunities for both established and new players.
Electronic Counter Segmentation
-
1. Application
- 1.1. Packing
- 1.2. Manufacturing/Production
- 1.3. Others
-
2. Types
- 2.1. LCD Display
- 2.2. LED Display
- 2.3. Digital Display
- 2.4. Analogue Display
Electronic Counter Segmentation By Geography
-
1. North America
- 1.1. United States
- 1.2. Canada
- 1.3. Mexico
-
2. South America
- 2.1. Brazil
- 2.2. Argentina
- 2.3. Rest of South America
-
3. Europe
- 3.1. United Kingdom
- 3.2. Germany
- 3.3. France
- 3.4. Italy
- 3.5. Spain
- 3.6. Russia
- 3.7. Benelux
- 3.8. Nordics
- 3.9. Rest of Europe
-
4. Middle East & Africa
- 4.1. Turkey
- 4.2. Israel
- 4.3. GCC
- 4.4. North Africa
- 4.5. South Africa
- 4.6. Rest of Middle East & Africa
-
5. Asia Pacific
- 5.1. China
- 5.2. India
- 5.3. Japan
- 5.4. South Korea
- 5.5. ASEAN
- 5.6. Oceania
- 5.7. Rest of Asia Pacific
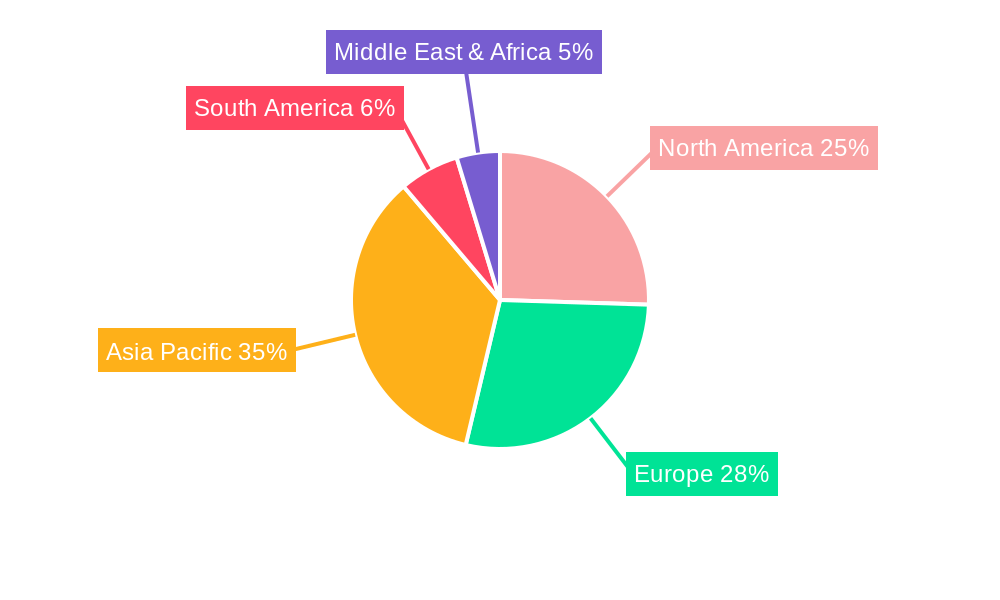
Electronic Counter Regional Market Share
Geographic Coverage of Electronic Counter
Electronic Counter REPORT HIGHLIGHTS
| Aspects | Details |
|---|---|
| Study Period | 2020-2034 |
| Base Year | 2025 |
| Estimated Year | 2026 |
| Forecast Period | 2026-2034 |
| Historical Period | 2020-2025 |
| Growth Rate | CAGR of 2.3% from 2020-2034 |
| Segmentation |
|
Table of Contents
- 1. Introduction
- 1.1. Research Scope
- 1.2. Market Segmentation
- 1.3. Research Objective
- 1.4. Definitions and Assumptions
- 2. Executive Summary
- 2.1. Market Snapshot
- 3. Market Dynamics
- 3.1. Market Drivers
- 3.2. Market Restrains
- 3.3. Market Trends
- 3.4. Market Opportunities
- 4. Market Factor Analysis
- 4.1. Porters Five Forces
- 4.1.1. Bargaining Power of Suppliers
- 4.1.2. Bargaining Power of Buyers
- 4.1.3. Threat of New Entrants
- 4.1.4. Threat of Substitutes
- 4.1.5. Competitive Rivalry
- 4.2. PESTEL analysis
- 4.3. BCG Analysis
- 4.3.1. Stars (High Growth, High Market Share)
- 4.3.2. Cash Cows (Low Growth, High Market Share)
- 4.3.3. Question Mark (High Growth, Low Market Share)
- 4.3.4. Dogs (Low Growth, Low Market Share)
- 4.4. Ansoff Matrix Analysis
- 4.5. Supply Chain Analysis
- 4.6. Regulatory Landscape
- 4.7. Current Market Potential and Opportunity Assessment (TAM–SAM–SOM Framework)
- 4.8. VDR Analyst Note
- 4.1. Porters Five Forces
- 5. Market Analysis, Insights and Forecast 2021-2033
- 5.1. Market Analysis, Insights and Forecast - by Application
- 5.1.1. Packing
- 5.1.2. Manufacturing/Production
- 5.1.3. Others
- 5.2. Market Analysis, Insights and Forecast - by Types
- 5.2.1. LCD Display
- 5.2.2. LED Display
- 5.2.3. Digital Display
- 5.2.4. Analogue Display
- 5.3. Market Analysis, Insights and Forecast - by Region
- 5.3.1. North America
- 5.3.2. South America
- 5.3.3. Europe
- 5.3.4. Middle East & Africa
- 5.3.5. Asia Pacific
- 5.1. Market Analysis, Insights and Forecast - by Application
- 6. Global Electronic Counter Analysis, Insights and Forecast, 2021-2033
- 6.1. Market Analysis, Insights and Forecast - by Application
- 6.1.1. Packing
- 6.1.2. Manufacturing/Production
- 6.1.3. Others
- 6.2. Market Analysis, Insights and Forecast - by Types
- 6.2.1. LCD Display
- 6.2.2. LED Display
- 6.2.3. Digital Display
- 6.2.4. Analogue Display
- 6.1. Market Analysis, Insights and Forecast - by Application
- 7. North America Electronic Counter Analysis, Insights and Forecast, 2021-2033
- 7.1. Market Analysis, Insights and Forecast - by Application
- 7.1.1. Packing
- 7.1.2. Manufacturing/Production
- 7.1.3. Others
- 7.2. Market Analysis, Insights and Forecast - by Types
- 7.2.1. LCD Display
- 7.2.2. LED Display
- 7.2.3. Digital Display
- 7.2.4. Analogue Display
- 7.1. Market Analysis, Insights and Forecast - by Application
- 8. South America Electronic Counter Analysis, Insights and Forecast, 2021-2033
- 8.1. Market Analysis, Insights and Forecast - by Application
- 8.1.1. Packing
- 8.1.2. Manufacturing/Production
- 8.1.3. Others
- 8.2. Market Analysis, Insights and Forecast - by Types
- 8.2.1. LCD Display
- 8.2.2. LED Display
- 8.2.3. Digital Display
- 8.2.4. Analogue Display
- 8.1. Market Analysis, Insights and Forecast - by Application
- 9. Europe Electronic Counter Analysis, Insights and Forecast, 2021-2033
- 9.1. Market Analysis, Insights and Forecast - by Application
- 9.1.1. Packing
- 9.1.2. Manufacturing/Production
- 9.1.3. Others
- 9.2. Market Analysis, Insights and Forecast - by Types
- 9.2.1. LCD Display
- 9.2.2. LED Display
- 9.2.3. Digital Display
- 9.2.4. Analogue Display
- 9.1. Market Analysis, Insights and Forecast - by Application
- 10. Middle East & Africa Electronic Counter Analysis, Insights and Forecast, 2021-2033
- 10.1. Market Analysis, Insights and Forecast - by Application
- 10.1.1. Packing
- 10.1.2. Manufacturing/Production
- 10.1.3. Others
- 10.2. Market Analysis, Insights and Forecast - by Types
- 10.2.1. LCD Display
- 10.2.2. LED Display
- 10.2.3. Digital Display
- 10.2.4. Analogue Display
- 10.1. Market Analysis, Insights and Forecast - by Application
- 11. Asia Pacific Electronic Counter Analysis, Insights and Forecast, 2021-2033
- 11.1. Market Analysis, Insights and Forecast - by Application
- 11.1.1. Packing
- 11.1.2. Manufacturing/Production
- 11.1.3. Others
- 11.2. Market Analysis, Insights and Forecast - by Types
- 11.2.1. LCD Display
- 11.2.2. LED Display
- 11.2.3. Digital Display
- 11.2.4. Analogue Display
- 11.1. Market Analysis, Insights and Forecast - by Application
- 12. Competitive Analysis
- 12.1. Company Profiles
- 12.1.1 Danaher
- 12.1.1.1. Company Overview
- 12.1.1.2. Products
- 12.1.1.3. Company Financials
- 12.1.1.4. SWOT Analysis
- 12.1.2 Eaton
- 12.1.2.1. Company Overview
- 12.1.2.2. Products
- 12.1.2.3. Company Financials
- 12.1.2.4. SWOT Analysis
- 12.1.3 Crouzet
- 12.1.3.1. Company Overview
- 12.1.3.2. Products
- 12.1.3.3. Company Financials
- 12.1.3.4. SWOT Analysis
- 12.1.4 Red Lion Controls
- 12.1.4.1. Company Overview
- 12.1.4.2. Products
- 12.1.4.3. Company Financials
- 12.1.4.4. SWOT Analysis
- 12.1.5 Kubler
- 12.1.5.1. Company Overview
- 12.1.5.2. Products
- 12.1.5.3. Company Financials
- 12.1.5.4. SWOT Analysis
- 12.1.6 Trumeter Technologies
- 12.1.6.1. Company Overview
- 12.1.6.2. Products
- 12.1.6.3. Company Financials
- 12.1.6.4. SWOT Analysis
- 12.1.7 KOYO Electronics Industries
- 12.1.7.1. Company Overview
- 12.1.7.2. Products
- 12.1.7.3. Company Financials
- 12.1.7.4. SWOT Analysis
- 12.1.8 HOKUYO
- 12.1.8.1. Company Overview
- 12.1.8.2. Products
- 12.1.8.3. Company Financials
- 12.1.8.4. SWOT Analysis
- 12.1.9 Line Seiki
- 12.1.9.1. Company Overview
- 12.1.9.2. Products
- 12.1.9.3. Company Financials
- 12.1.9.4. SWOT Analysis
- 12.1.10 Shanghai Fengxian Zhelin electric instrument
- 12.1.10.1. Company Overview
- 12.1.10.2. Products
- 12.1.10.3. Company Financials
- 12.1.10.4. SWOT Analysis
- 12.1.11 Simex
- 12.1.11.1. Company Overview
- 12.1.11.2. Products
- 12.1.11.3. Company Financials
- 12.1.11.4. SWOT Analysis
- 12.1.12 Laurel Electronics
- 12.1.12.1. Company Overview
- 12.1.12.2. Products
- 12.1.12.3. Company Financials
- 12.1.12.4. SWOT Analysis
- 12.1.13 ZONHO
- 12.1.13.1. Company Overview
- 12.1.13.2. Products
- 12.1.13.3. Company Financials
- 12.1.13.4. SWOT Analysis
- 12.1.1 Danaher
- 12.2. Market Entropy
- 12.2.1 Company's Key Areas Served
- 12.2.2 Recent Developments
- 12.3. Company Market Share Analysis 2025
- 12.3.1 Top 5 Companies Market Share Analysis
- 12.3.2 Top 3 Companies Market Share Analysis
- 12.4. List of Potential Customers
- 13. Research Methodology
List of Figures
- Figure 1: Global Electronic Counter Revenue Breakdown (million, %) by Region 2025 & 2033
- Figure 2: North America Electronic Counter Revenue (million), by Application 2025 & 2033
- Figure 3: North America Electronic Counter Revenue Share (%), by Application 2025 & 2033
- Figure 4: North America Electronic Counter Revenue (million), by Types 2025 & 2033
- Figure 5: North America Electronic Counter Revenue Share (%), by Types 2025 & 2033
- Figure 6: North America Electronic Counter Revenue (million), by Country 2025 & 2033
- Figure 7: North America Electronic Counter Revenue Share (%), by Country 2025 & 2033
- Figure 8: South America Electronic Counter Revenue (million), by Application 2025 & 2033
- Figure 9: South America Electronic Counter Revenue Share (%), by Application 2025 & 2033
- Figure 10: South America Electronic Counter Revenue (million), by Types 2025 & 2033
- Figure 11: South America Electronic Counter Revenue Share (%), by Types 2025 & 2033
- Figure 12: South America Electronic Counter Revenue (million), by Country 2025 & 2033
- Figure 13: South America Electronic Counter Revenue Share (%), by Country 2025 & 2033
- Figure 14: Europe Electronic Counter Revenue (million), by Application 2025 & 2033
- Figure 15: Europe Electronic Counter Revenue Share (%), by Application 2025 & 2033
- Figure 16: Europe Electronic Counter Revenue (million), by Types 2025 & 2033
- Figure 17: Europe Electronic Counter Revenue Share (%), by Types 2025 & 2033
- Figure 18: Europe Electronic Counter Revenue (million), by Country 2025 & 2033
- Figure 19: Europe Electronic Counter Revenue Share (%), by Country 2025 & 2033
- Figure 20: Middle East & Africa Electronic Counter Revenue (million), by Application 2025 & 2033
- Figure 21: Middle East & Africa Electronic Counter Revenue Share (%), by Application 2025 & 2033
- Figure 22: Middle East & Africa Electronic Counter Revenue (million), by Types 2025 & 2033
- Figure 23: Middle East & Africa Electronic Counter Revenue Share (%), by Types 2025 & 2033
- Figure 24: Middle East & Africa Electronic Counter Revenue (million), by Country 2025 & 2033
- Figure 25: Middle East & Africa Electronic Counter Revenue Share (%), by Country 2025 & 2033
- Figure 26: Asia Pacific Electronic Counter Revenue (million), by Application 2025 & 2033
- Figure 27: Asia Pacific Electronic Counter Revenue Share (%), by Application 2025 & 2033
- Figure 28: Asia Pacific Electronic Counter Revenue (million), by Types 2025 & 2033
- Figure 29: Asia Pacific Electronic Counter Revenue Share (%), by Types 2025 & 2033
- Figure 30: Asia Pacific Electronic Counter Revenue (million), by Country 2025 & 2033
- Figure 31: Asia Pacific Electronic Counter Revenue Share (%), by Country 2025 & 2033
List of Tables
- Table 1: Global Electronic Counter Revenue million Forecast, by Application 2020 & 2033
- Table 2: Global Electronic Counter Revenue million Forecast, by Types 2020 & 2033
- Table 3: Global Electronic Counter Revenue million Forecast, by Region 2020 & 2033
- Table 4: Global Electronic Counter Revenue million Forecast, by Application 2020 & 2033
- Table 5: Global Electronic Counter Revenue million Forecast, by Types 2020 & 2033
- Table 6: Global Electronic Counter Revenue million Forecast, by Country 2020 & 2033
- Table 7: United States Electronic Counter Revenue (million) Forecast, by Application 2020 & 2033
- Table 8: Canada Electronic Counter Revenue (million) Forecast, by Application 2020 & 2033
- Table 9: Mexico Electronic Counter Revenue (million) Forecast, by Application 2020 & 2033
- Table 10: Global Electronic Counter Revenue million Forecast, by Application 2020 & 2033
- Table 11: Global Electronic Counter Revenue million Forecast, by Types 2020 & 2033
- Table 12: Global Electronic Counter Revenue million Forecast, by Country 2020 & 2033
- Table 13: Brazil Electronic Counter Revenue (million) Forecast, by Application 2020 & 2033
- Table 14: Argentina Electronic Counter Revenue (million) Forecast, by Application 2020 & 2033
- Table 15: Rest of South America Electronic Counter Revenue (million) Forecast, by Application 2020 & 2033
- Table 16: Global Electronic Counter Revenue million Forecast, by Application 2020 & 2033
- Table 17: Global Electronic Counter Revenue million Forecast, by Types 2020 & 2033
- Table 18: Global Electronic Counter Revenue million Forecast, by Country 2020 & 2033
- Table 19: United Kingdom Electronic Counter Revenue (million) Forecast, by Application 2020 & 2033
- Table 20: Germany Electronic Counter Revenue (million) Forecast, by Application 2020 & 2033
- Table 21: France Electronic Counter Revenue (million) Forecast, by Application 2020 & 2033
- Table 22: Italy Electronic Counter Revenue (million) Forecast, by Application 2020 & 2033
- Table 23: Spain Electronic Counter Revenue (million) Forecast, by Application 2020 & 2033
- Table 24: Russia Electronic Counter Revenue (million) Forecast, by Application 2020 & 2033
- Table 25: Benelux Electronic Counter Revenue (million) Forecast, by Application 2020 & 2033
- Table 26: Nordics Electronic Counter Revenue (million) Forecast, by Application 2020 & 2033
- Table 27: Rest of Europe Electronic Counter Revenue (million) Forecast, by Application 2020 & 2033
- Table 28: Global Electronic Counter Revenue million Forecast, by Application 2020 & 2033
- Table 29: Global Electronic Counter Revenue million Forecast, by Types 2020 & 2033
- Table 30: Global Electronic Counter Revenue million Forecast, by Country 2020 & 2033
- Table 31: Turkey Electronic Counter Revenue (million) Forecast, by Application 2020 & 2033
- Table 32: Israel Electronic Counter Revenue (million) Forecast, by Application 2020 & 2033
- Table 33: GCC Electronic Counter Revenue (million) Forecast, by Application 2020 & 2033
- Table 34: North Africa Electronic Counter Revenue (million) Forecast, by Application 2020 & 2033
- Table 35: South Africa Electronic Counter Revenue (million) Forecast, by Application 2020 & 2033
- Table 36: Rest of Middle East & Africa Electronic Counter Revenue (million) Forecast, by Application 2020 & 2033
- Table 37: Global Electronic Counter Revenue million Forecast, by Application 2020 & 2033
- Table 38: Global Electronic Counter Revenue million Forecast, by Types 2020 & 2033
- Table 39: Global Electronic Counter Revenue million Forecast, by Country 2020 & 2033
- Table 40: China Electronic Counter Revenue (million) Forecast, by Application 2020 & 2033
- Table 41: India Electronic Counter Revenue (million) Forecast, by Application 2020 & 2033
- Table 42: Japan Electronic Counter Revenue (million) Forecast, by Application 2020 & 2033
- Table 43: South Korea Electronic Counter Revenue (million) Forecast, by Application 2020 & 2033
- Table 44: ASEAN Electronic Counter Revenue (million) Forecast, by Application 2020 & 2033
- Table 45: Oceania Electronic Counter Revenue (million) Forecast, by Application 2020 & 2033
- Table 46: Rest of Asia Pacific Electronic Counter Revenue (million) Forecast, by Application 2020 & 2033
Frequently Asked Questions
1. What is the projected Compound Annual Growth Rate (CAGR) of the Electronic Counter?
The projected CAGR is approximately 2.3%.
2. Which companies are prominent players in the Electronic Counter?
Key companies in the market include Danaher, Eaton, Crouzet, Red Lion Controls, Kubler, Trumeter Technologies, KOYO Electronics Industries, HOKUYO, Line Seiki, Shanghai Fengxian Zhelin electric instrument, Simex, Laurel Electronics, ZONHO.
3. What are the main segments of the Electronic Counter?
The market segments include Application, Types.
4. Can you provide details about the market size?
The market size is estimated to be USD 346.4 million as of 2022.
5. What are some drivers contributing to market growth?
N/A
6. What are the notable trends driving market growth?
N/A
7. Are there any restraints impacting market growth?
N/A
8. Can you provide examples of recent developments in the market?
N/A
9. What pricing options are available for accessing the report?
Pricing options include single-user, multi-user, and enterprise licenses priced at USD 5900.00, USD 8850.00, and USD 11800.00 respectively.
10. Is the market size provided in terms of value or volume?
The market size is provided in terms of value, measured in million.
11. Are there any specific market keywords associated with the report?
Yes, the market keyword associated with the report is "Electronic Counter," which aids in identifying and referencing the specific market segment covered.
12. How do I determine which pricing option suits my needs best?
The pricing options vary based on user requirements and access needs. Individual users may opt for single-user licenses, while businesses requiring broader access may choose multi-user or enterprise licenses for cost-effective access to the report.
13. Are there any additional resources or data provided in the Electronic Counter report?
While the report offers comprehensive insights, it's advisable to review the specific contents or supplementary materials provided to ascertain if additional resources or data are available.
14. How can I stay updated on further developments or reports in the Electronic Counter?
To stay informed about further developments, trends, and reports in the Electronic Counter, consider subscribing to industry newsletters, following relevant companies and organizations, or regularly checking reputable industry news sources and publications.
Methodology
Step 1 - Identification of Relevant Samples Size from Population Database


Step 2 - Approaches for Defining Global Market Size (Value, Volume* & Price*)

Note*: In applicable scenarios
Step 3 - Data Sources
Primary Research
- Web Analytics
- Survey Reports
- Research Institute
- Latest Research Reports
- Opinion Leaders
Secondary Research
- Annual Reports
- White Paper
- Latest Press Release
- Industry Association
- Paid Database
- Investor Presentations

Step 4 - Data Triangulation
Involves using different sources of information in order to increase the validity of a study
These sources are likely to be stakeholders in a program - participants, other researchers, program staff, other community members, and so on.
Then we put all data in single framework & apply various statistical tools to find out the dynamic on the market.
During the analysis stage, feedback from the stakeholder groups would be compared to determine areas of agreement as well as areas of divergence