
Key Insights
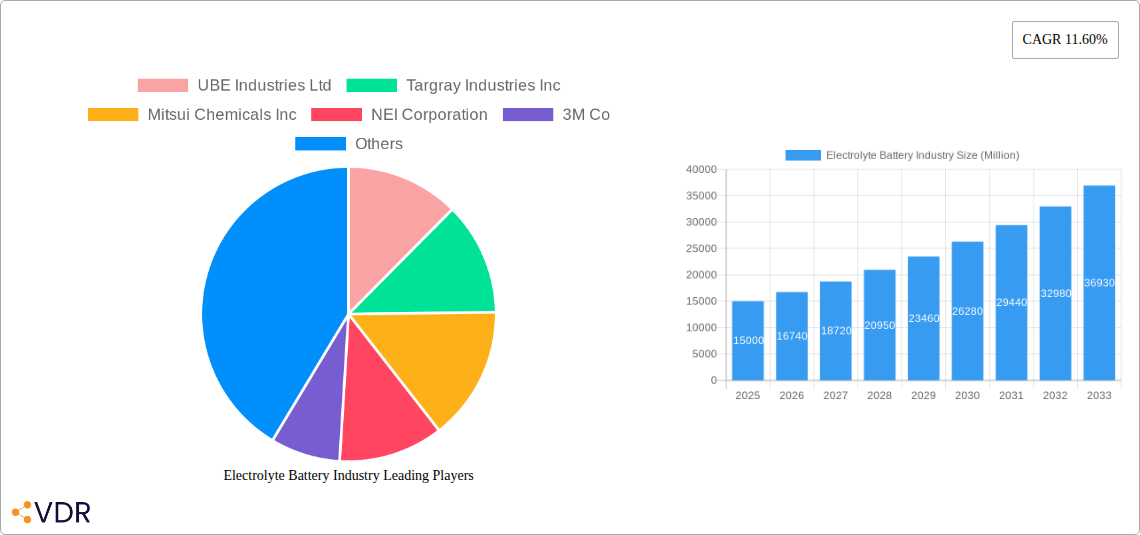
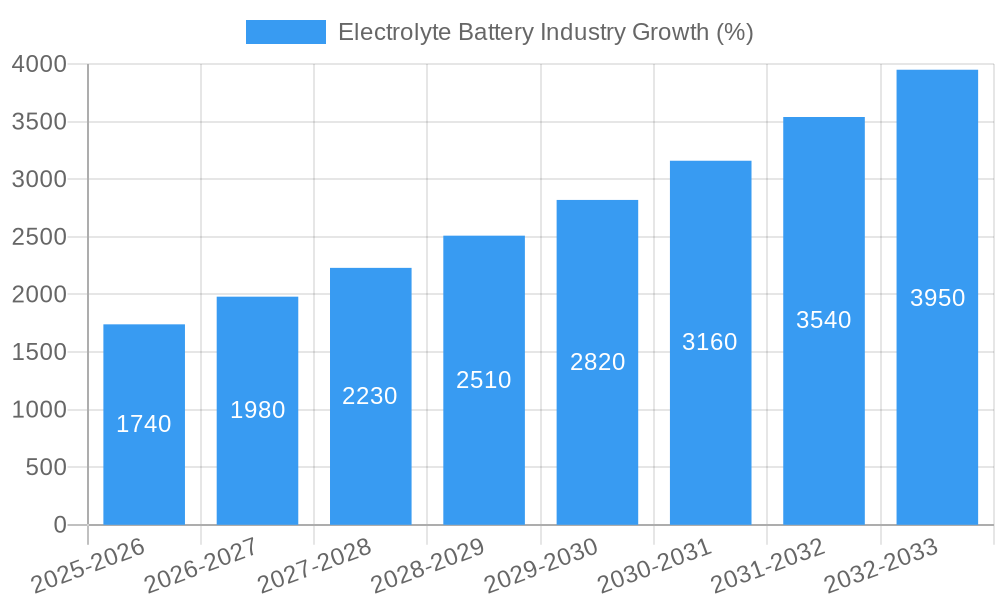
The global electrolyte battery market is experiencing robust growth, projected to reach a substantial size by 2033, driven by the increasing demand for energy storage solutions and electric vehicles (EVs). A Compound Annual Growth Rate (CAGR) of 11.60% from 2025 to 2033 indicates a significant expansion trajectory. This growth is fueled by several key factors. The rising adoption of renewable energy sources necessitates efficient energy storage, boosting demand for electrolyte batteries. Simultaneously, the global shift towards electric mobility is driving substantial demand within the EV sector. Technological advancements in battery chemistries, such as lithium-ion and flow batteries, are also contributing to the market's expansion, improving energy density, lifespan, and safety. Furthermore, government initiatives promoting sustainable energy and electric vehicles across various regions, particularly in North America, Europe, and Asia-Pacific, are creating a favorable regulatory environment. While challenges remain, such as the cost of raw materials and the need for improved battery recycling infrastructure, the overall market outlook remains positive, with considerable opportunities for growth across various battery types and end-user applications.
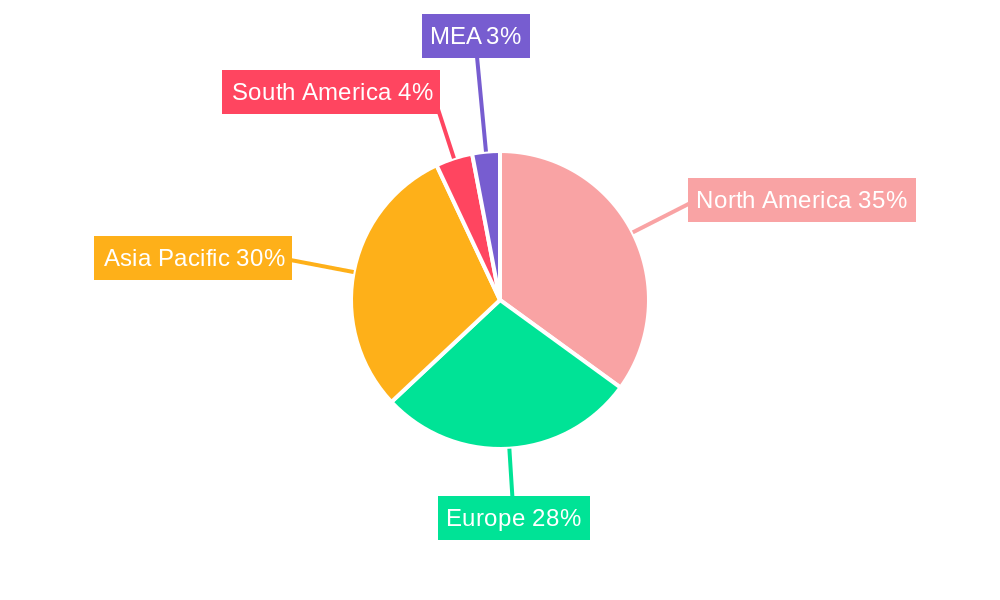
The market segmentation reveals significant growth potential in lithium-ion batteries due to their high energy density, prevalent in consumer electronics and EVs. However, lead-acid batteries maintain a sizeable share, particularly in applications where cost is a primary factor. The emergence of flow batteries is noteworthy, offering advantages in large-scale energy storage, although presently representing a smaller market segment. Regional analysis suggests that North America and Asia-Pacific will be dominant regions, influenced by robust EV adoption and substantial investments in renewable energy infrastructure. Europe also presents significant growth potential, driven by stricter emission regulations and the growing focus on sustainable energy. Companies like UBE Industries Ltd, Targray Industries Inc, and others are actively shaping this market through innovations and expansions, contributing to ongoing market evolution and competition.
Electrolyte Battery Industry Market Report: 2019-2033
This comprehensive report provides an in-depth analysis of the electrolyte battery industry, encompassing market dynamics, growth trends, regional landscapes, product innovations, and key players. The study period spans 2019-2033, with 2025 serving as the base and estimated year. This report is crucial for industry professionals, investors, and strategists seeking to navigate this rapidly evolving market. We delve into the parent market of energy storage solutions and the child market segments of various battery types and electrolyte chemistries. The report projects xx Million units in total market value by 2033.
Electrolyte Battery Industry Market Dynamics & Structure
This section analyzes the competitive landscape of the electrolyte battery market, evaluating market concentration, technological advancements, regulatory influences, and market trends. The analysis encompasses various aspects including:
- Market Concentration: The market exhibits a moderately concentrated structure with a few dominant players commanding significant market share, while several smaller companies cater to niche segments. The top 5 players account for approximately xx% of the global market.
- Technological Innovation: Continuous innovation in battery chemistries (Lithium-ion, Flow, Lead-Acid etc.), electrolyte formulations, and manufacturing processes drives market growth. The focus remains on enhancing energy density, lifespan, safety, and cost-effectiveness.
- Regulatory Frameworks: Government regulations and policies concerning environmental protection, safety standards, and renewable energy initiatives significantly impact market dynamics. Subsidies and tax incentives play a significant role in market expansion, particularly for electric vehicle (EV) batteries.
- Competitive Product Substitutes: Competition comes from alternative energy storage solutions, including fuel cells and supercapacitors, though the dominance of electrolyte batteries in many applications remains largely unchallenged.
- End-User Demographics: The market's growth is fueled by increasing demand from electric vehicles, energy storage systems (ESS), consumer electronics, and other specialized applications.
- M&A Trends: The electrolyte battery industry witnesses continuous mergers and acquisitions (M&A) activity. The volume of deals in the past five years reached approximately xx deals, primarily driven by the desire to secure raw materials supply, expand technological capabilities, and enhance market presence. Strategic partnerships are also common for technology licensing and market access.
Electrolyte Battery Industry Growth Trends & Insights
Leveraging extensive market research data, this report meticulously analyzes market size evolution, adoption rates across various end-user segments, and the impact of technological disruptions on market trajectory. The analysis incorporates:
- Market Size Evolution: The global electrolyte battery market experienced significant growth during the historical period (2019-2024), expanding from xx Million units in 2019 to xx Million units in 2024. This positive trend is expected to continue during the forecast period (2025-2033).
- Adoption Rates: The increasing adoption of electric vehicles and stationary energy storage systems is a key driver of market growth. The report details sector-specific adoption rates with insights into consumer behavior shifts and purchasing patterns.
- Technological Disruptions: Advancements in battery chemistries, such as solid-state batteries and improved lithium-ion technologies, are anticipated to reshape the market landscape. The analysis assesses the impact of these advancements and their potential to disrupt existing market dynamics.
- Consumer Behavior Shifts: The growing awareness of environmental concerns and the increasing preference for sustainable energy solutions drive the demand for electrolyte batteries. This report analyzes shifting consumer preferences and their influence on market growth.
- CAGR: The market is projected to exhibit a compound annual growth rate (CAGR) of xx% during the forecast period (2025-2033).
- Market Penetration: The report analyzes market penetration rates in various geographical regions and end-user segments, providing valuable insights into market saturation and future growth potential.
Dominant Regions, Countries, or Segments in Electrolyte Battery Industry
This section identifies leading regions, countries, and market segments within the electrolyte battery industry, focusing on factors driving their dominance.
- Leading Regions: Asia-Pacific (particularly China) currently holds a dominant position in the global electrolyte battery market, driven by robust manufacturing capabilities and high demand for electric vehicles and consumer electronics. North America and Europe follow closely with significant growth potential.
- Leading Countries: China's dominance in manufacturing and market size is noteworthy. Other key players include the US, Japan, South Korea and Germany.
- Leading Segments: The Lithium-ion battery segment dominates the market, due to its high energy density and versatility. However, the Flow battery segment is showing rapid growth in energy storage applications.
- Key Drivers:
- Government support: Supportive government policies, including subsidies and tax incentives, accelerate the adoption of electric vehicles and energy storage systems.
- Infrastructure development: The expansion of charging infrastructure for electric vehicles facilitates wider adoption of lithium-ion batteries.
- Technological advancements: Advancements in battery technology enhance energy density, lifespan, and safety, leading to increased adoption across various applications.
Electrolyte Battery Industry Product Landscape
The electrolyte battery market offers a diverse range of products, varying in battery type (Lead-Acid, Lithium-ion, Flow Battery, Zinc Bromide, and others), electrolyte type (Gel, Liquid, etc.), and applications. Innovative products focus on enhanced energy density, improved safety features, longer lifespans, and reduced costs. Key features driving market acceptance include improved thermal management, higher cycle life, and faster charging capabilities. Technological advancements are continually improving performance metrics across various applications.
Key Drivers, Barriers & Challenges in Electrolyte Battery Industry
Key Drivers:
The market's expansion is driven by factors like the growing demand for electric vehicles, increasing investment in renewable energy storage, advancements in battery technology resulting in higher energy density and improved performance, and supportive government policies encouraging the adoption of sustainable energy solutions.
Key Challenges & Restraints:
Challenges include supply chain disruptions affecting raw material availability, price volatility of raw materials (e.g., lithium), stringent safety regulations and environmental concerns regarding battery disposal and recycling, and intense competition among manufacturers impacting pricing and profitability. The high initial investment required for battery manufacturing also poses a barrier to market entry for smaller companies.
Emerging Opportunities in Electrolyte Battery Industry
Emerging opportunities arise from untapped markets in developing economies, the increasing integration of electrolyte batteries into smart grids and microgrids, the growing demand for advanced energy storage solutions in the industrial sector (e.g., grid-scale energy storage), and the development of new battery chemistries with higher energy densities and improved performance. Advancements in solid-state batteries and other next-generation battery technologies represent significant growth potential.
Growth Accelerators in the Electrolyte Battery Industry
Technological advancements, particularly in high-energy-density battery chemistries, are key growth catalysts. Strategic partnerships between battery manufacturers, material suppliers, and automotive companies facilitate market expansion. Government initiatives promoting renewable energy and electric vehicle adoption further accelerate growth. Expansion into new markets, including developing economies with rapidly growing energy demands, also represents substantial growth potential.
Key Players Shaping the Electrolyte Battery Industry Market
- UBE Industries Ltd
- Targray Industries Inc
- Mitsui Chemicals Inc
- NEI Corporation
- 3M Co
- Guangzhou Tinci Materials Technology Co Ltd
- Mitsubishi Chemical Holdings Corporation
- Shenzhen Capchem Technology Co Ltd
Notable Milestones in Electrolyte Battery Industry Sector
- February 2022: US Vanadium announced an expanded purchase agreement with Enerox for up to 3 million additional liters/year of ultra-high-purity electrolyte.
- January 2022: Nexeon Limited licensed its NSP-1 technology to SKC Co. Ltd. for next-generation lithium-ion batteries.
In-Depth Electrolyte Battery Industry Market Outlook
The future of the electrolyte battery industry looks promising, driven by sustained growth in the electric vehicle and energy storage markets. Technological advancements will continue to improve battery performance and reduce costs, opening up new applications and expanding market reach. Strategic partnerships and investments in research and development will further drive innovation and accelerate market expansion, leading to significant growth opportunities for industry players over the next decade.
Electrolyte Battery Industry Segmentation
-
1. Battery Type and Electrolyte Type
-
1.1. Lead Acid
- 1.1.1. Liquid Electrolyte
- 1.1.2. Gel Electrolyte
-
1.2. Lithium-ion
- 1.2.1. Solid Electrolyte
-
1.3. Flow Battery
- 1.3.1. Vanadium
- 1.3.2. Zinc Bromide
- 1.4. Other Battery Types and Electrolyte Types
- 1.5. Liquid Electrolyte
-
1.1. Lead Acid
-
2. End User
- 2.1. Electric Vehicle
- 2.2. Energy Storage
- 2.3. Consumer Electronics
- 2.4. Other End Users
Electrolyte Battery Industry Segmentation By Geography
- 1. North America
- 2. Europe
- 3. Asia Pacific
- 4. South America
- 5. Middle East and Africa
Electrolyte Battery Industry REPORT HIGHLIGHTS
| Aspects | Details |
|---|---|
| Study Period | 2019-2033 |
| Base Year | 2024 |
| Estimated Year | 2025 |
| Forecast Period | 2025-2033 |
| Historical Period | 2019-2024 |
| Growth Rate | CAGR of 11.60% from 2019-2033 |
| Segmentation |
|
Table of Contents
- 1. Introduction
- 1.1. Research Scope
- 1.2. Market Segmentation
- 1.3. Research Methodology
- 1.4. Definitions and Assumptions
- 2. Executive Summary
- 2.1. Introduction
- 3. Market Dynamics
- 3.1. Introduction
- 3.2. Market Drivers
- 3.2.1. Increasing Energy Demand.; Increasing Export Opportunities
- 3.3. Market Restrains
- 3.3.1. Volatility in Energy Prices
- 3.4. Market Trends
- 3.4.1. Lithium-ion Battery Expected to Dominate the Market
- 4. Market Factor Analysis
- 4.1. Porters Five Forces
- 4.2. Supply/Value Chain
- 4.3. PESTEL analysis
- 4.4. Market Entropy
- 4.5. Patent/Trademark Analysis
- 5. Global Electrolyte Battery Industry Analysis, Insights and Forecast, 2019-2031
- 5.1. Market Analysis, Insights and Forecast - by Battery Type and Electrolyte Type
- 5.1.1. Lead Acid
- 5.1.1.1. Liquid Electrolyte
- 5.1.1.2. Gel Electrolyte
- 5.1.2. Lithium-ion
- 5.1.2.1. Solid Electrolyte
- 5.1.3. Flow Battery
- 5.1.3.1. Vanadium
- 5.1.3.2. Zinc Bromide
- 5.1.4. Other Battery Types and Electrolyte Types
- 5.1.5. Liquid Electrolyte
- 5.1.1. Lead Acid
- 5.2. Market Analysis, Insights and Forecast - by End User
- 5.2.1. Electric Vehicle
- 5.2.2. Energy Storage
- 5.2.3. Consumer Electronics
- 5.2.4. Other End Users
- 5.3. Market Analysis, Insights and Forecast - by Region
- 5.3.1. North America
- 5.3.2. Europe
- 5.3.3. Asia Pacific
- 5.3.4. South America
- 5.3.5. Middle East and Africa
- 5.1. Market Analysis, Insights and Forecast - by Battery Type and Electrolyte Type
- 6. North America Electrolyte Battery Industry Analysis, Insights and Forecast, 2019-2031
- 6.1. Market Analysis, Insights and Forecast - by Battery Type and Electrolyte Type
- 6.1.1. Lead Acid
- 6.1.1.1. Liquid Electrolyte
- 6.1.1.2. Gel Electrolyte
- 6.1.2. Lithium-ion
- 6.1.2.1. Solid Electrolyte
- 6.1.3. Flow Battery
- 6.1.3.1. Vanadium
- 6.1.3.2. Zinc Bromide
- 6.1.4. Other Battery Types and Electrolyte Types
- 6.1.5. Liquid Electrolyte
- 6.1.1. Lead Acid
- 6.2. Market Analysis, Insights and Forecast - by End User
- 6.2.1. Electric Vehicle
- 6.2.2. Energy Storage
- 6.2.3. Consumer Electronics
- 6.2.4. Other End Users
- 6.1. Market Analysis, Insights and Forecast - by Battery Type and Electrolyte Type
- 7. Europe Electrolyte Battery Industry Analysis, Insights and Forecast, 2019-2031
- 7.1. Market Analysis, Insights and Forecast - by Battery Type and Electrolyte Type
- 7.1.1. Lead Acid
- 7.1.1.1. Liquid Electrolyte
- 7.1.1.2. Gel Electrolyte
- 7.1.2. Lithium-ion
- 7.1.2.1. Solid Electrolyte
- 7.1.3. Flow Battery
- 7.1.3.1. Vanadium
- 7.1.3.2. Zinc Bromide
- 7.1.4. Other Battery Types and Electrolyte Types
- 7.1.5. Liquid Electrolyte
- 7.1.1. Lead Acid
- 7.2. Market Analysis, Insights and Forecast - by End User
- 7.2.1. Electric Vehicle
- 7.2.2. Energy Storage
- 7.2.3. Consumer Electronics
- 7.2.4. Other End Users
- 7.1. Market Analysis, Insights and Forecast - by Battery Type and Electrolyte Type
- 8. Asia Pacific Electrolyte Battery Industry Analysis, Insights and Forecast, 2019-2031
- 8.1. Market Analysis, Insights and Forecast - by Battery Type and Electrolyte Type
- 8.1.1. Lead Acid
- 8.1.1.1. Liquid Electrolyte
- 8.1.1.2. Gel Electrolyte
- 8.1.2. Lithium-ion
- 8.1.2.1. Solid Electrolyte
- 8.1.3. Flow Battery
- 8.1.3.1. Vanadium
- 8.1.3.2. Zinc Bromide
- 8.1.4. Other Battery Types and Electrolyte Types
- 8.1.5. Liquid Electrolyte
- 8.1.1. Lead Acid
- 8.2. Market Analysis, Insights and Forecast - by End User
- 8.2.1. Electric Vehicle
- 8.2.2. Energy Storage
- 8.2.3. Consumer Electronics
- 8.2.4. Other End Users
- 8.1. Market Analysis, Insights and Forecast - by Battery Type and Electrolyte Type
- 9. South America Electrolyte Battery Industry Analysis, Insights and Forecast, 2019-2031
- 9.1. Market Analysis, Insights and Forecast - by Battery Type and Electrolyte Type
- 9.1.1. Lead Acid
- 9.1.1.1. Liquid Electrolyte
- 9.1.1.2. Gel Electrolyte
- 9.1.2. Lithium-ion
- 9.1.2.1. Solid Electrolyte
- 9.1.3. Flow Battery
- 9.1.3.1. Vanadium
- 9.1.3.2. Zinc Bromide
- 9.1.4. Other Battery Types and Electrolyte Types
- 9.1.5. Liquid Electrolyte
- 9.1.1. Lead Acid
- 9.2. Market Analysis, Insights and Forecast - by End User
- 9.2.1. Electric Vehicle
- 9.2.2. Energy Storage
- 9.2.3. Consumer Electronics
- 9.2.4. Other End Users
- 9.1. Market Analysis, Insights and Forecast - by Battery Type and Electrolyte Type
- 10. Middle East and Africa Electrolyte Battery Industry Analysis, Insights and Forecast, 2019-2031
- 10.1. Market Analysis, Insights and Forecast - by Battery Type and Electrolyte Type
- 10.1.1. Lead Acid
- 10.1.1.1. Liquid Electrolyte
- 10.1.1.2. Gel Electrolyte
- 10.1.2. Lithium-ion
- 10.1.2.1. Solid Electrolyte
- 10.1.3. Flow Battery
- 10.1.3.1. Vanadium
- 10.1.3.2. Zinc Bromide
- 10.1.4. Other Battery Types and Electrolyte Types
- 10.1.5. Liquid Electrolyte
- 10.1.1. Lead Acid
- 10.2. Market Analysis, Insights and Forecast - by End User
- 10.2.1. Electric Vehicle
- 10.2.2. Energy Storage
- 10.2.3. Consumer Electronics
- 10.2.4. Other End Users
- 10.1. Market Analysis, Insights and Forecast - by Battery Type and Electrolyte Type
- 11. North America Electrolyte Battery Industry Analysis, Insights and Forecast, 2019-2031
- 11.1. Market Analysis, Insights and Forecast - By Country/Sub-region
- 11.1.1 United States
- 11.1.2 Canada
- 11.1.3 Mexico
- 12. Europe Electrolyte Battery Industry Analysis, Insights and Forecast, 2019-2031
- 12.1. Market Analysis, Insights and Forecast - By Country/Sub-region
- 12.1.1 Germany
- 12.1.2 United Kingdom
- 12.1.3 France
- 12.1.4 Spain
- 12.1.5 Italy
- 12.1.6 Spain
- 12.1.7 Belgium
- 12.1.8 Netherland
- 12.1.9 Nordics
- 12.1.10 Rest of Europe
- 13. Asia Pacific Electrolyte Battery Industry Analysis, Insights and Forecast, 2019-2031
- 13.1. Market Analysis, Insights and Forecast - By Country/Sub-region
- 13.1.1 China
- 13.1.2 Japan
- 13.1.3 India
- 13.1.4 South Korea
- 13.1.5 Southeast Asia
- 13.1.6 Australia
- 13.1.7 Indonesia
- 13.1.8 Phillipes
- 13.1.9 Singapore
- 13.1.10 Thailandc
- 13.1.11 Rest of Asia Pacific
- 14. South America Electrolyte Battery Industry Analysis, Insights and Forecast, 2019-2031
- 14.1. Market Analysis, Insights and Forecast - By Country/Sub-region
- 14.1.1 Brazil
- 14.1.2 Argentina
- 14.1.3 Peru
- 14.1.4 Chile
- 14.1.5 Colombia
- 14.1.6 Ecuador
- 14.1.7 Venezuela
- 14.1.8 Rest of South America
- 15. North America Electrolyte Battery Industry Analysis, Insights and Forecast, 2019-2031
- 15.1. Market Analysis, Insights and Forecast - By Country/Sub-region
- 15.1.1 United States
- 15.1.2 Canada
- 15.1.3 Mexico
- 16. MEA Electrolyte Battery Industry Analysis, Insights and Forecast, 2019-2031
- 16.1. Market Analysis, Insights and Forecast - By Country/Sub-region
- 16.1.1 United Arab Emirates
- 16.1.2 Saudi Arabia
- 16.1.3 South Africa
- 16.1.4 Rest of Middle East and Africa
- 17. Competitive Analysis
- 17.1. Global Market Share Analysis 2024
- 17.2. Company Profiles
- 17.2.1 UBE Industries Ltd
- 17.2.1.1. Overview
- 17.2.1.2. Products
- 17.2.1.3. SWOT Analysis
- 17.2.1.4. Recent Developments
- 17.2.1.5. Financials (Based on Availability)
- 17.2.2 Targray Industries Inc
- 17.2.2.1. Overview
- 17.2.2.2. Products
- 17.2.2.3. SWOT Analysis
- 17.2.2.4. Recent Developments
- 17.2.2.5. Financials (Based on Availability)
- 17.2.3 Mitsui Chemicals Inc
- 17.2.3.1. Overview
- 17.2.3.2. Products
- 17.2.3.3. SWOT Analysis
- 17.2.3.4. Recent Developments
- 17.2.3.5. Financials (Based on Availability)
- 17.2.4 NEI Corporation
- 17.2.4.1. Overview
- 17.2.4.2. Products
- 17.2.4.3. SWOT Analysis
- 17.2.4.4. Recent Developments
- 17.2.4.5. Financials (Based on Availability)
- 17.2.5 3M Co
- 17.2.5.1. Overview
- 17.2.5.2. Products
- 17.2.5.3. SWOT Analysis
- 17.2.5.4. Recent Developments
- 17.2.5.5. Financials (Based on Availability)
- 17.2.6 Guangzhou Tinci Materials Technology Co Ltd
- 17.2.6.1. Overview
- 17.2.6.2. Products
- 17.2.6.3. SWOT Analysis
- 17.2.6.4. Recent Developments
- 17.2.6.5. Financials (Based on Availability)
- 17.2.7 Mitsubishi Chemical Holdings Corporation
- 17.2.7.1. Overview
- 17.2.7.2. Products
- 17.2.7.3. SWOT Analysis
- 17.2.7.4. Recent Developments
- 17.2.7.5. Financials (Based on Availability)
- 17.2.8 Shenzhen Capchem Technology Co Ltd
- 17.2.8.1. Overview
- 17.2.8.2. Products
- 17.2.8.3. SWOT Analysis
- 17.2.8.4. Recent Developments
- 17.2.8.5. Financials (Based on Availability)
- 17.2.1 UBE Industries Ltd
List of Figures
- Figure 1: Global Electrolyte Battery Industry Revenue Breakdown (Million, %) by Region 2024 & 2032
- Figure 2: North America Electrolyte Battery Industry Revenue (Million), by Country 2024 & 2032
- Figure 3: North America Electrolyte Battery Industry Revenue Share (%), by Country 2024 & 2032
- Figure 4: Europe Electrolyte Battery Industry Revenue (Million), by Country 2024 & 2032
- Figure 5: Europe Electrolyte Battery Industry Revenue Share (%), by Country 2024 & 2032
- Figure 6: Asia Pacific Electrolyte Battery Industry Revenue (Million), by Country 2024 & 2032
- Figure 7: Asia Pacific Electrolyte Battery Industry Revenue Share (%), by Country 2024 & 2032
- Figure 8: South America Electrolyte Battery Industry Revenue (Million), by Country 2024 & 2032
- Figure 9: South America Electrolyte Battery Industry Revenue Share (%), by Country 2024 & 2032
- Figure 10: North America Electrolyte Battery Industry Revenue (Million), by Country 2024 & 2032
- Figure 11: North America Electrolyte Battery Industry Revenue Share (%), by Country 2024 & 2032
- Figure 12: MEA Electrolyte Battery Industry Revenue (Million), by Country 2024 & 2032
- Figure 13: MEA Electrolyte Battery Industry Revenue Share (%), by Country 2024 & 2032
- Figure 14: North America Electrolyte Battery Industry Revenue (Million), by Battery Type and Electrolyte Type 2024 & 2032
- Figure 15: North America Electrolyte Battery Industry Revenue Share (%), by Battery Type and Electrolyte Type 2024 & 2032
- Figure 16: North America Electrolyte Battery Industry Revenue (Million), by End User 2024 & 2032
- Figure 17: North America Electrolyte Battery Industry Revenue Share (%), by End User 2024 & 2032
- Figure 18: North America Electrolyte Battery Industry Revenue (Million), by Country 2024 & 2032
- Figure 19: North America Electrolyte Battery Industry Revenue Share (%), by Country 2024 & 2032
- Figure 20: Europe Electrolyte Battery Industry Revenue (Million), by Battery Type and Electrolyte Type 2024 & 2032
- Figure 21: Europe Electrolyte Battery Industry Revenue Share (%), by Battery Type and Electrolyte Type 2024 & 2032
- Figure 22: Europe Electrolyte Battery Industry Revenue (Million), by End User 2024 & 2032
- Figure 23: Europe Electrolyte Battery Industry Revenue Share (%), by End User 2024 & 2032
- Figure 24: Europe Electrolyte Battery Industry Revenue (Million), by Country 2024 & 2032
- Figure 25: Europe Electrolyte Battery Industry Revenue Share (%), by Country 2024 & 2032
- Figure 26: Asia Pacific Electrolyte Battery Industry Revenue (Million), by Battery Type and Electrolyte Type 2024 & 2032
- Figure 27: Asia Pacific Electrolyte Battery Industry Revenue Share (%), by Battery Type and Electrolyte Type 2024 & 2032
- Figure 28: Asia Pacific Electrolyte Battery Industry Revenue (Million), by End User 2024 & 2032
- Figure 29: Asia Pacific Electrolyte Battery Industry Revenue Share (%), by End User 2024 & 2032
- Figure 30: Asia Pacific Electrolyte Battery Industry Revenue (Million), by Country 2024 & 2032
- Figure 31: Asia Pacific Electrolyte Battery Industry Revenue Share (%), by Country 2024 & 2032
- Figure 32: South America Electrolyte Battery Industry Revenue (Million), by Battery Type and Electrolyte Type 2024 & 2032
- Figure 33: South America Electrolyte Battery Industry Revenue Share (%), by Battery Type and Electrolyte Type 2024 & 2032
- Figure 34: South America Electrolyte Battery Industry Revenue (Million), by End User 2024 & 2032
- Figure 35: South America Electrolyte Battery Industry Revenue Share (%), by End User 2024 & 2032
- Figure 36: South America Electrolyte Battery Industry Revenue (Million), by Country 2024 & 2032
- Figure 37: South America Electrolyte Battery Industry Revenue Share (%), by Country 2024 & 2032
- Figure 38: Middle East and Africa Electrolyte Battery Industry Revenue (Million), by Battery Type and Electrolyte Type 2024 & 2032
- Figure 39: Middle East and Africa Electrolyte Battery Industry Revenue Share (%), by Battery Type and Electrolyte Type 2024 & 2032
- Figure 40: Middle East and Africa Electrolyte Battery Industry Revenue (Million), by End User 2024 & 2032
- Figure 41: Middle East and Africa Electrolyte Battery Industry Revenue Share (%), by End User 2024 & 2032
- Figure 42: Middle East and Africa Electrolyte Battery Industry Revenue (Million), by Country 2024 & 2032
- Figure 43: Middle East and Africa Electrolyte Battery Industry Revenue Share (%), by Country 2024 & 2032
List of Tables
- Table 1: Global Electrolyte Battery Industry Revenue Million Forecast, by Region 2019 & 2032
- Table 2: Global Electrolyte Battery Industry Revenue Million Forecast, by Battery Type and Electrolyte Type 2019 & 2032
- Table 3: Global Electrolyte Battery Industry Revenue Million Forecast, by End User 2019 & 2032
- Table 4: Global Electrolyte Battery Industry Revenue Million Forecast, by Region 2019 & 2032
- Table 5: Global Electrolyte Battery Industry Revenue Million Forecast, by Country 2019 & 2032
- Table 6: United States Electrolyte Battery Industry Revenue (Million) Forecast, by Application 2019 & 2032
- Table 7: Canada Electrolyte Battery Industry Revenue (Million) Forecast, by Application 2019 & 2032
- Table 8: Mexico Electrolyte Battery Industry Revenue (Million) Forecast, by Application 2019 & 2032
- Table 9: Global Electrolyte Battery Industry Revenue Million Forecast, by Country 2019 & 2032
- Table 10: Germany Electrolyte Battery Industry Revenue (Million) Forecast, by Application 2019 & 2032
- Table 11: United Kingdom Electrolyte Battery Industry Revenue (Million) Forecast, by Application 2019 & 2032
- Table 12: France Electrolyte Battery Industry Revenue (Million) Forecast, by Application 2019 & 2032
- Table 13: Spain Electrolyte Battery Industry Revenue (Million) Forecast, by Application 2019 & 2032
- Table 14: Italy Electrolyte Battery Industry Revenue (Million) Forecast, by Application 2019 & 2032
- Table 15: Spain Electrolyte Battery Industry Revenue (Million) Forecast, by Application 2019 & 2032
- Table 16: Belgium Electrolyte Battery Industry Revenue (Million) Forecast, by Application 2019 & 2032
- Table 17: Netherland Electrolyte Battery Industry Revenue (Million) Forecast, by Application 2019 & 2032
- Table 18: Nordics Electrolyte Battery Industry Revenue (Million) Forecast, by Application 2019 & 2032
- Table 19: Rest of Europe Electrolyte Battery Industry Revenue (Million) Forecast, by Application 2019 & 2032
- Table 20: Global Electrolyte Battery Industry Revenue Million Forecast, by Country 2019 & 2032
- Table 21: China Electrolyte Battery Industry Revenue (Million) Forecast, by Application 2019 & 2032
- Table 22: Japan Electrolyte Battery Industry Revenue (Million) Forecast, by Application 2019 & 2032
- Table 23: India Electrolyte Battery Industry Revenue (Million) Forecast, by Application 2019 & 2032
- Table 24: South Korea Electrolyte Battery Industry Revenue (Million) Forecast, by Application 2019 & 2032
- Table 25: Southeast Asia Electrolyte Battery Industry Revenue (Million) Forecast, by Application 2019 & 2032
- Table 26: Australia Electrolyte Battery Industry Revenue (Million) Forecast, by Application 2019 & 2032
- Table 27: Indonesia Electrolyte Battery Industry Revenue (Million) Forecast, by Application 2019 & 2032
- Table 28: Phillipes Electrolyte Battery Industry Revenue (Million) Forecast, by Application 2019 & 2032
- Table 29: Singapore Electrolyte Battery Industry Revenue (Million) Forecast, by Application 2019 & 2032
- Table 30: Thailandc Electrolyte Battery Industry Revenue (Million) Forecast, by Application 2019 & 2032
- Table 31: Rest of Asia Pacific Electrolyte Battery Industry Revenue (Million) Forecast, by Application 2019 & 2032
- Table 32: Global Electrolyte Battery Industry Revenue Million Forecast, by Country 2019 & 2032
- Table 33: Brazil Electrolyte Battery Industry Revenue (Million) Forecast, by Application 2019 & 2032
- Table 34: Argentina Electrolyte Battery Industry Revenue (Million) Forecast, by Application 2019 & 2032
- Table 35: Peru Electrolyte Battery Industry Revenue (Million) Forecast, by Application 2019 & 2032
- Table 36: Chile Electrolyte Battery Industry Revenue (Million) Forecast, by Application 2019 & 2032
- Table 37: Colombia Electrolyte Battery Industry Revenue (Million) Forecast, by Application 2019 & 2032
- Table 38: Ecuador Electrolyte Battery Industry Revenue (Million) Forecast, by Application 2019 & 2032
- Table 39: Venezuela Electrolyte Battery Industry Revenue (Million) Forecast, by Application 2019 & 2032
- Table 40: Rest of South America Electrolyte Battery Industry Revenue (Million) Forecast, by Application 2019 & 2032
- Table 41: Global Electrolyte Battery Industry Revenue Million Forecast, by Country 2019 & 2032
- Table 42: United States Electrolyte Battery Industry Revenue (Million) Forecast, by Application 2019 & 2032
- Table 43: Canada Electrolyte Battery Industry Revenue (Million) Forecast, by Application 2019 & 2032
- Table 44: Mexico Electrolyte Battery Industry Revenue (Million) Forecast, by Application 2019 & 2032
- Table 45: Global Electrolyte Battery Industry Revenue Million Forecast, by Country 2019 & 2032
- Table 46: United Arab Emirates Electrolyte Battery Industry Revenue (Million) Forecast, by Application 2019 & 2032
- Table 47: Saudi Arabia Electrolyte Battery Industry Revenue (Million) Forecast, by Application 2019 & 2032
- Table 48: South Africa Electrolyte Battery Industry Revenue (Million) Forecast, by Application 2019 & 2032
- Table 49: Rest of Middle East and Africa Electrolyte Battery Industry Revenue (Million) Forecast, by Application 2019 & 2032
- Table 50: Global Electrolyte Battery Industry Revenue Million Forecast, by Battery Type and Electrolyte Type 2019 & 2032
- Table 51: Global Electrolyte Battery Industry Revenue Million Forecast, by End User 2019 & 2032
- Table 52: Global Electrolyte Battery Industry Revenue Million Forecast, by Country 2019 & 2032
- Table 53: Global Electrolyte Battery Industry Revenue Million Forecast, by Battery Type and Electrolyte Type 2019 & 2032
- Table 54: Global Electrolyte Battery Industry Revenue Million Forecast, by End User 2019 & 2032
- Table 55: Global Electrolyte Battery Industry Revenue Million Forecast, by Country 2019 & 2032
- Table 56: Global Electrolyte Battery Industry Revenue Million Forecast, by Battery Type and Electrolyte Type 2019 & 2032
- Table 57: Global Electrolyte Battery Industry Revenue Million Forecast, by End User 2019 & 2032
- Table 58: Global Electrolyte Battery Industry Revenue Million Forecast, by Country 2019 & 2032
- Table 59: Global Electrolyte Battery Industry Revenue Million Forecast, by Battery Type and Electrolyte Type 2019 & 2032
- Table 60: Global Electrolyte Battery Industry Revenue Million Forecast, by End User 2019 & 2032
- Table 61: Global Electrolyte Battery Industry Revenue Million Forecast, by Country 2019 & 2032
- Table 62: Global Electrolyte Battery Industry Revenue Million Forecast, by Battery Type and Electrolyte Type 2019 & 2032
- Table 63: Global Electrolyte Battery Industry Revenue Million Forecast, by End User 2019 & 2032
- Table 64: Global Electrolyte Battery Industry Revenue Million Forecast, by Country 2019 & 2032
Frequently Asked Questions
1. What is the projected Compound Annual Growth Rate (CAGR) of the Electrolyte Battery Industry?
The projected CAGR is approximately 11.60%.
2. Which companies are prominent players in the Electrolyte Battery Industry?
Key companies in the market include UBE Industries Ltd, Targray Industries Inc, Mitsui Chemicals Inc, NEI Corporation, 3M Co, Guangzhou Tinci Materials Technology Co Ltd, Mitsubishi Chemical Holdings Corporation, Shenzhen Capchem Technology Co Ltd.
3. What are the main segments of the Electrolyte Battery Industry?
The market segments include Battery Type and Electrolyte Type, End User.
4. Can you provide details about the market size?
The market size is estimated to be USD XX Million as of 2022.
5. What are some drivers contributing to market growth?
Increasing Energy Demand.; Increasing Export Opportunities.
6. What are the notable trends driving market growth?
Lithium-ion Battery Expected to Dominate the Market.
7. Are there any restraints impacting market growth?
Volatility in Energy Prices.
8. Can you provide examples of recent developments in the market?
In February 2022, US Vanadium announced an expanded purchase agreement under which Austrian-based Enerox, which sells vanadium redox flow battery (VRFB) systems under its brand name CellCube, can purchase up to 3 million additional liters/year of US Vanadium's ultra-high-purity electrolyte with a price cap over the next five years. The agreement boosts the initial purchase agreement for 580,000 liters/year of US Vanadium electrolyte, announced in September 2021.
9. What pricing options are available for accessing the report?
Pricing options include single-user, multi-user, and enterprise licenses priced at USD 4750, USD 5250, and USD 8750 respectively.
10. Is the market size provided in terms of value or volume?
The market size is provided in terms of value, measured in Million.
11. Are there any specific market keywords associated with the report?
Yes, the market keyword associated with the report is "Electrolyte Battery Industry," which aids in identifying and referencing the specific market segment covered.
12. How do I determine which pricing option suits my needs best?
The pricing options vary based on user requirements and access needs. Individual users may opt for single-user licenses, while businesses requiring broader access may choose multi-user or enterprise licenses for cost-effective access to the report.
13. Are there any additional resources or data provided in the Electrolyte Battery Industry report?
While the report offers comprehensive insights, it's advisable to review the specific contents or supplementary materials provided to ascertain if additional resources or data are available.
14. How can I stay updated on further developments or reports in the Electrolyte Battery Industry?
To stay informed about further developments, trends, and reports in the Electrolyte Battery Industry, consider subscribing to industry newsletters, following relevant companies and organizations, or regularly checking reputable industry news sources and publications.
Methodology
Step 1 - Identification of Relevant Samples Size from Population Database


Step 2 - Approaches for Defining Global Market Size (Value, Volume* & Price*)

Note*: In applicable scenarios
Step 3 - Data Sources
Primary Research
- Web Analytics
- Survey Reports
- Research Institute
- Latest Research Reports
- Opinion Leaders
Secondary Research
- Annual Reports
- White Paper
- Latest Press Release
- Industry Association
- Paid Database
- Investor Presentations

Step 4 - Data Triangulation
Involves using different sources of information in order to increase the validity of a study
These sources are likely to be stakeholders in a program - participants, other researchers, program staff, other community members, and so on.
Then we put all data in single framework & apply various statistical tools to find out the dynamic on the market.
During the analysis stage, feedback from the stakeholder groups would be compared to determine areas of agreement as well as areas of divergence


