

Key Insights
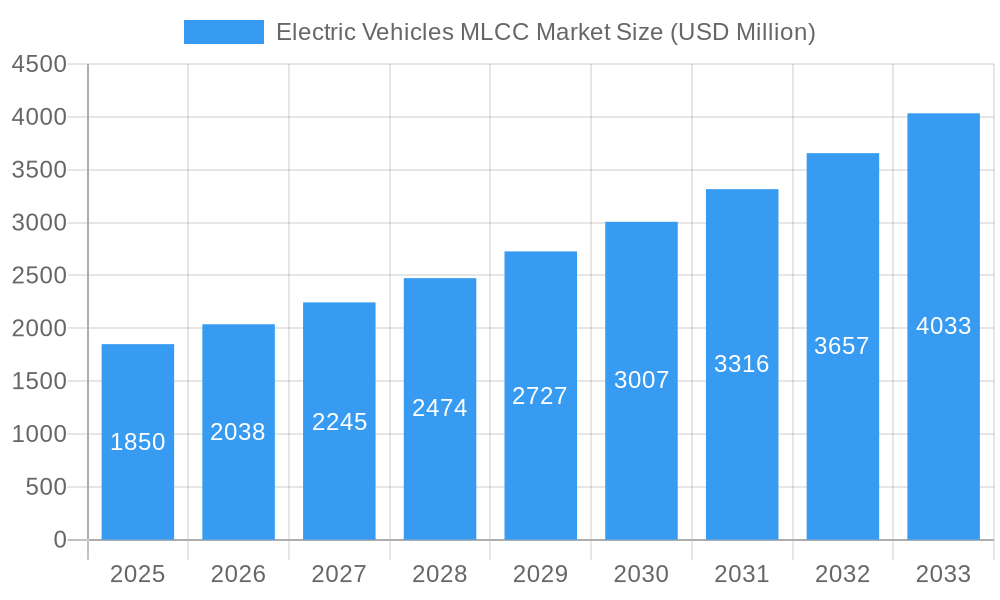
The Electric Vehicles (EV) Multilayer Ceramic Capacitor (MLCC) market is poised for robust expansion, driven by the accelerating global adoption of electric vehicles and the increasing complexity of automotive electronic systems. The market is projected to reach a valuation of USD 1.85 billion in 2025, demonstrating a significant upward trajectory. This growth is underpinned by a compelling Compound Annual Growth Rate (CAGR) of 10.29%, signaling a strong and sustained demand for high-performance MLCCs within the automotive sector. The primary drivers fueling this surge include the continuous innovation in EV battery management systems, advanced driver-assistance systems (ADAS), in-car infotainment, and the overall electrification of vehicle components, all of which rely heavily on the reliable and efficient functionality of MLCCs.
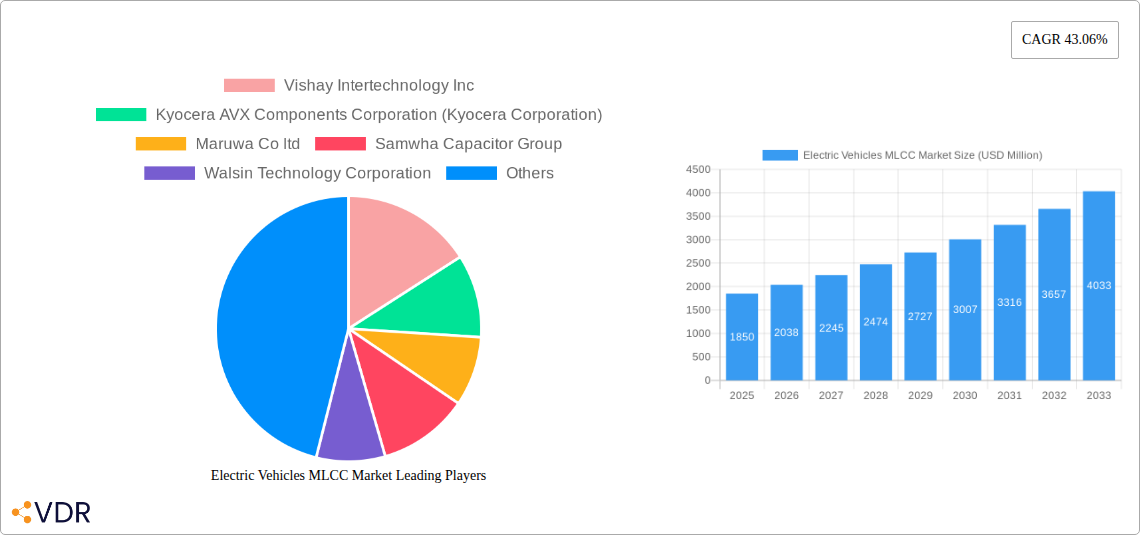
Electric Vehicles MLCC Market Market Size (In Billion)
The market's dynamic landscape is characterized by several key trends, including the growing demand for miniaturization and higher capacitance values in MLCCs to accommodate space constraints in modern EVs. Furthermore, the increasing focus on high-reliability components capable of withstanding demanding automotive environments, such as extreme temperatures and vibrations, is shaping product development. Emerging trends also point towards the integration of advanced dielectric materials for improved performance and reduced form factors. While the market enjoys strong growth, potential restraints include supply chain vulnerabilities for raw materials, fluctuating raw material prices, and the need for substantial R&D investment to keep pace with technological advancements. Key players like Murata Manufacturing Co. Ltd., TDK Corporation, and Samsung Electro-Mechanics are at the forefront of innovation, catering to the diverse needs across various case sizes, voltage ratings, capacitance ranges, and dielectric types within the EV MLCC market. The Asia Pacific region, particularly China, is expected to lead market expansion due to its dominant position in EV manufacturing.
Electric Vehicles MLCC Market Company Market Share
This in-depth report provides a critical analysis of the global Electric Vehicles (EV) Multilayer Ceramic Capacitor (MLCC) market, meticulously examining market dynamics, growth trends, regional dominance, product landscape, key drivers, challenges, opportunities, and competitive strategies. Leveraging extensive data and expert insights, this report serves as an indispensable resource for stakeholders seeking to understand and capitalize on the burgeoning EV MLCC sector. The study encompasses the period from 2019 to 2033, with a base year of 2025 and a detailed forecast period from 2025 to 2033.
Electric Vehicles MLCC Market Market Dynamics & Structure
The Electric Vehicles MLCC market is characterized by intense competition and rapid technological evolution, driven by the unprecedented growth in electric vehicle production. Market concentration is high, with a few dominant players like Murata Manufacturing Co Ltd, TDK Corporation, and Taiyo Yuden Co Ltd holding significant market shares. Technological innovation is a primary driver, focusing on higher capacitance density, improved reliability under extreme automotive conditions (temperature, vibration), and miniaturization to support the compact designs of modern EVs. Regulatory frameworks, particularly those mandating emissions reduction and promoting EV adoption, indirectly fuel the demand for high-performance automotive-grade MLCCs. Competitive product substitutes for MLCCs in certain niche applications exist, but for critical power management and filtering functions in EVs, MLCCs remain indispensable. End-user demographics are shifting towards younger, environmentally conscious consumers who are increasingly adopting electric vehicles. Merger and acquisition (M&A) trends are observed as larger corporations aim to consolidate market presence and acquire innovative technologies, exemplified by Yageo Corporation's acquisition of KEMET, bolstering its position in the automotive MLCC space.
- Market Concentration: Dominated by a few key global manufacturers, with a strong emphasis on R&D and product quality.
- Technological Innovation Drivers: Demand for higher voltage ratings, increased capacitance, smaller form factors, and enhanced thermal stability.
- Regulatory Frameworks: Government incentives for EV adoption and stricter automotive emission standards indirectly boost MLCC demand.
- Competitive Product Substitutes: Limited for core EV applications, but alternative capacitor technologies are explored for non-critical functions.
- End-User Demographics: Growing preference for EVs driven by environmental concerns and evolving mobility needs.
- M&A Trends: Strategic acquisitions to enhance product portfolios and market reach, consolidating the competitive landscape.
Electric Vehicles MLCC Market Growth Trends & Insights
The global Electric Vehicles MLCC market is poised for exponential growth, driven by the accelerating transition towards electrified transportation. The market size is projected to expand significantly, propelled by rising EV production volumes worldwide. Adoption rates for EVs are surging, directly translating into increased demand for essential MLCC components used across various EV subsystems, including battery management systems (BMS), on-board chargers (OBC), DC-DC converters, and inverters. Technological disruptions, such as the development of higher voltage MLCCs to support advanced 800V powertrains and advancements in dielectric materials for enhanced performance and reliability, are further shaping market dynamics. Consumer behavior shifts, including a growing awareness of environmental sustainability and decreasing battery costs, are contributing to the mainstream adoption of EVs. The CAGR for the EV MLCC market is expected to be robust, reflecting this strong upward trajectory. Market penetration of MLCCs within the EV ecosystem is already substantial and will continue to deepen as vehicle architectures become more complex and reliant on advanced electronic components.
Dominant Regions, Countries, or Segments in Electric Vehicles MLCC Market
Asia-Pacific is the undisputed dominant region in the Electric Vehicles MLCC market, largely driven by the robust manufacturing capabilities and significant production volumes of electric vehicles in countries like China, Japan, and South Korea. China, in particular, is a powerhouse in both EV production and MLCC manufacturing, benefiting from strong government support, extensive supply chains, and a vast domestic market. Japan is home to leading MLCC manufacturers such as Murata Manufacturing Co Ltd and TDK Corporation, who are at the forefront of technological innovation and supply critical components to global EV manufacturers. South Korea also plays a vital role through companies like Samsung Electro-Mechanics.
Within the segment breakdown, Case Size: 1210 and Case Size: 1812 are witnessing substantial growth due to their ability to accommodate higher capacitance and voltage ratings, crucial for the power-hungry applications in EVs. The Voltage: More than 200V segment is experiencing a significant upswing, directly correlating with the industry's shift towards higher voltage EV architectures (e.g., 800V systems) to improve charging speeds and performance. Similarly, the Capacitance: 10 µF to 1000 µF and Capacitance: More than 1000µF ranges are vital for energy storage and power filtering in battery packs and power electronics. The Dielectric Type: Class 2 capacitors, particularly those with X7R and X5R dielectrics, are prevalent due to their favorable balance of capacitance density and temperature stability, making them ideal for automotive applications.
- Dominant Region: Asia-Pacific (China, Japan, South Korea)
- Key Drivers: High EV production volumes, strong domestic MLCC manufacturing base, government support, advanced supply chains.
- Market Share: Estimated to hold over 60% of the global EV MLCC market.
- Growth Potential: Continual expansion driven by ongoing EV adoption and technological advancements.
- Dominant Segments:
- Case Size: 1210, 1812 (demand for higher capacity and voltage)
- Voltage: More than 200V (essential for 800V architectures)
- Capacitance: 10 µF to 1000 µF, More than 1000µF (critical for power management)
- Dielectric Type: Class 2 (X7R, X5R) for their performance-to-cost ratio and stability.
Electric Vehicles MLCC Market Product Landscape
The EV MLCC product landscape is characterized by continuous innovation aimed at meeting the stringent demands of electric vehicles. Manufacturers are developing MLCCs with higher capacitance values in smaller form factors, improved high-voltage capabilities, and enhanced thermal and mechanical reliability to withstand the harsh automotive environment. Key product innovations include high-voltage MLCCs designed for 800V powertrains and advanced materials for greater energy density and efficiency. Applications span across critical EV systems such as battery management, charging infrastructure, powertrain control, and infotainment. Performance metrics like dielectric loss, Equivalent Series Resistance (ESR), and operational temperature range are continually being optimized.
Key Drivers, Barriers & Challenges in Electric Vehicles MLCC Market
Key Drivers:
- Accelerating Electric Vehicle Adoption: Government mandates, growing environmental awareness, and decreasing battery costs are driving unprecedented EV sales, directly fueling MLCC demand.
- Technological Advancements in EVs: The evolution towards higher voltage powertrains (800V), faster charging, and sophisticated battery management systems necessitate advanced MLCCs.
- Miniaturization Trends: The need for compact and lightweight EV components drives the demand for high-capacitance MLCCs in smaller case sizes.
- Stringent Automotive Standards: Increasing safety and reliability requirements for automotive electronics mandate the use of high-quality, automotive-grade MLCCs.
Key Barriers & Challenges:
- Supply Chain Volatility: Disruptions in raw material availability (e.g., ceramics, palladium) and geopolitical factors can lead to price fluctuations and supply shortages.
- High R&D Investment: Developing next-generation MLCCs with higher performance specifications requires significant investment in research and development, posing a barrier for smaller players.
- Cost Pressures: The mass-market adoption of EVs necessitates cost-effective MLCC solutions, creating pressure on manufacturers to optimize production processes.
- Intense Competition: The market is highly competitive, with numerous global players vying for market share, leading to pricing challenges.
- Reliability in Extreme Conditions: Ensuring consistent performance and longevity of MLCCs under extreme temperatures, vibration, and humidity in automotive applications remains a continuous challenge.
Emerging Opportunities in Electric Vehicles MLCC Market
Emerging opportunities in the Electric Vehicles MLCC market lie in the development of ultra-high capacitance MLCCs capable of handling the increasing power demands of next-generation EVs, particularly in areas like solid-state batteries and advanced power electronics. The expansion of charging infrastructure, including fast-charging stations, presents a significant opportunity for specialized MLCCs designed for these demanding applications. Furthermore, advancements in wireless power transfer (WPT) technology for EV charging also opens avenues for innovative MLCC solutions. Untapped markets in emerging economies with growing EV adoption rates also represent significant potential.
Growth Accelerators in the Electric Vehicles MLCC Market Industry
The long-term growth of the Electric Vehicles MLCC market is being significantly accelerated by several key factors. Technological breakthroughs in materials science are enabling the development of MLCCs with higher energy density, greater voltage resistance, and improved thermal management capabilities. Strategic partnerships between MLCC manufacturers and major automotive OEMs are crucial for co-development and ensuring that capacitor solutions meet the evolving needs of vehicle platforms. Market expansion strategies, including the establishment of local manufacturing facilities in key EV production hubs, are also driving growth and ensuring closer proximity to customers. The ongoing push towards autonomous driving and advanced driver-assistance systems (ADAS) in EVs further amplifies the need for reliable and high-performance electronic components, including advanced MLCCs.
Key Players Shaping the Electric Vehicles MLCC Market Market
- Vishay Intertechnology Inc
- Kyocera AVX Components Corporation (Kyocera Corporation)
- Maruwa Co ltd
- Samwha Capacitor Group
- Walsin Technology Corporation
- Samsung Electro-Mechanics
- Würth Elektronik GmbH & Co KG
- Yageo Corporation
- Taiyo Yuden Co Ltd
- TDK Corporation
- Murata Manufacturing Co Ltd
- Nippon Chemi-Con Corporation
Notable Milestones in Electric Vehicles MLCC Market Sector
- July 2023: KEMET, part of Yageo Corporation, developed the X7R automotive grade MLCC X7R. This MLCC is designed to meet the high voltage requirements of automotive subsystems, ranging from 100pF-0.1uF and with a DC voltage range of 500V-1kV. The range of cases available is EIA 0603-1210, and is suitable for both automotive under hoods and in-cabin applications. These MLCCs demonstrate the essential and reliable nature of capacitors, which are essential for the mission and safety of automotive subsystems.
- June 2023: The growing demand for industrial equipment has driven the company to introduce NTS/NTF NTS/NTF Series of SMD type MLCC. These capacitors are rated with 25 to 500 Vdc with a capacitance ranging from 0.010 to 47µF. These MLCCs are used in on-board power supplies, voltage regulators for computers, smoothing circuits of DC-DC converters, etc.
- May 2023: Murata has introduced the EVA series of MLCC, which are beneficial to EV manufacturers due to their versatility. These MLCC's can be used in a variety of applications, including OBC (On-Board Charger), inverter and DC/DC Converter, BMS (Battery Management System), and WPT (Wireless Power Transfer) implementations. As a result, they are ideal to the increased isolation that the 800V powertrain migration will require, while also meeting the miniaturization requirements of modern automotive systems.
In-Depth Electric Vehicles MLCC Market Market Outlook
The future outlook for the Electric Vehicles MLCC market is exceptionally bright, with sustained growth projected over the forecast period. Key growth accelerators include the continuous evolution of battery technology, demanding higher capacitance and voltage ratings, and the increasing integration of advanced driver-assistance systems (ADAS) and autonomous driving features, which require more sophisticated electronic components. Strategic partnerships between MLCC manufacturers and leading automotive OEMs will be instrumental in driving innovation and market penetration. Furthermore, the global push towards decarbonization and the establishment of robust EV charging infrastructure will continue to underpin the robust demand for high-performance MLCCs. The market is poised for significant expansion as EVs become an even more integral part of the global transportation landscape.
Electric Vehicles MLCC Market Segmentation
-
1. Case Size
- 1.1. 0 603
- 1.2. 0 805
- 1.3. 1 206
- 1.4. 1 210
- 1.5. 1 812
- 1.6. Others
-
2. Voltage
- 2.1. 50V to 200V
- 2.2. Less than 50V
- 2.3. More than 200V
-
3. Capacitance
- 3.1. 10 µF to 1000 µF
- 3.2. Less than 10 µF
- 3.3. More than 1000µF
-
4. Dielectric Type
- 4.1. Class 1
- 4.2. Class 2
Electric Vehicles MLCC Market Segmentation By Geography
-
1. North America
- 1.1. United States
- 1.2. Canada
- 1.3. Mexico
-
2. South America
- 2.1. Brazil
- 2.2. Argentina
- 2.3. Rest of South America
-
3. Europe
- 3.1. United Kingdom
- 3.2. Germany
- 3.3. France
- 3.4. Italy
- 3.5. Spain
- 3.6. Russia
- 3.7. Benelux
- 3.8. Nordics
- 3.9. Rest of Europe
-
4. Middle East & Africa
- 4.1. Turkey
- 4.2. Israel
- 4.3. GCC
- 4.4. North Africa
- 4.5. South Africa
- 4.6. Rest of Middle East & Africa
-
5. Asia Pacific
- 5.1. China
- 5.2. India
- 5.3. Japan
- 5.4. South Korea
- 5.5. ASEAN
- 5.6. Oceania
- 5.7. Rest of Asia Pacific
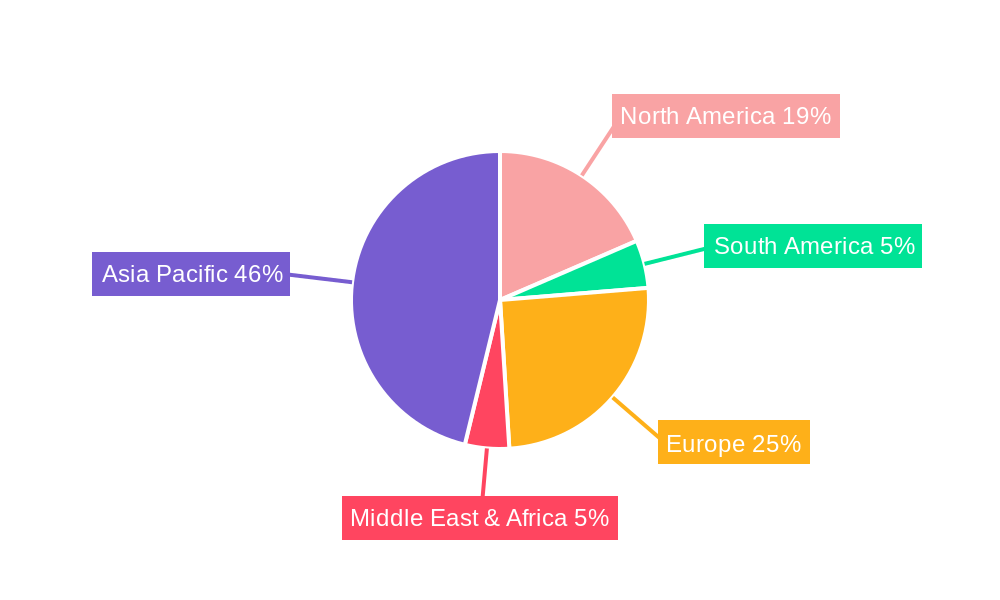
Electric Vehicles MLCC Market Regional Market Share
Geographic Coverage of Electric Vehicles MLCC Market
Electric Vehicles MLCC Market REPORT HIGHLIGHTS
| Aspects | Details |
|---|---|
| Study Period | 2020-2034 |
| Base Year | 2025 |
| Estimated Year | 2026 |
| Forecast Period | 2026-2034 |
| Historical Period | 2020-2025 |
| Growth Rate | CAGR of 15.2% from 2020-2034 |
| Segmentation |
|
Table of Contents
- 1. Introduction
- 1.1. Research Scope
- 1.2. Market Segmentation
- 1.3. Research Objective
- 1.4. Definitions and Assumptions
- 2. Executive Summary
- 2.1. Market Snapshot
- 3. Market Dynamics
- 3.1. Market Drivers
- 3.2. Market Restrains
- 3.3. Market Trends
- 3.4. Market Opportunities
- 4. Market Factor Analysis
- 4.1. Porters Five Forces
- 4.1.1. Bargaining Power of Suppliers
- 4.1.2. Bargaining Power of Buyers
- 4.1.3. Threat of New Entrants
- 4.1.4. Threat of Substitutes
- 4.1.5. Competitive Rivalry
- 4.2. PESTEL analysis
- 4.3. BCG Analysis
- 4.3.1. Stars (High Growth, High Market Share)
- 4.3.2. Cash Cows (Low Growth, High Market Share)
- 4.3.3. Question Mark (High Growth, Low Market Share)
- 4.3.4. Dogs (Low Growth, Low Market Share)
- 4.4. Ansoff Matrix Analysis
- 4.5. Supply Chain Analysis
- 4.6. Regulatory Landscape
- 4.7. Current Market Potential and Opportunity Assessment (TAM–SAM–SOM Framework)
- 4.8. VDR Analyst Note
- 4.1. Porters Five Forces
- 5. Market Analysis, Insights and Forecast 2021-2033
- 5.1. Market Analysis, Insights and Forecast - by Case Size
- 5.1.1. 0 603
- 5.1.2. 0 805
- 5.1.3. 1 206
- 5.1.4. 1 210
- 5.1.5. 1 812
- 5.1.6. Others
- 5.2. Market Analysis, Insights and Forecast - by Voltage
- 5.2.1. 50V to 200V
- 5.2.2. Less than 50V
- 5.2.3. More than 200V
- 5.3. Market Analysis, Insights and Forecast - by Capacitance
- 5.3.1. 10 µF to 1000 µF
- 5.3.2. Less than 10 µF
- 5.3.3. More than 1000µF
- 5.4. Market Analysis, Insights and Forecast - by Dielectric Type
- 5.4.1. Class 1
- 5.4.2. Class 2
- 5.5. Market Analysis, Insights and Forecast - by Region
- 5.5.1. North America
- 5.5.2. South America
- 5.5.3. Europe
- 5.5.4. Middle East & Africa
- 5.5.5. Asia Pacific
- 5.1. Market Analysis, Insights and Forecast - by Case Size
- 6. Global Electric Vehicles MLCC Market Analysis, Insights and Forecast, 2021-2033
- 6.1. Market Analysis, Insights and Forecast - by Case Size
- 6.1.1. 0 603
- 6.1.2. 0 805
- 6.1.3. 1 206
- 6.1.4. 1 210
- 6.1.5. 1 812
- 6.1.6. Others
- 6.2. Market Analysis, Insights and Forecast - by Voltage
- 6.2.1. 50V to 200V
- 6.2.2. Less than 50V
- 6.2.3. More than 200V
- 6.3. Market Analysis, Insights and Forecast - by Capacitance
- 6.3.1. 10 µF to 1000 µF
- 6.3.2. Less than 10 µF
- 6.3.3. More than 1000µF
- 6.4. Market Analysis, Insights and Forecast - by Dielectric Type
- 6.4.1. Class 1
- 6.4.2. Class 2
- 6.1. Market Analysis, Insights and Forecast - by Case Size
- 7. North America Electric Vehicles MLCC Market Analysis, Insights and Forecast, 2021-2033
- 7.1. Market Analysis, Insights and Forecast - by Case Size
- 7.1.1. 0 603
- 7.1.2. 0 805
- 7.1.3. 1 206
- 7.1.4. 1 210
- 7.1.5. 1 812
- 7.1.6. Others
- 7.2. Market Analysis, Insights and Forecast - by Voltage
- 7.2.1. 50V to 200V
- 7.2.2. Less than 50V
- 7.2.3. More than 200V
- 7.3. Market Analysis, Insights and Forecast - by Capacitance
- 7.3.1. 10 µF to 1000 µF
- 7.3.2. Less than 10 µF
- 7.3.3. More than 1000µF
- 7.4. Market Analysis, Insights and Forecast - by Dielectric Type
- 7.4.1. Class 1
- 7.4.2. Class 2
- 7.1. Market Analysis, Insights and Forecast - by Case Size
- 8. South America Electric Vehicles MLCC Market Analysis, Insights and Forecast, 2021-2033
- 8.1. Market Analysis, Insights and Forecast - by Case Size
- 8.1.1. 0 603
- 8.1.2. 0 805
- 8.1.3. 1 206
- 8.1.4. 1 210
- 8.1.5. 1 812
- 8.1.6. Others
- 8.2. Market Analysis, Insights and Forecast - by Voltage
- 8.2.1. 50V to 200V
- 8.2.2. Less than 50V
- 8.2.3. More than 200V
- 8.3. Market Analysis, Insights and Forecast - by Capacitance
- 8.3.1. 10 µF to 1000 µF
- 8.3.2. Less than 10 µF
- 8.3.3. More than 1000µF
- 8.4. Market Analysis, Insights and Forecast - by Dielectric Type
- 8.4.1. Class 1
- 8.4.2. Class 2
- 8.1. Market Analysis, Insights and Forecast - by Case Size
- 9. Europe Electric Vehicles MLCC Market Analysis, Insights and Forecast, 2021-2033
- 9.1. Market Analysis, Insights and Forecast - by Case Size
- 9.1.1. 0 603
- 9.1.2. 0 805
- 9.1.3. 1 206
- 9.1.4. 1 210
- 9.1.5. 1 812
- 9.1.6. Others
- 9.2. Market Analysis, Insights and Forecast - by Voltage
- 9.2.1. 50V to 200V
- 9.2.2. Less than 50V
- 9.2.3. More than 200V
- 9.3. Market Analysis, Insights and Forecast - by Capacitance
- 9.3.1. 10 µF to 1000 µF
- 9.3.2. Less than 10 µF
- 9.3.3. More than 1000µF
- 9.4. Market Analysis, Insights and Forecast - by Dielectric Type
- 9.4.1. Class 1
- 9.4.2. Class 2
- 9.1. Market Analysis, Insights and Forecast - by Case Size
- 10. Middle East & Africa Electric Vehicles MLCC Market Analysis, Insights and Forecast, 2021-2033
- 10.1. Market Analysis, Insights and Forecast - by Case Size
- 10.1.1. 0 603
- 10.1.2. 0 805
- 10.1.3. 1 206
- 10.1.4. 1 210
- 10.1.5. 1 812
- 10.1.6. Others
- 10.2. Market Analysis, Insights and Forecast - by Voltage
- 10.2.1. 50V to 200V
- 10.2.2. Less than 50V
- 10.2.3. More than 200V
- 10.3. Market Analysis, Insights and Forecast - by Capacitance
- 10.3.1. 10 µF to 1000 µF
- 10.3.2. Less than 10 µF
- 10.3.3. More than 1000µF
- 10.4. Market Analysis, Insights and Forecast - by Dielectric Type
- 10.4.1. Class 1
- 10.4.2. Class 2
- 10.1. Market Analysis, Insights and Forecast - by Case Size
- 11. Asia Pacific Electric Vehicles MLCC Market Analysis, Insights and Forecast, 2021-2033
- 11.1. Market Analysis, Insights and Forecast - by Case Size
- 11.1.1. 0 603
- 11.1.2. 0 805
- 11.1.3. 1 206
- 11.1.4. 1 210
- 11.1.5. 1 812
- 11.1.6. Others
- 11.2. Market Analysis, Insights and Forecast - by Voltage
- 11.2.1. 50V to 200V
- 11.2.2. Less than 50V
- 11.2.3. More than 200V
- 11.3. Market Analysis, Insights and Forecast - by Capacitance
- 11.3.1. 10 µF to 1000 µF
- 11.3.2. Less than 10 µF
- 11.3.3. More than 1000µF
- 11.4. Market Analysis, Insights and Forecast - by Dielectric Type
- 11.4.1. Class 1
- 11.4.2. Class 2
- 11.1. Market Analysis, Insights and Forecast - by Case Size
- 12. Competitive Analysis
- 12.1. Company Profiles
- 12.1.1 Vishay Intertechnology Inc
- 12.1.1.1. Company Overview
- 12.1.1.2. Products
- 12.1.1.3. Company Financials
- 12.1.1.4. SWOT Analysis
- 12.1.2 Kyocera AVX Components Corporation (Kyocera Corporation)
- 12.1.2.1. Company Overview
- 12.1.2.2. Products
- 12.1.2.3. Company Financials
- 12.1.2.4. SWOT Analysis
- 12.1.3 Maruwa Co ltd
- 12.1.3.1. Company Overview
- 12.1.3.2. Products
- 12.1.3.3. Company Financials
- 12.1.3.4. SWOT Analysis
- 12.1.4 Samwha Capacitor Group
- 12.1.4.1. Company Overview
- 12.1.4.2. Products
- 12.1.4.3. Company Financials
- 12.1.4.4. SWOT Analysis
- 12.1.5 Walsin Technology Corporation
- 12.1.5.1. Company Overview
- 12.1.5.2. Products
- 12.1.5.3. Company Financials
- 12.1.5.4. SWOT Analysis
- 12.1.6 Samsung Electro-Mechanics
- 12.1.6.1. Company Overview
- 12.1.6.2. Products
- 12.1.6.3. Company Financials
- 12.1.6.4. SWOT Analysis
- 12.1.7 Würth Elektronik GmbH & Co KG
- 12.1.7.1. Company Overview
- 12.1.7.2. Products
- 12.1.7.3. Company Financials
- 12.1.7.4. SWOT Analysis
- 12.1.8 Yageo Corporatio
- 12.1.8.1. Company Overview
- 12.1.8.2. Products
- 12.1.8.3. Company Financials
- 12.1.8.4. SWOT Analysis
- 12.1.9 Taiyo Yuden Co Ltd
- 12.1.9.1. Company Overview
- 12.1.9.2. Products
- 12.1.9.3. Company Financials
- 12.1.9.4. SWOT Analysis
- 12.1.10 TDK Corporation
- 12.1.10.1. Company Overview
- 12.1.10.2. Products
- 12.1.10.3. Company Financials
- 12.1.10.4. SWOT Analysis
- 12.1.11 Murata Manufacturing Co Ltd
- 12.1.11.1. Company Overview
- 12.1.11.2. Products
- 12.1.11.3. Company Financials
- 12.1.11.4. SWOT Analysis
- 12.1.12 Nippon Chemi-Con Corporation
- 12.1.12.1. Company Overview
- 12.1.12.2. Products
- 12.1.12.3. Company Financials
- 12.1.12.4. SWOT Analysis
- 12.1.1 Vishay Intertechnology Inc
- 12.2. Market Entropy
- 12.2.1 Company's Key Areas Served
- 12.2.2 Recent Developments
- 12.3. Company Market Share Analysis 2025
- 12.3.1 Top 5 Companies Market Share Analysis
- 12.3.2 Top 3 Companies Market Share Analysis
- 12.4. List of Potential Customers
- 13. Research Methodology
List of Figures
- Figure 1: Global Electric Vehicles MLCC Market Revenue Breakdown (undefined, %) by Region 2025 & 2033
- Figure 2: North America Electric Vehicles MLCC Market Revenue (undefined), by Case Size 2025 & 2033
- Figure 3: North America Electric Vehicles MLCC Market Revenue Share (%), by Case Size 2025 & 2033
- Figure 4: North America Electric Vehicles MLCC Market Revenue (undefined), by Voltage 2025 & 2033
- Figure 5: North America Electric Vehicles MLCC Market Revenue Share (%), by Voltage 2025 & 2033
- Figure 6: North America Electric Vehicles MLCC Market Revenue (undefined), by Capacitance 2025 & 2033
- Figure 7: North America Electric Vehicles MLCC Market Revenue Share (%), by Capacitance 2025 & 2033
- Figure 8: North America Electric Vehicles MLCC Market Revenue (undefined), by Dielectric Type 2025 & 2033
- Figure 9: North America Electric Vehicles MLCC Market Revenue Share (%), by Dielectric Type 2025 & 2033
- Figure 10: North America Electric Vehicles MLCC Market Revenue (undefined), by Country 2025 & 2033
- Figure 11: North America Electric Vehicles MLCC Market Revenue Share (%), by Country 2025 & 2033
- Figure 12: South America Electric Vehicles MLCC Market Revenue (undefined), by Case Size 2025 & 2033
- Figure 13: South America Electric Vehicles MLCC Market Revenue Share (%), by Case Size 2025 & 2033
- Figure 14: South America Electric Vehicles MLCC Market Revenue (undefined), by Voltage 2025 & 2033
- Figure 15: South America Electric Vehicles MLCC Market Revenue Share (%), by Voltage 2025 & 2033
- Figure 16: South America Electric Vehicles MLCC Market Revenue (undefined), by Capacitance 2025 & 2033
- Figure 17: South America Electric Vehicles MLCC Market Revenue Share (%), by Capacitance 2025 & 2033
- Figure 18: South America Electric Vehicles MLCC Market Revenue (undefined), by Dielectric Type 2025 & 2033
- Figure 19: South America Electric Vehicles MLCC Market Revenue Share (%), by Dielectric Type 2025 & 2033
- Figure 20: South America Electric Vehicles MLCC Market Revenue (undefined), by Country 2025 & 2033
- Figure 21: South America Electric Vehicles MLCC Market Revenue Share (%), by Country 2025 & 2033
- Figure 22: Europe Electric Vehicles MLCC Market Revenue (undefined), by Case Size 2025 & 2033
- Figure 23: Europe Electric Vehicles MLCC Market Revenue Share (%), by Case Size 2025 & 2033
- Figure 24: Europe Electric Vehicles MLCC Market Revenue (undefined), by Voltage 2025 & 2033
- Figure 25: Europe Electric Vehicles MLCC Market Revenue Share (%), by Voltage 2025 & 2033
- Figure 26: Europe Electric Vehicles MLCC Market Revenue (undefined), by Capacitance 2025 & 2033
- Figure 27: Europe Electric Vehicles MLCC Market Revenue Share (%), by Capacitance 2025 & 2033
- Figure 28: Europe Electric Vehicles MLCC Market Revenue (undefined), by Dielectric Type 2025 & 2033
- Figure 29: Europe Electric Vehicles MLCC Market Revenue Share (%), by Dielectric Type 2025 & 2033
- Figure 30: Europe Electric Vehicles MLCC Market Revenue (undefined), by Country 2025 & 2033
- Figure 31: Europe Electric Vehicles MLCC Market Revenue Share (%), by Country 2025 & 2033
- Figure 32: Middle East & Africa Electric Vehicles MLCC Market Revenue (undefined), by Case Size 2025 & 2033
- Figure 33: Middle East & Africa Electric Vehicles MLCC Market Revenue Share (%), by Case Size 2025 & 2033
- Figure 34: Middle East & Africa Electric Vehicles MLCC Market Revenue (undefined), by Voltage 2025 & 2033
- Figure 35: Middle East & Africa Electric Vehicles MLCC Market Revenue Share (%), by Voltage 2025 & 2033
- Figure 36: Middle East & Africa Electric Vehicles MLCC Market Revenue (undefined), by Capacitance 2025 & 2033
- Figure 37: Middle East & Africa Electric Vehicles MLCC Market Revenue Share (%), by Capacitance 2025 & 2033
- Figure 38: Middle East & Africa Electric Vehicles MLCC Market Revenue (undefined), by Dielectric Type 2025 & 2033
- Figure 39: Middle East & Africa Electric Vehicles MLCC Market Revenue Share (%), by Dielectric Type 2025 & 2033
- Figure 40: Middle East & Africa Electric Vehicles MLCC Market Revenue (undefined), by Country 2025 & 2033
- Figure 41: Middle East & Africa Electric Vehicles MLCC Market Revenue Share (%), by Country 2025 & 2033
- Figure 42: Asia Pacific Electric Vehicles MLCC Market Revenue (undefined), by Case Size 2025 & 2033
- Figure 43: Asia Pacific Electric Vehicles MLCC Market Revenue Share (%), by Case Size 2025 & 2033
- Figure 44: Asia Pacific Electric Vehicles MLCC Market Revenue (undefined), by Voltage 2025 & 2033
- Figure 45: Asia Pacific Electric Vehicles MLCC Market Revenue Share (%), by Voltage 2025 & 2033
- Figure 46: Asia Pacific Electric Vehicles MLCC Market Revenue (undefined), by Capacitance 2025 & 2033
- Figure 47: Asia Pacific Electric Vehicles MLCC Market Revenue Share (%), by Capacitance 2025 & 2033
- Figure 48: Asia Pacific Electric Vehicles MLCC Market Revenue (undefined), by Dielectric Type 2025 & 2033
- Figure 49: Asia Pacific Electric Vehicles MLCC Market Revenue Share (%), by Dielectric Type 2025 & 2033
- Figure 50: Asia Pacific Electric Vehicles MLCC Market Revenue (undefined), by Country 2025 & 2033
- Figure 51: Asia Pacific Electric Vehicles MLCC Market Revenue Share (%), by Country 2025 & 2033
List of Tables
- Table 1: Global Electric Vehicles MLCC Market Revenue undefined Forecast, by Case Size 2020 & 2033
- Table 2: Global Electric Vehicles MLCC Market Revenue undefined Forecast, by Voltage 2020 & 2033
- Table 3: Global Electric Vehicles MLCC Market Revenue undefined Forecast, by Capacitance 2020 & 2033
- Table 4: Global Electric Vehicles MLCC Market Revenue undefined Forecast, by Dielectric Type 2020 & 2033
- Table 5: Global Electric Vehicles MLCC Market Revenue undefined Forecast, by Region 2020 & 2033
- Table 6: Global Electric Vehicles MLCC Market Revenue undefined Forecast, by Case Size 2020 & 2033
- Table 7: Global Electric Vehicles MLCC Market Revenue undefined Forecast, by Voltage 2020 & 2033
- Table 8: Global Electric Vehicles MLCC Market Revenue undefined Forecast, by Capacitance 2020 & 2033
- Table 9: Global Electric Vehicles MLCC Market Revenue undefined Forecast, by Dielectric Type 2020 & 2033
- Table 10: Global Electric Vehicles MLCC Market Revenue undefined Forecast, by Country 2020 & 2033
- Table 11: United States Electric Vehicles MLCC Market Revenue (undefined) Forecast, by Application 2020 & 2033
- Table 12: Canada Electric Vehicles MLCC Market Revenue (undefined) Forecast, by Application 2020 & 2033
- Table 13: Mexico Electric Vehicles MLCC Market Revenue (undefined) Forecast, by Application 2020 & 2033
- Table 14: Global Electric Vehicles MLCC Market Revenue undefined Forecast, by Case Size 2020 & 2033
- Table 15: Global Electric Vehicles MLCC Market Revenue undefined Forecast, by Voltage 2020 & 2033
- Table 16: Global Electric Vehicles MLCC Market Revenue undefined Forecast, by Capacitance 2020 & 2033
- Table 17: Global Electric Vehicles MLCC Market Revenue undefined Forecast, by Dielectric Type 2020 & 2033
- Table 18: Global Electric Vehicles MLCC Market Revenue undefined Forecast, by Country 2020 & 2033
- Table 19: Brazil Electric Vehicles MLCC Market Revenue (undefined) Forecast, by Application 2020 & 2033
- Table 20: Argentina Electric Vehicles MLCC Market Revenue (undefined) Forecast, by Application 2020 & 2033
- Table 21: Rest of South America Electric Vehicles MLCC Market Revenue (undefined) Forecast, by Application 2020 & 2033
- Table 22: Global Electric Vehicles MLCC Market Revenue undefined Forecast, by Case Size 2020 & 2033
- Table 23: Global Electric Vehicles MLCC Market Revenue undefined Forecast, by Voltage 2020 & 2033
- Table 24: Global Electric Vehicles MLCC Market Revenue undefined Forecast, by Capacitance 2020 & 2033
- Table 25: Global Electric Vehicles MLCC Market Revenue undefined Forecast, by Dielectric Type 2020 & 2033
- Table 26: Global Electric Vehicles MLCC Market Revenue undefined Forecast, by Country 2020 & 2033
- Table 27: United Kingdom Electric Vehicles MLCC Market Revenue (undefined) Forecast, by Application 2020 & 2033
- Table 28: Germany Electric Vehicles MLCC Market Revenue (undefined) Forecast, by Application 2020 & 2033
- Table 29: France Electric Vehicles MLCC Market Revenue (undefined) Forecast, by Application 2020 & 2033
- Table 30: Italy Electric Vehicles MLCC Market Revenue (undefined) Forecast, by Application 2020 & 2033
- Table 31: Spain Electric Vehicles MLCC Market Revenue (undefined) Forecast, by Application 2020 & 2033
- Table 32: Russia Electric Vehicles MLCC Market Revenue (undefined) Forecast, by Application 2020 & 2033
- Table 33: Benelux Electric Vehicles MLCC Market Revenue (undefined) Forecast, by Application 2020 & 2033
- Table 34: Nordics Electric Vehicles MLCC Market Revenue (undefined) Forecast, by Application 2020 & 2033
- Table 35: Rest of Europe Electric Vehicles MLCC Market Revenue (undefined) Forecast, by Application 2020 & 2033
- Table 36: Global Electric Vehicles MLCC Market Revenue undefined Forecast, by Case Size 2020 & 2033
- Table 37: Global Electric Vehicles MLCC Market Revenue undefined Forecast, by Voltage 2020 & 2033
- Table 38: Global Electric Vehicles MLCC Market Revenue undefined Forecast, by Capacitance 2020 & 2033
- Table 39: Global Electric Vehicles MLCC Market Revenue undefined Forecast, by Dielectric Type 2020 & 2033
- Table 40: Global Electric Vehicles MLCC Market Revenue undefined Forecast, by Country 2020 & 2033
- Table 41: Turkey Electric Vehicles MLCC Market Revenue (undefined) Forecast, by Application 2020 & 2033
- Table 42: Israel Electric Vehicles MLCC Market Revenue (undefined) Forecast, by Application 2020 & 2033
- Table 43: GCC Electric Vehicles MLCC Market Revenue (undefined) Forecast, by Application 2020 & 2033
- Table 44: North Africa Electric Vehicles MLCC Market Revenue (undefined) Forecast, by Application 2020 & 2033
- Table 45: South Africa Electric Vehicles MLCC Market Revenue (undefined) Forecast, by Application 2020 & 2033
- Table 46: Rest of Middle East & Africa Electric Vehicles MLCC Market Revenue (undefined) Forecast, by Application 2020 & 2033
- Table 47: Global Electric Vehicles MLCC Market Revenue undefined Forecast, by Case Size 2020 & 2033
- Table 48: Global Electric Vehicles MLCC Market Revenue undefined Forecast, by Voltage 2020 & 2033
- Table 49: Global Electric Vehicles MLCC Market Revenue undefined Forecast, by Capacitance 2020 & 2033
- Table 50: Global Electric Vehicles MLCC Market Revenue undefined Forecast, by Dielectric Type 2020 & 2033
- Table 51: Global Electric Vehicles MLCC Market Revenue undefined Forecast, by Country 2020 & 2033
- Table 52: China Electric Vehicles MLCC Market Revenue (undefined) Forecast, by Application 2020 & 2033
- Table 53: India Electric Vehicles MLCC Market Revenue (undefined) Forecast, by Application 2020 & 2033
- Table 54: Japan Electric Vehicles MLCC Market Revenue (undefined) Forecast, by Application 2020 & 2033
- Table 55: South Korea Electric Vehicles MLCC Market Revenue (undefined) Forecast, by Application 2020 & 2033
- Table 56: ASEAN Electric Vehicles MLCC Market Revenue (undefined) Forecast, by Application 2020 & 2033
- Table 57: Oceania Electric Vehicles MLCC Market Revenue (undefined) Forecast, by Application 2020 & 2033
- Table 58: Rest of Asia Pacific Electric Vehicles MLCC Market Revenue (undefined) Forecast, by Application 2020 & 2033
Frequently Asked Questions
1. What is the projected Compound Annual Growth Rate (CAGR) of the Electric Vehicles MLCC Market?
The projected CAGR is approximately 15.2%.
2. Which companies are prominent players in the Electric Vehicles MLCC Market?
Key companies in the market include Vishay Intertechnology Inc, Kyocera AVX Components Corporation (Kyocera Corporation), Maruwa Co ltd, Samwha Capacitor Group, Walsin Technology Corporation, Samsung Electro-Mechanics, Würth Elektronik GmbH & Co KG, Yageo Corporatio, Taiyo Yuden Co Ltd, TDK Corporation, Murata Manufacturing Co Ltd, Nippon Chemi-Con Corporation.
3. What are the main segments of the Electric Vehicles MLCC Market?
The market segments include Case Size, Voltage, Capacitance, Dielectric Type.
4. Can you provide details about the market size?
The market size is estimated to be USD XXX N/A as of 2022.
5. What are some drivers contributing to market growth?
Rise in the Applications of Semiconductors; Advancement in Technology Such as Magnetron Sputtering Technology.
6. What are the notable trends driving market growth?
OTHER KEY INDUSTRY TRENDS COVERED IN THE REPORT.
7. Are there any restraints impacting market growth?
Rise of Alternative Technologies Such as Thermal Evaporation.
8. Can you provide examples of recent developments in the market?
July 2023: KEMET, part of the Yageo Corporation developed the X7R automotive grade MLCC X7R. This MLCC is designed to meet the high voltage requirements of automotive subsystems, ranging from 100pF-0.1uF and with a DC voltage range of 500V-1kV. The range of cases available is EIA 0603-1210, and is suitable for both automotive under hoods and in-cabin applications. These MLCCs demonstrate the essential and reliable nature of capacitors, which are essential for the mission and safety of automotive subsystems.June 2023: The growing demand for industrial equipments has driven the company to introduce NTS/NTF NTS/NTF Series of SMD type MLCC. These capacitors are rated with 25 to 500 Vdc with a capacitance ranging from 0.010 to 47µF. These MLCCs are used in on-board power supplies,voltage regulators for computers,smoothing circuit of DC-DC converters,etc.May 2023: Murata has introduced the EVA series of MLCC, which are beneficial to EV manufacturers due to their versatility. These MLCC's can be used in a variety of applications, including OBC (On-Board Charger), inverter and DC/DC Converter, BMS (Battery Management System), and WPT (Wireless Power Transfer) implementations. As a result, they are ideal to the increased isolation that the 800V powertrain migration will require, while also meeting the miniaturization requirements of modern automotive systems.
9. What pricing options are available for accessing the report?
Pricing options include single-user, multi-user, and enterprise licenses priced at USD 3800, USD 4500, and USD 5800 respectively.
10. Is the market size provided in terms of value or volume?
The market size is provided in terms of value, measured in N/A.
11. Are there any specific market keywords associated with the report?
Yes, the market keyword associated with the report is "Electric Vehicles MLCC Market," which aids in identifying and referencing the specific market segment covered.
12. How do I determine which pricing option suits my needs best?
The pricing options vary based on user requirements and access needs. Individual users may opt for single-user licenses, while businesses requiring broader access may choose multi-user or enterprise licenses for cost-effective access to the report.
13. Are there any additional resources or data provided in the Electric Vehicles MLCC Market report?
While the report offers comprehensive insights, it's advisable to review the specific contents or supplementary materials provided to ascertain if additional resources or data are available.
14. How can I stay updated on further developments or reports in the Electric Vehicles MLCC Market?
To stay informed about further developments, trends, and reports in the Electric Vehicles MLCC Market, consider subscribing to industry newsletters, following relevant companies and organizations, or regularly checking reputable industry news sources and publications.
Methodology
Step 1 - Identification of Relevant Samples Size from Population Database


Step 2 - Approaches for Defining Global Market Size (Value, Volume* & Price*)

Note*: In applicable scenarios
Step 3 - Data Sources
Primary Research
- Web Analytics
- Survey Reports
- Research Institute
- Latest Research Reports
- Opinion Leaders
Secondary Research
- Annual Reports
- White Paper
- Latest Press Release
- Industry Association
- Paid Database
- Investor Presentations

Step 4 - Data Triangulation
Involves using different sources of information in order to increase the validity of a study
These sources are likely to be stakeholders in a program - participants, other researchers, program staff, other community members, and so on.
Then we put all data in single framework & apply various statistical tools to find out the dynamic on the market.
During the analysis stage, feedback from the stakeholder groups would be compared to determine areas of agreement as well as areas of divergence