
Key Insights
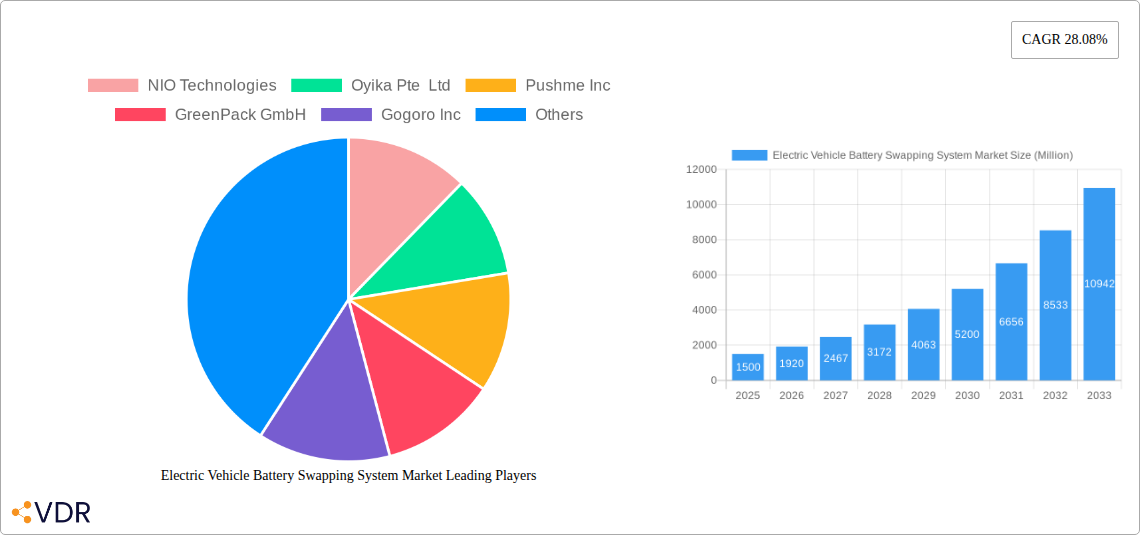
The Electric Vehicle (EV) Battery Swapping System market is experiencing rapid growth, projected to reach a substantial size with a Compound Annual Growth Rate (CAGR) of 28.08% from 2025 to 2033. This surge is driven by several key factors. Increasing demand for EVs, coupled with range anxiety and long charging times, is pushing consumers and businesses towards faster and more convenient battery swapping solutions. Government initiatives promoting sustainable transportation and investments in charging infrastructure further contribute to market expansion. The adoption of various battery types, including Lithium-ion and Lead-acid batteries, caters to diverse EV applications and price points. The market is segmented by service type, with both Pay-Per-Use and Subscription models gaining traction. The Pay-Per-Use model provides flexibility, while the Subscription model offers predictable costs. Key players like NIO Technologies, Gogoro Inc., and others are actively shaping the market landscape through technological advancements and strategic partnerships, driving innovation in battery technology, swapping station infrastructure, and overall system efficiency.
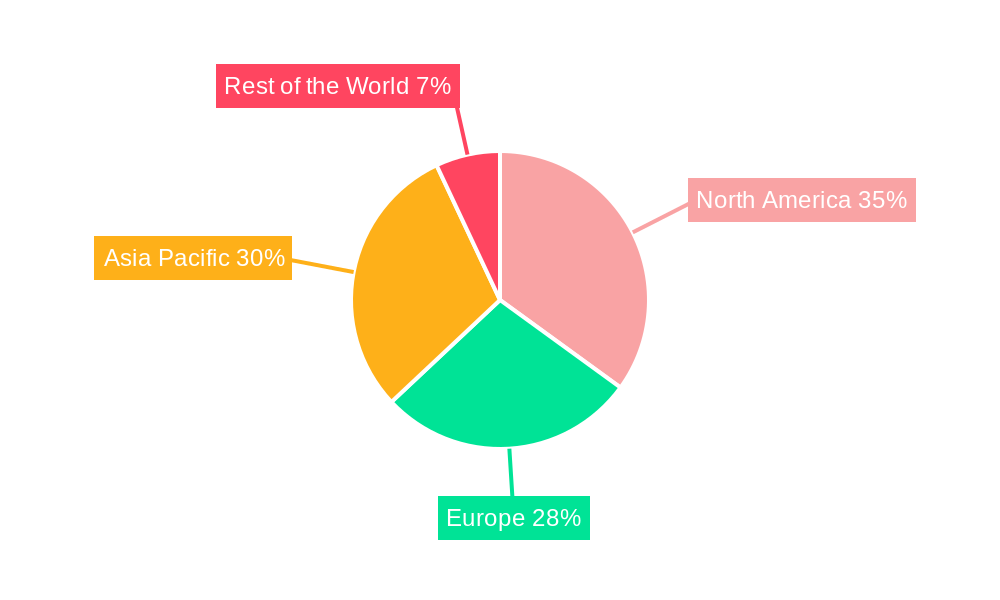
Furthermore, geographical expansion is a significant factor. Regions such as North America, particularly the United States, and Asia Pacific, especially China, are leading the market due to early adoption of EVs and supportive government policies. Europe is also witnessing strong growth, driven by stringent emission regulations and increasing EV sales. However, challenges remain, including the standardization of battery formats and the establishment of a widespread and reliable swapping network. Overcoming these hurdles will be crucial for realizing the full potential of this promising market. The ongoing technological advancements in battery technology, improving battery life, and enhancing the speed and efficiency of swapping processes will play a crucial role in shaping the future of the EV battery swapping market.
Electric Vehicle Battery Swapping System Market: A Comprehensive Report (2019-2033)
This in-depth report provides a comprehensive analysis of the Electric Vehicle (EV) Battery Swapping System market, encompassing market dynamics, growth trends, regional dominance, product landscape, key players, and future outlook. The study period covers 2019-2033, with a base year of 2025 and a forecast period of 2025-2033. This report is invaluable for industry professionals, investors, and strategists seeking to understand and capitalize on the burgeoning EV battery swapping market. The market is segmented by service type (Pay-Per-Use Model, Subscription Model) and battery type (Lithium-ion Battery, Lead-acid Battery).
Parent Market: Electric Vehicle Market (Estimated xx Million units in 2025) Child Market: EV Battery Infrastructure Market (Estimated xx Million units in 2025)
Electric Vehicle Battery Swapping System Market Dynamics & Structure
The EV battery swapping system market is characterized by a moderate level of concentration, with key players like NIO Technologies, Gogoro Inc., and BattSwap Inc. vying for market share. Technological innovation, particularly in battery technology and swapping station design, is a major driver. Government regulations promoting EV adoption and supportive infrastructure development are also significant catalysts. The market faces competition from traditional charging infrastructure, but the speed and convenience of battery swapping offer a compelling alternative. Mergers and acquisitions (M&A) activity is expected to increase as larger players seek to consolidate market share and expand their geographical reach. The historical period (2019-2024) saw a xx% CAGR, and the forecast period (2025-2033) is projected to have a xx% CAGR.
- Market Concentration: Moderately concentrated, with a few dominant players and several emerging companies.
- Technological Innovation: Rapid advancements in battery technology and swapping station automation are key drivers.
- Regulatory Framework: Government incentives and policies supporting EV adoption are crucial for market growth.
- Competitive Substitutes: Traditional charging infrastructure remains a primary competitor.
- End-User Demographics: Primarily focused on urban areas with high EV density and limited charging infrastructure.
- M&A Trends: Increased M&A activity is anticipated as companies seek expansion and consolidation. (Estimated xx M&A deals in the next 5 years).
- Innovation Barriers: High initial investment costs for infrastructure development and standardization challenges.
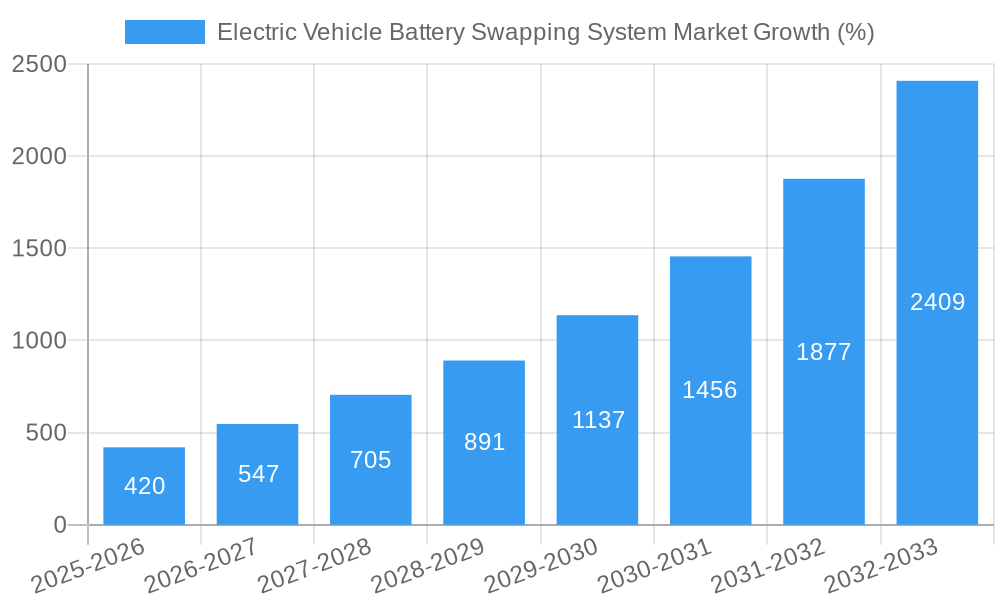
Electric Vehicle Battery Swapping System Market Growth Trends & Insights
The global EV battery swapping system market is experiencing rapid growth, driven by increasing EV adoption, limitations of traditional charging infrastructure, and the inherent advantages of battery swapping in terms of speed and convenience. Market size is expected to reach xx Million units by 2025 and xx Million units by 2033. The adoption rate is accelerating, particularly in regions with supportive government policies and dense urban populations. Technological advancements, such as the development of more efficient and durable batteries and automated swapping stations, are further fueling market expansion. Consumer behavior is shifting towards more convenient and faster charging solutions, making battery swapping an increasingly attractive option.
- Market Size Evolution: Significant growth projected throughout the forecast period (2025-2033).
- Adoption Rates: Increasing adoption driven by factors such as convenience, speed, and government incentives.
- Technological Disruptions: Innovations in battery technology and swapping station automation are transforming the market.
- Consumer Behavior Shifts: Consumers are increasingly prioritizing faster charging options.
Dominant Regions, Countries, or Segments in Electric Vehicle Battery Swapping System Market
China and other Asian countries, particularly those with robust EV adoption initiatives, are currently leading the EV battery swapping system market. The Pay-Per-Use model holds the largest market share due to its accessibility and flexibility, while the demand for Lithium-ion battery swapping systems is significantly higher due to higher energy density and longer lifespan.
- Key Drivers:
- China: Strong government support for EV adoption and significant investments in battery swapping infrastructure.
- Other Asian Countries: Growing EV adoption and increasing awareness of battery swapping technology.
- Pay-Per-Use Model: Cost-effectiveness and flexibility attract a wide range of users.
- Lithium-ion Batteries: Higher energy density and longer lifespan compared to lead-acid batteries.
- Dominance Factors: Strong government support, high EV adoption rates, and favorable geographic and demographic factors.
Electric Vehicle Battery Swapping System Market Product Landscape
The EV battery swapping system market features a range of products, from standardized battery packs designed for seamless interchangeability to automated swapping stations that minimize downtime. Key features include fast swapping times, robust safety mechanisms, and compatibility with various EV models. Technological advancements are focused on increasing efficiency, improving safety, and reducing the overall cost of the system. Unique selling propositions include speed, convenience, and reduced battery degradation compared to traditional charging.
Key Drivers, Barriers & Challenges in Electric Vehicle Battery Swapping System Market
Key Drivers: Government incentives for EV adoption, increasing EV sales, limitations of traditional charging infrastructure, and the inherent advantages of battery swapping technology.
Challenges & Restraints: High initial investment costs for infrastructure development, standardization challenges across different EV models, concerns about battery safety and standardization, and competition from traditional charging technologies.
Emerging Opportunities in Electric Vehicle Battery Swapping System Market
Emerging opportunities include expansion into new markets (particularly developing countries with growing EV adoption), development of innovative battery technologies with improved performance and lifespan, and integration of battery swapping systems into wider smart city initiatives. Tailored solutions for specific EV types and applications (e.g., commercial fleets) also represent significant opportunities.
Growth Accelerators in the Electric Vehicle Battery Swapping System Market Industry
Technological advancements in battery technology and swapping station automation will continue to be major growth catalysts. Strategic partnerships between battery manufacturers, EV makers, and infrastructure providers will accelerate market expansion. Government policies supporting battery swapping infrastructure and incentives for EV adoption will also contribute to significant growth. Expanding into new geographic markets with high EV adoption potential is crucial for long-term growth.
Key Players Shaping the Electric Vehicle Battery Swapping System Market Market
- NIO Technologies (NIO)
- Oyika Pte Ltd
- Pushme Inc
- GreenPack GmbH
- Gogoro Inc (Gogoro)
- Kwang Yang Motor Co Ltd
- BattSwap Inc
- Immotor Inc
Notable Milestones in Electric Vehicle Battery Swapping System Market Sector
- September 2022: NIO opens its first battery swap station in Germany, capable of 312 swaps per day. This demonstrates market expansion into new territories.
- September 2022: Oyika Pte Ltd and NEFIN Group sign an MOU to promote EV adoption in Southeast Asia, indicating strategic partnerships to accelerate market growth.
- January 2022: Hon Hai Technology Group (Foxconn), the Indonesian government, and Gogoro sign an MOU to develop a sustainable energy ecosystem in Indonesia, highlighting collaboration to build EV infrastructure.
In-Depth Electric Vehicle Battery Swapping System Market Market Outlook
The future of the EV battery swapping system market is bright, with significant growth potential driven by technological advancements, supportive government policies, and increasing consumer demand for convenient and fast charging solutions. Strategic partnerships and expansion into new markets will be crucial for long-term success. The market is poised for substantial expansion, and proactive companies will capture significant market share by capitalizing on these opportunities.
Electric Vehicle Battery Swapping System Market Segmentation
-
1. Service Type
- 1.1. Pay-Per-Use Model
- 1.2. Subscription Model
-
2. Battery Type
- 2.1. Lithium-ion Battery
- 2.2. Lead-acid Battery
-
3. Station Type
- 3.1. Manual
- 3.2. Automated
-
4. Battery Capacity
- 4.1. Up to 1.5 kWh
- 4.2. 1.6 to 3 kWh
- 4.3. More than 3 kWh
-
5. Two-Wheeler Type
- 5.1. E-Scooters/Mopeds
- 5.2. E-Motorcycles
Electric Vehicle Battery Swapping System Market Segmentation By Geography
-
1. North America
- 1.1. United States
- 1.2. Canada
- 1.3. Rest of North America
-
2. Europe
- 2.1. Germany
- 2.2. United Kingdom
- 2.3. France
- 2.4. Italy
- 2.5. Spain
- 2.6. Rest of Europe
-
3. Asia Pacific
- 3.1. China
- 3.2. India
- 3.3. Japan
- 3.4. South Korea
- 3.5. Rest of Asia Pacific
-
4. Rest of the World
- 4.1. South America
- 4.2. Middle East and Africa
Electric Vehicle Battery Swapping System Market REPORT HIGHLIGHTS
| Aspects | Details |
|---|---|
| Study Period | 2019-2033 |
| Base Year | 2024 |
| Estimated Year | 2025 |
| Forecast Period | 2025-2033 |
| Historical Period | 2019-2024 |
| Growth Rate | CAGR of 28.08% from 2019-2033 |
| Segmentation |
|
Table of Contents
- 1. Introduction
- 1.1. Research Scope
- 1.2. Market Segmentation
- 1.3. Research Methodology
- 1.4. Definitions and Assumptions
- 2. Executive Summary
- 2.1. Introduction
- 3. Market Dynamics
- 3.1. Introduction
- 3.2. Market Drivers
- 3.2.1. Growing Tourism Industry is Expected to Boost the Boat Rental Service Market
- 3.3. Market Restrains
- 3.3.1. Environmental Regulations and Governmental Policies May Hinder the Market Growth
- 3.4. Market Trends
- 3.4.1. Developments in Lithium Batteries Driving the Market
- 4. Market Factor Analysis
- 4.1. Porters Five Forces
- 4.2. Supply/Value Chain
- 4.3. PESTEL analysis
- 4.4. Market Entropy
- 4.5. Patent/Trademark Analysis
- 5. Global Electric Vehicle Battery Swapping System Market Analysis, Insights and Forecast, 2019-2031
- 5.1. Market Analysis, Insights and Forecast - by Service Type
- 5.1.1. Pay-Per-Use Model
- 5.1.2. Subscription Model
- 5.2. Market Analysis, Insights and Forecast - by Battery Type
- 5.2.1. Lithium-ion Battery
- 5.2.2. Lead-acid Battery
- 5.3. Market Analysis, Insights and Forecast - by Station Type
- 5.3.1. Manual
- 5.3.2. Automated
- 5.4. Market Analysis, Insights and Forecast - by Battery Capacity
- 5.4.1. Up to 1.5 kWh
- 5.4.2. 1.6 to 3 kWh
- 5.4.3. More than 3 kWh
- 5.5. Market Analysis, Insights and Forecast - by Two-Wheeler Type
- 5.5.1. E-Scooters/Mopeds
- 5.5.2. E-Motorcycles
- 5.6. Market Analysis, Insights and Forecast - by Region
- 5.6.1. North America
- 5.6.2. Europe
- 5.6.3. Asia Pacific
- 5.6.4. Rest of the World
- 5.1. Market Analysis, Insights and Forecast - by Service Type
- 6. North America Electric Vehicle Battery Swapping System Market Analysis, Insights and Forecast, 2019-2031
- 6.1. Market Analysis, Insights and Forecast - by Service Type
- 6.1.1. Pay-Per-Use Model
- 6.1.2. Subscription Model
- 6.2. Market Analysis, Insights and Forecast - by Battery Type
- 6.2.1. Lithium-ion Battery
- 6.2.2. Lead-acid Battery
- 6.3. Market Analysis, Insights and Forecast - by Station Type
- 6.3.1. Manual
- 6.3.2. Automated
- 6.4. Market Analysis, Insights and Forecast - by Battery Capacity
- 6.4.1. Up to 1.5 kWh
- 6.4.2. 1.6 to 3 kWh
- 6.4.3. More than 3 kWh
- 6.5. Market Analysis, Insights and Forecast - by Two-Wheeler Type
- 6.5.1. E-Scooters/Mopeds
- 6.5.2. E-Motorcycles
- 6.1. Market Analysis, Insights and Forecast - by Service Type
- 7. Europe Electric Vehicle Battery Swapping System Market Analysis, Insights and Forecast, 2019-2031
- 7.1. Market Analysis, Insights and Forecast - by Service Type
- 7.1.1. Pay-Per-Use Model
- 7.1.2. Subscription Model
- 7.2. Market Analysis, Insights and Forecast - by Battery Type
- 7.2.1. Lithium-ion Battery
- 7.2.2. Lead-acid Battery
- 7.3. Market Analysis, Insights and Forecast - by Station Type
- 7.3.1. Manual
- 7.3.2. Automated
- 7.4. Market Analysis, Insights and Forecast - by Battery Capacity
- 7.4.1. Up to 1.5 kWh
- 7.4.2. 1.6 to 3 kWh
- 7.4.3. More than 3 kWh
- 7.5. Market Analysis, Insights and Forecast - by Two-Wheeler Type
- 7.5.1. E-Scooters/Mopeds
- 7.5.2. E-Motorcycles
- 7.1. Market Analysis, Insights and Forecast - by Service Type
- 8. Asia Pacific Electric Vehicle Battery Swapping System Market Analysis, Insights and Forecast, 2019-2031
- 8.1. Market Analysis, Insights and Forecast - by Service Type
- 8.1.1. Pay-Per-Use Model
- 8.1.2. Subscription Model
- 8.2. Market Analysis, Insights and Forecast - by Battery Type
- 8.2.1. Lithium-ion Battery
- 8.2.2. Lead-acid Battery
- 8.3. Market Analysis, Insights and Forecast - by Station Type
- 8.3.1. Manual
- 8.3.2. Automated
- 8.4. Market Analysis, Insights and Forecast - by Battery Capacity
- 8.4.1. Up to 1.5 kWh
- 8.4.2. 1.6 to 3 kWh
- 8.4.3. More than 3 kWh
- 8.5. Market Analysis, Insights and Forecast - by Two-Wheeler Type
- 8.5.1. E-Scooters/Mopeds
- 8.5.2. E-Motorcycles
- 8.1. Market Analysis, Insights and Forecast - by Service Type
- 9. Rest of the World Electric Vehicle Battery Swapping System Market Analysis, Insights and Forecast, 2019-2031
- 9.1. Market Analysis, Insights and Forecast - by Service Type
- 9.1.1. Pay-Per-Use Model
- 9.1.2. Subscription Model
- 9.2. Market Analysis, Insights and Forecast - by Battery Type
- 9.2.1. Lithium-ion Battery
- 9.2.2. Lead-acid Battery
- 9.3. Market Analysis, Insights and Forecast - by Station Type
- 9.3.1. Manual
- 9.3.2. Automated
- 9.4. Market Analysis, Insights and Forecast - by Battery Capacity
- 9.4.1. Up to 1.5 kWh
- 9.4.2. 1.6 to 3 kWh
- 9.4.3. More than 3 kWh
- 9.5. Market Analysis, Insights and Forecast - by Two-Wheeler Type
- 9.5.1. E-Scooters/Mopeds
- 9.5.2. E-Motorcycles
- 9.1. Market Analysis, Insights and Forecast - by Service Type
- 10. North America Electric Vehicle Battery Swapping System Market Analysis, Insights and Forecast, 2019-2031
- 10.1. Market Analysis, Insights and Forecast - By Country/Sub-region
- 10.1.1 United States
- 10.1.2 Canada
- 10.1.3 Rest of North America
- 11. Europe Electric Vehicle Battery Swapping System Market Analysis, Insights and Forecast, 2019-2031
- 11.1. Market Analysis, Insights and Forecast - By Country/Sub-region
- 11.1.1 Germany
- 11.1.2 United Kingdom
- 11.1.3 France
- 11.1.4 Italy
- 11.1.5 Rest of Europe
- 12. Asia Pacific Electric Vehicle Battery Swapping System Market Analysis, Insights and Forecast, 2019-2031
- 12.1. Market Analysis, Insights and Forecast - By Country/Sub-region
- 12.1.1 China
- 12.1.2 India
- 12.1.3 Japan
- 12.1.4 South Korea
- 12.1.5 Rest of Asia Pacific
- 13. Rest of the World Electric Vehicle Battery Swapping System Market Analysis, Insights and Forecast, 2019-2031
- 13.1. Market Analysis, Insights and Forecast - By Country/Sub-region
- 13.1.1 South America
- 13.1.2 Middle East and Africa
- 14. Competitive Analysis
- 14.1. Global Market Share Analysis 2024
- 14.2. Company Profiles
- 14.2.1 NIO Technologies
- 14.2.1.1. Overview
- 14.2.1.2. Products
- 14.2.1.3. SWOT Analysis
- 14.2.1.4. Recent Developments
- 14.2.1.5. Financials (Based on Availability)
- 14.2.2 Oyika Pte Ltd
- 14.2.2.1. Overview
- 14.2.2.2. Products
- 14.2.2.3. SWOT Analysis
- 14.2.2.4. Recent Developments
- 14.2.2.5. Financials (Based on Availability)
- 14.2.3 Pushme Inc
- 14.2.3.1. Overview
- 14.2.3.2. Products
- 14.2.3.3. SWOT Analysis
- 14.2.3.4. Recent Developments
- 14.2.3.5. Financials (Based on Availability)
- 14.2.4 GreenPack GmbH
- 14.2.4.1. Overview
- 14.2.4.2. Products
- 14.2.4.3. SWOT Analysis
- 14.2.4.4. Recent Developments
- 14.2.4.5. Financials (Based on Availability)
- 14.2.5 Gogoro Inc
- 14.2.5.1. Overview
- 14.2.5.2. Products
- 14.2.5.3. SWOT Analysis
- 14.2.5.4. Recent Developments
- 14.2.5.5. Financials (Based on Availability)
- 14.2.6 Kwang Yang Motor Co Ltd *List Not Exhaustive
- 14.2.6.1. Overview
- 14.2.6.2. Products
- 14.2.6.3. SWOT Analysis
- 14.2.6.4. Recent Developments
- 14.2.6.5. Financials (Based on Availability)
- 14.2.7 BattSwap Inc
- 14.2.7.1. Overview
- 14.2.7.2. Products
- 14.2.7.3. SWOT Analysis
- 14.2.7.4. Recent Developments
- 14.2.7.5. Financials (Based on Availability)
- 14.2.8 Immotor Inc
- 14.2.8.1. Overview
- 14.2.8.2. Products
- 14.2.8.3. SWOT Analysis
- 14.2.8.4. Recent Developments
- 14.2.8.5. Financials (Based on Availability)
- 14.2.1 NIO Technologies
List of Figures
- Figure 1: Global Electric Vehicle Battery Swapping System Market Revenue Breakdown (Million, %) by Region 2024 & 2032
- Figure 2: North America Electric Vehicle Battery Swapping System Market Revenue (Million), by Country 2024 & 2032
- Figure 3: North America Electric Vehicle Battery Swapping System Market Revenue Share (%), by Country 2024 & 2032
- Figure 4: Europe Electric Vehicle Battery Swapping System Market Revenue (Million), by Country 2024 & 2032
- Figure 5: Europe Electric Vehicle Battery Swapping System Market Revenue Share (%), by Country 2024 & 2032
- Figure 6: Asia Pacific Electric Vehicle Battery Swapping System Market Revenue (Million), by Country 2024 & 2032
- Figure 7: Asia Pacific Electric Vehicle Battery Swapping System Market Revenue Share (%), by Country 2024 & 2032
- Figure 8: Rest of the World Electric Vehicle Battery Swapping System Market Revenue (Million), by Country 2024 & 2032
- Figure 9: Rest of the World Electric Vehicle Battery Swapping System Market Revenue Share (%), by Country 2024 & 2032
- Figure 10: North America Electric Vehicle Battery Swapping System Market Revenue (Million), by Service Type 2024 & 2032
- Figure 11: North America Electric Vehicle Battery Swapping System Market Revenue Share (%), by Service Type 2024 & 2032
- Figure 12: North America Electric Vehicle Battery Swapping System Market Revenue (Million), by Battery Type 2024 & 2032
- Figure 13: North America Electric Vehicle Battery Swapping System Market Revenue Share (%), by Battery Type 2024 & 2032
- Figure 14: North America Electric Vehicle Battery Swapping System Market Revenue (Million), by Station Type 2024 & 2032
- Figure 15: North America Electric Vehicle Battery Swapping System Market Revenue Share (%), by Station Type 2024 & 2032
- Figure 16: North America Electric Vehicle Battery Swapping System Market Revenue (Million), by Battery Capacity 2024 & 2032
- Figure 17: North America Electric Vehicle Battery Swapping System Market Revenue Share (%), by Battery Capacity 2024 & 2032
- Figure 18: North America Electric Vehicle Battery Swapping System Market Revenue (Million), by Two-Wheeler Type 2024 & 2032
- Figure 19: North America Electric Vehicle Battery Swapping System Market Revenue Share (%), by Two-Wheeler Type 2024 & 2032
- Figure 20: North America Electric Vehicle Battery Swapping System Market Revenue (Million), by Country 2024 & 2032
- Figure 21: North America Electric Vehicle Battery Swapping System Market Revenue Share (%), by Country 2024 & 2032
- Figure 22: Europe Electric Vehicle Battery Swapping System Market Revenue (Million), by Service Type 2024 & 2032
- Figure 23: Europe Electric Vehicle Battery Swapping System Market Revenue Share (%), by Service Type 2024 & 2032
- Figure 24: Europe Electric Vehicle Battery Swapping System Market Revenue (Million), by Battery Type 2024 & 2032
- Figure 25: Europe Electric Vehicle Battery Swapping System Market Revenue Share (%), by Battery Type 2024 & 2032
- Figure 26: Europe Electric Vehicle Battery Swapping System Market Revenue (Million), by Station Type 2024 & 2032
- Figure 27: Europe Electric Vehicle Battery Swapping System Market Revenue Share (%), by Station Type 2024 & 2032
- Figure 28: Europe Electric Vehicle Battery Swapping System Market Revenue (Million), by Battery Capacity 2024 & 2032
- Figure 29: Europe Electric Vehicle Battery Swapping System Market Revenue Share (%), by Battery Capacity 2024 & 2032
- Figure 30: Europe Electric Vehicle Battery Swapping System Market Revenue (Million), by Two-Wheeler Type 2024 & 2032
- Figure 31: Europe Electric Vehicle Battery Swapping System Market Revenue Share (%), by Two-Wheeler Type 2024 & 2032
- Figure 32: Europe Electric Vehicle Battery Swapping System Market Revenue (Million), by Country 2024 & 2032
- Figure 33: Europe Electric Vehicle Battery Swapping System Market Revenue Share (%), by Country 2024 & 2032
- Figure 34: Asia Pacific Electric Vehicle Battery Swapping System Market Revenue (Million), by Service Type 2024 & 2032
- Figure 35: Asia Pacific Electric Vehicle Battery Swapping System Market Revenue Share (%), by Service Type 2024 & 2032
- Figure 36: Asia Pacific Electric Vehicle Battery Swapping System Market Revenue (Million), by Battery Type 2024 & 2032
- Figure 37: Asia Pacific Electric Vehicle Battery Swapping System Market Revenue Share (%), by Battery Type 2024 & 2032
- Figure 38: Asia Pacific Electric Vehicle Battery Swapping System Market Revenue (Million), by Station Type 2024 & 2032
- Figure 39: Asia Pacific Electric Vehicle Battery Swapping System Market Revenue Share (%), by Station Type 2024 & 2032
- Figure 40: Asia Pacific Electric Vehicle Battery Swapping System Market Revenue (Million), by Battery Capacity 2024 & 2032
- Figure 41: Asia Pacific Electric Vehicle Battery Swapping System Market Revenue Share (%), by Battery Capacity 2024 & 2032
- Figure 42: Asia Pacific Electric Vehicle Battery Swapping System Market Revenue (Million), by Two-Wheeler Type 2024 & 2032
- Figure 43: Asia Pacific Electric Vehicle Battery Swapping System Market Revenue Share (%), by Two-Wheeler Type 2024 & 2032
- Figure 44: Asia Pacific Electric Vehicle Battery Swapping System Market Revenue (Million), by Country 2024 & 2032
- Figure 45: Asia Pacific Electric Vehicle Battery Swapping System Market Revenue Share (%), by Country 2024 & 2032
- Figure 46: Rest of the World Electric Vehicle Battery Swapping System Market Revenue (Million), by Service Type 2024 & 2032
- Figure 47: Rest of the World Electric Vehicle Battery Swapping System Market Revenue Share (%), by Service Type 2024 & 2032
- Figure 48: Rest of the World Electric Vehicle Battery Swapping System Market Revenue (Million), by Battery Type 2024 & 2032
- Figure 49: Rest of the World Electric Vehicle Battery Swapping System Market Revenue Share (%), by Battery Type 2024 & 2032
- Figure 50: Rest of the World Electric Vehicle Battery Swapping System Market Revenue (Million), by Station Type 2024 & 2032
- Figure 51: Rest of the World Electric Vehicle Battery Swapping System Market Revenue Share (%), by Station Type 2024 & 2032
- Figure 52: Rest of the World Electric Vehicle Battery Swapping System Market Revenue (Million), by Battery Capacity 2024 & 2032
- Figure 53: Rest of the World Electric Vehicle Battery Swapping System Market Revenue Share (%), by Battery Capacity 2024 & 2032
- Figure 54: Rest of the World Electric Vehicle Battery Swapping System Market Revenue (Million), by Two-Wheeler Type 2024 & 2032
- Figure 55: Rest of the World Electric Vehicle Battery Swapping System Market Revenue Share (%), by Two-Wheeler Type 2024 & 2032
- Figure 56: Rest of the World Electric Vehicle Battery Swapping System Market Revenue (Million), by Country 2024 & 2032
- Figure 57: Rest of the World Electric Vehicle Battery Swapping System Market Revenue Share (%), by Country 2024 & 2032
List of Tables
- Table 1: Global Electric Vehicle Battery Swapping System Market Revenue Million Forecast, by Region 2019 & 2032
- Table 2: Global Electric Vehicle Battery Swapping System Market Revenue Million Forecast, by Service Type 2019 & 2032
- Table 3: Global Electric Vehicle Battery Swapping System Market Revenue Million Forecast, by Battery Type 2019 & 2032
- Table 4: Global Electric Vehicle Battery Swapping System Market Revenue Million Forecast, by Station Type 2019 & 2032
- Table 5: Global Electric Vehicle Battery Swapping System Market Revenue Million Forecast, by Battery Capacity 2019 & 2032
- Table 6: Global Electric Vehicle Battery Swapping System Market Revenue Million Forecast, by Two-Wheeler Type 2019 & 2032
- Table 7: Global Electric Vehicle Battery Swapping System Market Revenue Million Forecast, by Region 2019 & 2032
- Table 8: Global Electric Vehicle Battery Swapping System Market Revenue Million Forecast, by Country 2019 & 2032
- Table 9: United States Electric Vehicle Battery Swapping System Market Revenue (Million) Forecast, by Application 2019 & 2032
- Table 10: Canada Electric Vehicle Battery Swapping System Market Revenue (Million) Forecast, by Application 2019 & 2032
- Table 11: Rest of North America Electric Vehicle Battery Swapping System Market Revenue (Million) Forecast, by Application 2019 & 2032
- Table 12: Global Electric Vehicle Battery Swapping System Market Revenue Million Forecast, by Country 2019 & 2032
- Table 13: Germany Electric Vehicle Battery Swapping System Market Revenue (Million) Forecast, by Application 2019 & 2032
- Table 14: United Kingdom Electric Vehicle Battery Swapping System Market Revenue (Million) Forecast, by Application 2019 & 2032
- Table 15: France Electric Vehicle Battery Swapping System Market Revenue (Million) Forecast, by Application 2019 & 2032
- Table 16: Italy Electric Vehicle Battery Swapping System Market Revenue (Million) Forecast, by Application 2019 & 2032
- Table 17: Rest of Europe Electric Vehicle Battery Swapping System Market Revenue (Million) Forecast, by Application 2019 & 2032
- Table 18: Global Electric Vehicle Battery Swapping System Market Revenue Million Forecast, by Country 2019 & 2032
- Table 19: China Electric Vehicle Battery Swapping System Market Revenue (Million) Forecast, by Application 2019 & 2032
- Table 20: India Electric Vehicle Battery Swapping System Market Revenue (Million) Forecast, by Application 2019 & 2032
- Table 21: Japan Electric Vehicle Battery Swapping System Market Revenue (Million) Forecast, by Application 2019 & 2032
- Table 22: South Korea Electric Vehicle Battery Swapping System Market Revenue (Million) Forecast, by Application 2019 & 2032
- Table 23: Rest of Asia Pacific Electric Vehicle Battery Swapping System Market Revenue (Million) Forecast, by Application 2019 & 2032
- Table 24: Global Electric Vehicle Battery Swapping System Market Revenue Million Forecast, by Country 2019 & 2032
- Table 25: South America Electric Vehicle Battery Swapping System Market Revenue (Million) Forecast, by Application 2019 & 2032
- Table 26: Middle East and Africa Electric Vehicle Battery Swapping System Market Revenue (Million) Forecast, by Application 2019 & 2032
- Table 27: Global Electric Vehicle Battery Swapping System Market Revenue Million Forecast, by Service Type 2019 & 2032
- Table 28: Global Electric Vehicle Battery Swapping System Market Revenue Million Forecast, by Battery Type 2019 & 2032
- Table 29: Global Electric Vehicle Battery Swapping System Market Revenue Million Forecast, by Station Type 2019 & 2032
- Table 30: Global Electric Vehicle Battery Swapping System Market Revenue Million Forecast, by Battery Capacity 2019 & 2032
- Table 31: Global Electric Vehicle Battery Swapping System Market Revenue Million Forecast, by Two-Wheeler Type 2019 & 2032
- Table 32: Global Electric Vehicle Battery Swapping System Market Revenue Million Forecast, by Country 2019 & 2032
- Table 33: United States Electric Vehicle Battery Swapping System Market Revenue (Million) Forecast, by Application 2019 & 2032
- Table 34: Canada Electric Vehicle Battery Swapping System Market Revenue (Million) Forecast, by Application 2019 & 2032
- Table 35: Rest of North America Electric Vehicle Battery Swapping System Market Revenue (Million) Forecast, by Application 2019 & 2032
- Table 36: Global Electric Vehicle Battery Swapping System Market Revenue Million Forecast, by Service Type 2019 & 2032
- Table 37: Global Electric Vehicle Battery Swapping System Market Revenue Million Forecast, by Battery Type 2019 & 2032
- Table 38: Global Electric Vehicle Battery Swapping System Market Revenue Million Forecast, by Station Type 2019 & 2032
- Table 39: Global Electric Vehicle Battery Swapping System Market Revenue Million Forecast, by Battery Capacity 2019 & 2032
- Table 40: Global Electric Vehicle Battery Swapping System Market Revenue Million Forecast, by Two-Wheeler Type 2019 & 2032
- Table 41: Global Electric Vehicle Battery Swapping System Market Revenue Million Forecast, by Country 2019 & 2032
- Table 42: Germany Electric Vehicle Battery Swapping System Market Revenue (Million) Forecast, by Application 2019 & 2032
- Table 43: United Kingdom Electric Vehicle Battery Swapping System Market Revenue (Million) Forecast, by Application 2019 & 2032
- Table 44: France Electric Vehicle Battery Swapping System Market Revenue (Million) Forecast, by Application 2019 & 2032
- Table 45: Italy Electric Vehicle Battery Swapping System Market Revenue (Million) Forecast, by Application 2019 & 2032
- Table 46: Spain Electric Vehicle Battery Swapping System Market Revenue (Million) Forecast, by Application 2019 & 2032
- Table 47: Rest of Europe Electric Vehicle Battery Swapping System Market Revenue (Million) Forecast, by Application 2019 & 2032
- Table 48: Global Electric Vehicle Battery Swapping System Market Revenue Million Forecast, by Service Type 2019 & 2032
- Table 49: Global Electric Vehicle Battery Swapping System Market Revenue Million Forecast, by Battery Type 2019 & 2032
- Table 50: Global Electric Vehicle Battery Swapping System Market Revenue Million Forecast, by Station Type 2019 & 2032
- Table 51: Global Electric Vehicle Battery Swapping System Market Revenue Million Forecast, by Battery Capacity 2019 & 2032
- Table 52: Global Electric Vehicle Battery Swapping System Market Revenue Million Forecast, by Two-Wheeler Type 2019 & 2032
- Table 53: Global Electric Vehicle Battery Swapping System Market Revenue Million Forecast, by Country 2019 & 2032
- Table 54: China Electric Vehicle Battery Swapping System Market Revenue (Million) Forecast, by Application 2019 & 2032
- Table 55: India Electric Vehicle Battery Swapping System Market Revenue (Million) Forecast, by Application 2019 & 2032
- Table 56: Japan Electric Vehicle Battery Swapping System Market Revenue (Million) Forecast, by Application 2019 & 2032
- Table 57: South Korea Electric Vehicle Battery Swapping System Market Revenue (Million) Forecast, by Application 2019 & 2032
- Table 58: Rest of Asia Pacific Electric Vehicle Battery Swapping System Market Revenue (Million) Forecast, by Application 2019 & 2032
- Table 59: Global Electric Vehicle Battery Swapping System Market Revenue Million Forecast, by Service Type 2019 & 2032
- Table 60: Global Electric Vehicle Battery Swapping System Market Revenue Million Forecast, by Battery Type 2019 & 2032
- Table 61: Global Electric Vehicle Battery Swapping System Market Revenue Million Forecast, by Station Type 2019 & 2032
- Table 62: Global Electric Vehicle Battery Swapping System Market Revenue Million Forecast, by Battery Capacity 2019 & 2032
- Table 63: Global Electric Vehicle Battery Swapping System Market Revenue Million Forecast, by Two-Wheeler Type 2019 & 2032
- Table 64: Global Electric Vehicle Battery Swapping System Market Revenue Million Forecast, by Country 2019 & 2032
- Table 65: South America Electric Vehicle Battery Swapping System Market Revenue (Million) Forecast, by Application 2019 & 2032
- Table 66: Middle East and Africa Electric Vehicle Battery Swapping System Market Revenue (Million) Forecast, by Application 2019 & 2032
Frequently Asked Questions
1. What is the projected Compound Annual Growth Rate (CAGR) of the Electric Vehicle Battery Swapping System Market?
The projected CAGR is approximately 28.08%.
2. Which companies are prominent players in the Electric Vehicle Battery Swapping System Market?
Key companies in the market include NIO Technologies, Oyika Pte Ltd, Pushme Inc, GreenPack GmbH, Gogoro Inc, Kwang Yang Motor Co Ltd *List Not Exhaustive, BattSwap Inc, Immotor Inc.
3. What are the main segments of the Electric Vehicle Battery Swapping System Market?
The market segments include Service Type, Battery Type, Station Type, Battery Capacity, Two-Wheeler Type.
4. Can you provide details about the market size?
The market size is estimated to be USD XX Million as of 2022.
5. What are some drivers contributing to market growth?
Growing Tourism Industry is Expected to Boost the Boat Rental Service Market.
6. What are the notable trends driving market growth?
Developments in Lithium Batteries Driving the Market.
7. Are there any restraints impacting market growth?
Environmental Regulations and Governmental Policies May Hinder the Market Growth.
8. Can you provide examples of recent developments in the market?
In September 2022, NIO announced the official opening of its first battery swap station in Germany in Zusmarshausen, which is situated along the busy A8 highway between Munich and Stuttgart. Each day, the battery swap station can perform up to 312 power conversions. The vehicle's electric control system, motor, and the battery will all be thoroughly examined prior to each swap to ensure that they are in working order.
9. What pricing options are available for accessing the report?
Pricing options include single-user, multi-user, and enterprise licenses priced at USD 4750, USD 5250, and USD 8750 respectively.
10. Is the market size provided in terms of value or volume?
The market size is provided in terms of value, measured in Million.
11. Are there any specific market keywords associated with the report?
Yes, the market keyword associated with the report is "Electric Vehicle Battery Swapping System Market," which aids in identifying and referencing the specific market segment covered.
12. How do I determine which pricing option suits my needs best?
The pricing options vary based on user requirements and access needs. Individual users may opt for single-user licenses, while businesses requiring broader access may choose multi-user or enterprise licenses for cost-effective access to the report.
13. Are there any additional resources or data provided in the Electric Vehicle Battery Swapping System Market report?
While the report offers comprehensive insights, it's advisable to review the specific contents or supplementary materials provided to ascertain if additional resources or data are available.
14. How can I stay updated on further developments or reports in the Electric Vehicle Battery Swapping System Market?
To stay informed about further developments, trends, and reports in the Electric Vehicle Battery Swapping System Market, consider subscribing to industry newsletters, following relevant companies and organizations, or regularly checking reputable industry news sources and publications.
Methodology
Step 1 - Identification of Relevant Samples Size from Population Database


Step 2 - Approaches for Defining Global Market Size (Value, Volume* & Price*)

Note*: In applicable scenarios
Step 3 - Data Sources
Primary Research
- Web Analytics
- Survey Reports
- Research Institute
- Latest Research Reports
- Opinion Leaders
Secondary Research
- Annual Reports
- White Paper
- Latest Press Release
- Industry Association
- Paid Database
- Investor Presentations

Step 4 - Data Triangulation
Involves using different sources of information in order to increase the validity of a study
These sources are likely to be stakeholders in a program - participants, other researchers, program staff, other community members, and so on.
Then we put all data in single framework & apply various statistical tools to find out the dynamic on the market.
During the analysis stage, feedback from the stakeholder groups would be compared to determine areas of agreement as well as areas of divergence


