
Key Insights
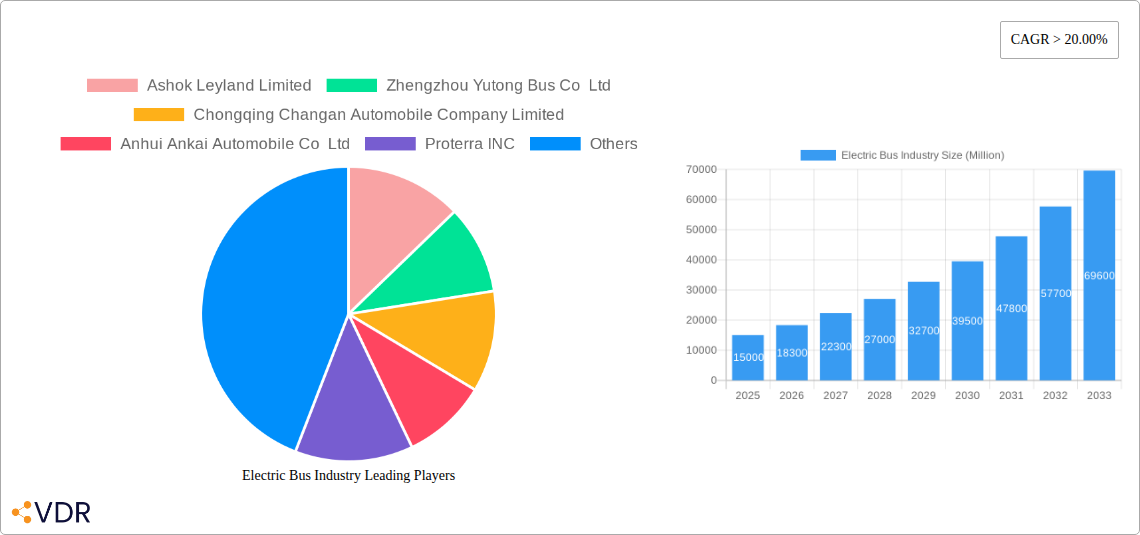
The electric bus market is experiencing robust growth, driven by stringent emission regulations, increasing environmental awareness, and government incentives promoting sustainable transportation. A compound annual growth rate (CAGR) exceeding 20% indicates a significant expansion, transforming the public transportation landscape. The market size in 2025 is estimated at $15 billion, considering the global nature of the industry and the stated CAGR. This growth is fueled by technological advancements leading to improved battery performance, extended range, and reduced charging times. Furthermore, the decreasing cost of battery packs and the increasing availability of charging infrastructure are contributing to the wider adoption of electric buses. The diverse range of electric bus types, including battery electric vehicles (BEVs), fuel cell electric vehicles (FCEVs), hybrid electric vehicles (HEVs), and plug-in hybrid electric vehicles (PHEVs), caters to various operational requirements and preferences. Major players like BYD, Ashok Leyland, and Daimler are actively shaping the market through innovation and strategic partnerships, further accelerating the transition to sustainable public transport.
Key market segments are experiencing different growth trajectories. While BEVs are currently dominating the market due to their mature technology and cost-effectiveness, FCEVs are expected to gain significant traction in the coming years, particularly in applications requiring longer ranges. The market is also geographically diverse, with regions like North America, Europe, and China witnessing substantial growth, driven by varying government policies and market conditions. However, challenges remain, including the high initial investment costs associated with electric bus fleets and the need for widespread development of charging infrastructure to support large-scale adoption. Despite these challenges, the long-term outlook for the electric bus market remains exceptionally positive, propelled by continuous technological advancements, supportive government policies, and a growing global commitment to reducing carbon emissions.
Electric Bus Industry Market Report: 2019-2033
This comprehensive report provides an in-depth analysis of the global electric bus industry, encompassing market dynamics, growth trends, regional dominance, product landscape, key players, and future outlook. The study period covers 2019-2033, with a focus on the forecast period 2025-2033 and a base year of 2025. The report is crucial for industry professionals, investors, and policymakers seeking a clear understanding of this rapidly evolving sector. The report projects xx Million units market size for 2025 and xx Million units for 2033.
Electric Bus Industry Market Dynamics & Structure
This section analyzes the electric bus market's competitive landscape, technological advancements, regulatory environment, and market trends. The industry is characterized by a mix of established automotive manufacturers and specialized electric vehicle companies, leading to a moderately fragmented market. Market concentration is analyzed by examining market share held by top players.
- Market Concentration: The global electric bus market shows a moderately concentrated structure with the top 5 players holding approximately xx% of the market share in 2025. This concentration is expected to xx% by 2033 due to consolidation and increased market share of leading players.
- Technological Innovation: Ongoing advancements in battery technology (e.g., increased energy density, faster charging), charging infrastructure, and electric motor efficiency are key drivers. Innovation barriers include high initial investment costs for R&D and the need for robust charging infrastructure.
- Regulatory Frameworks: Government regulations and subsidies play a vital role in driving electric bus adoption. Stringent emission standards and supportive policies in several countries are accelerating market growth.
- Competitive Product Substitutes: Traditional diesel and CNG buses remain primary competitors. However, increasing environmental concerns and economic advantages of electric buses are gradually shifting market share.
- End-User Demographics: The primary end-users are public transportation authorities, private fleet operators, and educational institutions. Growth is driven by increasing urbanization and the need for sustainable transportation solutions.
- M&A Trends: The electric bus sector has witnessed several mergers and acquisitions (M&As) in recent years, particularly amongst charging infrastructure providers and smaller electric bus manufacturers aiming to achieve scale. The number of deals are estimated at xx in 2024.
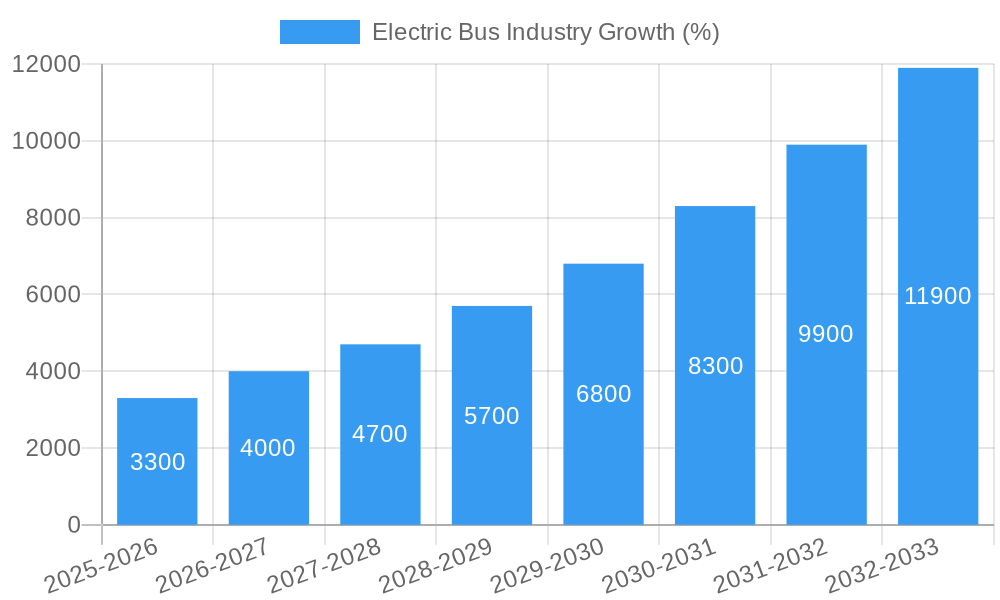
Electric Bus Industry Growth Trends & Insights
This section details the evolution of the electric bus market, analyzing market size, adoption rates, technological disruptions, and changing consumer behavior. Utilizing both primary and secondary data analysis, we provide a comprehensive overview of industry growth trajectories. The global electric bus market has experienced substantial growth over the past few years and is projected to maintain a healthy CAGR of xx% during the forecast period (2025-2033). This growth is fueled by several factors, including:
- Increasing environmental awareness and government regulations promoting sustainable transportation.
- Decreasing battery costs and improved battery technology.
- Development of advanced charging infrastructure.
- Growing demand for efficient and reliable public transportation systems in urban areas.
- Incentives and subsidies offered by governments globally.
The market penetration rate of electric buses is expected to reach xx% by 2033, representing significant market expansion. Technological advancements such as fast-charging capabilities, improved battery life, and autonomous driving features further contribute to market growth. Consumer preferences are increasingly shifting towards environmentally friendly transportation options.
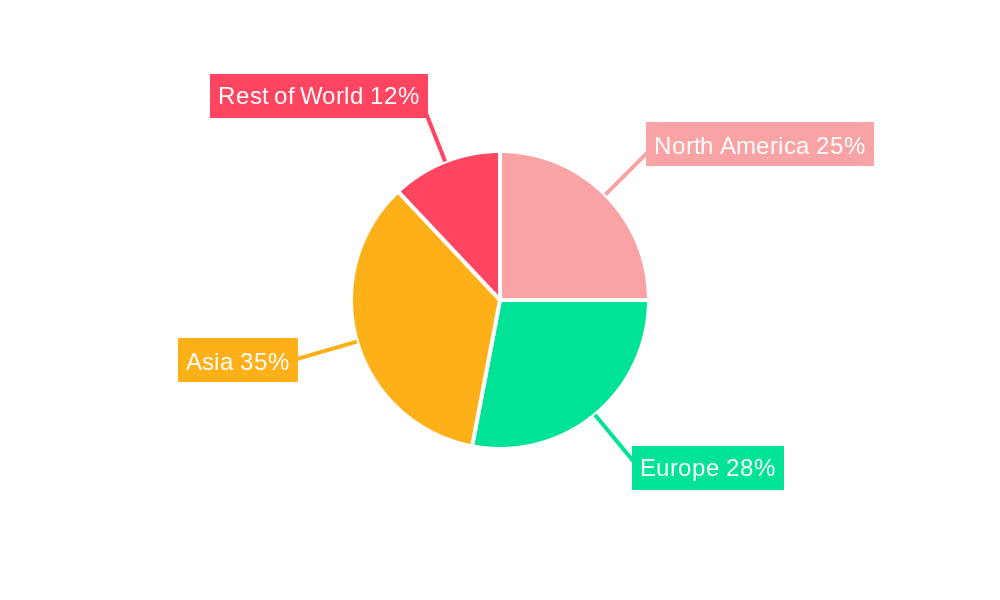
Dominant Regions, Countries, or Segments in Electric Bus Industry
This section identifies the leading regions, countries, and segments (BEV, FCEV, HEV, PHEV) in the electric bus industry. China currently holds the largest market share, driven by strong government support, a large domestic market, and a robust manufacturing base. Other key regions include Europe and North America.
- China: Dominance is attributed to strong government policies promoting electric vehicle adoption, substantial investments in charging infrastructure, and a large and growing public transportation sector.
- Europe: Stringent emission regulations, supportive government incentives, and increasing environmental awareness are driving growth.
- North America: Market expansion is driven by growing demand in urban areas, investments in public transportation infrastructure, and an increasing focus on reducing greenhouse gas emissions.
Fuel Category Dominance: Battery Electric Vehicles (BEVs) currently dominate the electric bus market, accounting for xx% of the market share in 2025. This is expected to increase to xx% by 2033. While FCEVs and PHEVs offer potential advantages, BEVs benefit from established technology and lower initial costs. HEVs represent a smaller segment, primarily used as a transitional technology.
Electric Bus Industry Product Landscape
The electric bus market features a diverse range of products with varying capacities, ranges, and functionalities. Key product innovations include advancements in battery technology, resulting in increased range and faster charging times. Improved thermal management systems enhance battery lifespan and performance. Advanced driver-assistance systems (ADAS) and autonomous driving features are increasingly being integrated into electric buses. Unique selling propositions include reduced operating costs compared to traditional buses, zero tailpipe emissions, and improved passenger comfort.
Key Drivers, Barriers & Challenges in Electric Bus Industry
Key Drivers:
- Stringent emission regulations: Governments worldwide are implementing stricter emission standards, making electric buses a more attractive option.
- Government subsidies and incentives: Financial support significantly reduces the initial cost of purchasing and operating electric buses.
- Falling battery prices: The decreasing cost of batteries makes electric buses more economically viable.
- Technological advancements: Innovations in battery technology, charging infrastructure, and vehicle design are improving the performance and efficiency of electric buses.
Challenges & Restraints:
- High initial investment costs: The upfront cost of electric buses remains a significant barrier for many operators.
- Limited charging infrastructure: The lack of widespread charging infrastructure restricts the operational range and efficiency of electric buses.
- Range anxiety: Concerns about the limited range of electric buses compared to diesel buses need to be addressed.
- Battery lifespan and replacement costs: The lifespan of electric bus batteries and the associated replacement costs pose challenges.
- Supply chain disruptions: The global supply chain disruptions negatively impacted the timely delivery of components for electric bus production, resulting in xx% delays in 2024.
Emerging Opportunities in Electric Bus Industry
- Growth in developing economies: Rapid urbanization and increasing demand for public transport in developing countries present significant opportunities.
- Integration of smart technologies: The integration of IoT and AI technologies can optimize operations and improve efficiency.
- Development of specialized electric buses: Demand is growing for electric buses tailored to specific applications, such as school buses or airport shuttle buses.
Growth Accelerators in the Electric Bus Industry
Long-term growth will be driven by continued technological advancements, particularly in battery technology and charging infrastructure. Strategic partnerships between manufacturers, charging infrastructure providers, and government agencies will play a crucial role in accelerating market expansion. Expansion into new markets, including developing countries, and the development of new applications for electric buses will also contribute to sustained growth.
Key Players Shaping the Electric Bus Industry Market
- Ashok Leyland Limited
- Zhengzhou Yutong Bus Co Ltd
- Chongqing Changan Automobile Company Limited
- Anhui Ankai Automobile Co Ltd
- Proterra INC
- Tata Motors Limited
- Daimler Truck Holding AG
- Volvo Group
- Zhejiang Geely Holding Group Co Ltd
- CRRC Electric Vehicle Co Ltd
- NFI Group Inc
- King Long United Automotive Industry Co Ltd
- Byd Auto Industry Company Limited
- Zhongtong Bus Holding Co Ltd
- Chery Automobile Co Ltd
Notable Milestones in Electric Bus Industry Sector
- December 2023: Proterra announced its new EV battery factory in South Carolina, signaling increased demand for commercial electric vehicles. This expansion is expected to significantly enhance supply chain capabilities and lower costs.
- November 2023: Switch Mobility's partnership with JSW for electric buses in India highlights the growing adoption of electric buses in emerging markets. This collaboration demonstrates the increasing private sector investment in sustainable transportation solutions.
- September 2023: Daimler Buses' launch of the next-generation Setra coaches showcases ongoing product innovation within the industry, focusing on safety, economy, and flexibility. This improved product line is expected to increase market competitiveness.
In-Depth Electric Bus Industry Market Outlook
The future of the electric bus market is extremely promising, driven by continuous technological advancements, supportive government policies, and growing environmental awareness. Strategic partnerships and collaborations will be key to driving innovation and market penetration. The industry is expected to see increased consolidation, with larger players acquiring smaller companies to gain market share and technological expertise. The long-term outlook is positive, with substantial growth potential in both developed and developing countries.
Electric Bus Industry Segmentation
-
1. Fuel Category
- 1.1. BEV
- 1.2. FCEV
- 1.3. HEV
- 1.4. PHEV
Electric Bus Industry Segmentation By Geography
-
1. North America
- 1.1. United States
- 1.2. Canada
- 1.3. Mexico
-
2. South America
- 2.1. Brazil
- 2.2. Argentina
- 2.3. Rest of South America
-
3. Europe
- 3.1. United Kingdom
- 3.2. Germany
- 3.3. France
- 3.4. Italy
- 3.5. Spain
- 3.6. Russia
- 3.7. Benelux
- 3.8. Nordics
- 3.9. Rest of Europe
-
4. Middle East & Africa
- 4.1. Turkey
- 4.2. Israel
- 4.3. GCC
- 4.4. North Africa
- 4.5. South Africa
- 4.6. Rest of Middle East & Africa
-
5. Asia Pacific
- 5.1. China
- 5.2. India
- 5.3. Japan
- 5.4. South Korea
- 5.5. ASEAN
- 5.6. Oceania
- 5.7. Rest of Asia Pacific
Electric Bus Industry REPORT HIGHLIGHTS
| Aspects | Details |
|---|---|
| Study Period | 2019-2033 |
| Base Year | 2024 |
| Estimated Year | 2025 |
| Forecast Period | 2025-2033 |
| Historical Period | 2019-2024 |
| Growth Rate | CAGR of > 20.00% from 2019-2033 |
| Segmentation |
|
Table of Contents
- 1. Introduction
- 1.1. Research Scope
- 1.2. Market Segmentation
- 1.3. Research Methodology
- 1.4. Definitions and Assumptions
- 2. Executive Summary
- 2.1. Introduction
- 3. Market Dynamics
- 3.1. Introduction
- 3.2. Market Drivers
- 3.2.1. Growing Travel and Tourism Industry is Driving the Car Rental Market
- 3.3. Market Restrains
- 3.3.1. Increasing Popularity of Ride-Sharing Services Pose Challenges for the Conventional Car Rental Market
- 3.4. Market Trends
- 3.4.1. OTHER KEY INDUSTRY TRENDS COVERED IN THE REPORT
- 4. Market Factor Analysis
- 4.1. Porters Five Forces
- 4.2. Supply/Value Chain
- 4.3. PESTEL analysis
- 4.4. Market Entropy
- 4.5. Patent/Trademark Analysis
- 5. Global Electric Bus Industry Analysis, Insights and Forecast, 2019-2031
- 5.1. Market Analysis, Insights and Forecast - by Fuel Category
- 5.1.1. BEV
- 5.1.2. FCEV
- 5.1.3. HEV
- 5.1.4. PHEV
- 5.2. Market Analysis, Insights and Forecast - by Region
- 5.2.1. North America
- 5.2.2. South America
- 5.2.3. Europe
- 5.2.4. Middle East & Africa
- 5.2.5. Asia Pacific
- 5.1. Market Analysis, Insights and Forecast - by Fuel Category
- 6. North America Electric Bus Industry Analysis, Insights and Forecast, 2019-2031
- 6.1. Market Analysis, Insights and Forecast - by Fuel Category
- 6.1.1. BEV
- 6.1.2. FCEV
- 6.1.3. HEV
- 6.1.4. PHEV
- 6.1. Market Analysis, Insights and Forecast - by Fuel Category
- 7. South America Electric Bus Industry Analysis, Insights and Forecast, 2019-2031
- 7.1. Market Analysis, Insights and Forecast - by Fuel Category
- 7.1.1. BEV
- 7.1.2. FCEV
- 7.1.3. HEV
- 7.1.4. PHEV
- 7.1. Market Analysis, Insights and Forecast - by Fuel Category
- 8. Europe Electric Bus Industry Analysis, Insights and Forecast, 2019-2031
- 8.1. Market Analysis, Insights and Forecast - by Fuel Category
- 8.1.1. BEV
- 8.1.2. FCEV
- 8.1.3. HEV
- 8.1.4. PHEV
- 8.1. Market Analysis, Insights and Forecast - by Fuel Category
- 9. Middle East & Africa Electric Bus Industry Analysis, Insights and Forecast, 2019-2031
- 9.1. Market Analysis, Insights and Forecast - by Fuel Category
- 9.1.1. BEV
- 9.1.2. FCEV
- 9.1.3. HEV
- 9.1.4. PHEV
- 9.1. Market Analysis, Insights and Forecast - by Fuel Category
- 10. Asia Pacific Electric Bus Industry Analysis, Insights and Forecast, 2019-2031
- 10.1. Market Analysis, Insights and Forecast - by Fuel Category
- 10.1.1. BEV
- 10.1.2. FCEV
- 10.1.3. HEV
- 10.1.4. PHEV
- 10.1. Market Analysis, Insights and Forecast - by Fuel Category
- 11. Competitive Analysis
- 11.1. Global Market Share Analysis 2024
- 11.2. Company Profiles
- 11.2.1 Ashok Leyland Limited
- 11.2.1.1. Overview
- 11.2.1.2. Products
- 11.2.1.3. SWOT Analysis
- 11.2.1.4. Recent Developments
- 11.2.1.5. Financials (Based on Availability)
- 11.2.2 Zhengzhou Yutong Bus Co Ltd
- 11.2.2.1. Overview
- 11.2.2.2. Products
- 11.2.2.3. SWOT Analysis
- 11.2.2.4. Recent Developments
- 11.2.2.5. Financials (Based on Availability)
- 11.2.3 Chongqing Changan Automobile Company Limited
- 11.2.3.1. Overview
- 11.2.3.2. Products
- 11.2.3.3. SWOT Analysis
- 11.2.3.4. Recent Developments
- 11.2.3.5. Financials (Based on Availability)
- 11.2.4 Anhui Ankai Automobile Co Ltd
- 11.2.4.1. Overview
- 11.2.4.2. Products
- 11.2.4.3. SWOT Analysis
- 11.2.4.4. Recent Developments
- 11.2.4.5. Financials (Based on Availability)
- 11.2.5 Proterra INC
- 11.2.5.1. Overview
- 11.2.5.2. Products
- 11.2.5.3. SWOT Analysis
- 11.2.5.4. Recent Developments
- 11.2.5.5. Financials (Based on Availability)
- 11.2.6 Tata Motors Limited
- 11.2.6.1. Overview
- 11.2.6.2. Products
- 11.2.6.3. SWOT Analysis
- 11.2.6.4. Recent Developments
- 11.2.6.5. Financials (Based on Availability)
- 11.2.7 Daimler Truck Holding AG
- 11.2.7.1. Overview
- 11.2.7.2. Products
- 11.2.7.3. SWOT Analysis
- 11.2.7.4. Recent Developments
- 11.2.7.5. Financials (Based on Availability)
- 11.2.8 Volvo Group
- 11.2.8.1. Overview
- 11.2.8.2. Products
- 11.2.8.3. SWOT Analysis
- 11.2.8.4. Recent Developments
- 11.2.8.5. Financials (Based on Availability)
- 11.2.9 Zhejiang Geely Holding Group Co Ltd
- 11.2.9.1. Overview
- 11.2.9.2. Products
- 11.2.9.3. SWOT Analysis
- 11.2.9.4. Recent Developments
- 11.2.9.5. Financials (Based on Availability)
- 11.2.10 CRRC Electric Vehicle Co Ltd
- 11.2.10.1. Overview
- 11.2.10.2. Products
- 11.2.10.3. SWOT Analysis
- 11.2.10.4. Recent Developments
- 11.2.10.5. Financials (Based on Availability)
- 11.2.11 NFI Group Inc
- 11.2.11.1. Overview
- 11.2.11.2. Products
- 11.2.11.3. SWOT Analysis
- 11.2.11.4. Recent Developments
- 11.2.11.5. Financials (Based on Availability)
- 11.2.12 King Long United Automotive Industry Co Ltd
- 11.2.12.1. Overview
- 11.2.12.2. Products
- 11.2.12.3. SWOT Analysis
- 11.2.12.4. Recent Developments
- 11.2.12.5. Financials (Based on Availability)
- 11.2.13 Byd Auto Industry Company Limited
- 11.2.13.1. Overview
- 11.2.13.2. Products
- 11.2.13.3. SWOT Analysis
- 11.2.13.4. Recent Developments
- 11.2.13.5. Financials (Based on Availability)
- 11.2.14 Zhongtong Bus Holding Co Ltd
- 11.2.14.1. Overview
- 11.2.14.2. Products
- 11.2.14.3. SWOT Analysis
- 11.2.14.4. Recent Developments
- 11.2.14.5. Financials (Based on Availability)
- 11.2.15 Chery Automobile Co Ltd
- 11.2.15.1. Overview
- 11.2.15.2. Products
- 11.2.15.3. SWOT Analysis
- 11.2.15.4. Recent Developments
- 11.2.15.5. Financials (Based on Availability)
- 11.2.1 Ashok Leyland Limited
List of Figures
- Figure 1: Global Electric Bus Industry Revenue Breakdown (Million, %) by Region 2024 & 2032
- Figure 2: North America Electric Bus Industry Revenue (Million), by Fuel Category 2024 & 2032
- Figure 3: North America Electric Bus Industry Revenue Share (%), by Fuel Category 2024 & 2032
- Figure 4: North America Electric Bus Industry Revenue (Million), by Country 2024 & 2032
- Figure 5: North America Electric Bus Industry Revenue Share (%), by Country 2024 & 2032
- Figure 6: South America Electric Bus Industry Revenue (Million), by Fuel Category 2024 & 2032
- Figure 7: South America Electric Bus Industry Revenue Share (%), by Fuel Category 2024 & 2032
- Figure 8: South America Electric Bus Industry Revenue (Million), by Country 2024 & 2032
- Figure 9: South America Electric Bus Industry Revenue Share (%), by Country 2024 & 2032
- Figure 10: Europe Electric Bus Industry Revenue (Million), by Fuel Category 2024 & 2032
- Figure 11: Europe Electric Bus Industry Revenue Share (%), by Fuel Category 2024 & 2032
- Figure 12: Europe Electric Bus Industry Revenue (Million), by Country 2024 & 2032
- Figure 13: Europe Electric Bus Industry Revenue Share (%), by Country 2024 & 2032
- Figure 14: Middle East & Africa Electric Bus Industry Revenue (Million), by Fuel Category 2024 & 2032
- Figure 15: Middle East & Africa Electric Bus Industry Revenue Share (%), by Fuel Category 2024 & 2032
- Figure 16: Middle East & Africa Electric Bus Industry Revenue (Million), by Country 2024 & 2032
- Figure 17: Middle East & Africa Electric Bus Industry Revenue Share (%), by Country 2024 & 2032
- Figure 18: Asia Pacific Electric Bus Industry Revenue (Million), by Fuel Category 2024 & 2032
- Figure 19: Asia Pacific Electric Bus Industry Revenue Share (%), by Fuel Category 2024 & 2032
- Figure 20: Asia Pacific Electric Bus Industry Revenue (Million), by Country 2024 & 2032
- Figure 21: Asia Pacific Electric Bus Industry Revenue Share (%), by Country 2024 & 2032
List of Tables
- Table 1: Global Electric Bus Industry Revenue Million Forecast, by Region 2019 & 2032
- Table 2: Global Electric Bus Industry Revenue Million Forecast, by Fuel Category 2019 & 2032
- Table 3: Global Electric Bus Industry Revenue Million Forecast, by Region 2019 & 2032
- Table 4: Global Electric Bus Industry Revenue Million Forecast, by Fuel Category 2019 & 2032
- Table 5: Global Electric Bus Industry Revenue Million Forecast, by Country 2019 & 2032
- Table 6: United States Electric Bus Industry Revenue (Million) Forecast, by Application 2019 & 2032
- Table 7: Canada Electric Bus Industry Revenue (Million) Forecast, by Application 2019 & 2032
- Table 8: Mexico Electric Bus Industry Revenue (Million) Forecast, by Application 2019 & 2032
- Table 9: Global Electric Bus Industry Revenue Million Forecast, by Fuel Category 2019 & 2032
- Table 10: Global Electric Bus Industry Revenue Million Forecast, by Country 2019 & 2032
- Table 11: Brazil Electric Bus Industry Revenue (Million) Forecast, by Application 2019 & 2032
- Table 12: Argentina Electric Bus Industry Revenue (Million) Forecast, by Application 2019 & 2032
- Table 13: Rest of South America Electric Bus Industry Revenue (Million) Forecast, by Application 2019 & 2032
- Table 14: Global Electric Bus Industry Revenue Million Forecast, by Fuel Category 2019 & 2032
- Table 15: Global Electric Bus Industry Revenue Million Forecast, by Country 2019 & 2032
- Table 16: United Kingdom Electric Bus Industry Revenue (Million) Forecast, by Application 2019 & 2032
- Table 17: Germany Electric Bus Industry Revenue (Million) Forecast, by Application 2019 & 2032
- Table 18: France Electric Bus Industry Revenue (Million) Forecast, by Application 2019 & 2032
- Table 19: Italy Electric Bus Industry Revenue (Million) Forecast, by Application 2019 & 2032
- Table 20: Spain Electric Bus Industry Revenue (Million) Forecast, by Application 2019 & 2032
- Table 21: Russia Electric Bus Industry Revenue (Million) Forecast, by Application 2019 & 2032
- Table 22: Benelux Electric Bus Industry Revenue (Million) Forecast, by Application 2019 & 2032
- Table 23: Nordics Electric Bus Industry Revenue (Million) Forecast, by Application 2019 & 2032
- Table 24: Rest of Europe Electric Bus Industry Revenue (Million) Forecast, by Application 2019 & 2032
- Table 25: Global Electric Bus Industry Revenue Million Forecast, by Fuel Category 2019 & 2032
- Table 26: Global Electric Bus Industry Revenue Million Forecast, by Country 2019 & 2032
- Table 27: Turkey Electric Bus Industry Revenue (Million) Forecast, by Application 2019 & 2032
- Table 28: Israel Electric Bus Industry Revenue (Million) Forecast, by Application 2019 & 2032
- Table 29: GCC Electric Bus Industry Revenue (Million) Forecast, by Application 2019 & 2032
- Table 30: North Africa Electric Bus Industry Revenue (Million) Forecast, by Application 2019 & 2032
- Table 31: South Africa Electric Bus Industry Revenue (Million) Forecast, by Application 2019 & 2032
- Table 32: Rest of Middle East & Africa Electric Bus Industry Revenue (Million) Forecast, by Application 2019 & 2032
- Table 33: Global Electric Bus Industry Revenue Million Forecast, by Fuel Category 2019 & 2032
- Table 34: Global Electric Bus Industry Revenue Million Forecast, by Country 2019 & 2032
- Table 35: China Electric Bus Industry Revenue (Million) Forecast, by Application 2019 & 2032
- Table 36: India Electric Bus Industry Revenue (Million) Forecast, by Application 2019 & 2032
- Table 37: Japan Electric Bus Industry Revenue (Million) Forecast, by Application 2019 & 2032
- Table 38: South Korea Electric Bus Industry Revenue (Million) Forecast, by Application 2019 & 2032
- Table 39: ASEAN Electric Bus Industry Revenue (Million) Forecast, by Application 2019 & 2032
- Table 40: Oceania Electric Bus Industry Revenue (Million) Forecast, by Application 2019 & 2032
- Table 41: Rest of Asia Pacific Electric Bus Industry Revenue (Million) Forecast, by Application 2019 & 2032
Frequently Asked Questions
1. What is the projected Compound Annual Growth Rate (CAGR) of the Electric Bus Industry?
The projected CAGR is approximately > 20.00%.
2. Which companies are prominent players in the Electric Bus Industry?
Key companies in the market include Ashok Leyland Limited, Zhengzhou Yutong Bus Co Ltd, Chongqing Changan Automobile Company Limited, Anhui Ankai Automobile Co Ltd, Proterra INC, Tata Motors Limited, Daimler Truck Holding AG, Volvo Group, Zhejiang Geely Holding Group Co Ltd, CRRC Electric Vehicle Co Ltd, NFI Group Inc, King Long United Automotive Industry Co Ltd, Byd Auto Industry Company Limited, Zhongtong Bus Holding Co Ltd, Chery Automobile Co Ltd.
3. What are the main segments of the Electric Bus Industry?
The market segments include Fuel Category.
4. Can you provide details about the market size?
The market size is estimated to be USD XX Million as of 2022.
5. What are some drivers contributing to market growth?
Growing Travel and Tourism Industry is Driving the Car Rental Market.
6. What are the notable trends driving market growth?
OTHER KEY INDUSTRY TRENDS COVERED IN THE REPORT.
7. Are there any restraints impacting market growth?
Increasing Popularity of Ride-Sharing Services Pose Challenges for the Conventional Car Rental Market.
8. Can you provide examples of recent developments in the market?
December 2023: Proterra announced its new EV battery factory in South Carolina as demand for commercial electric vehicles increased.November 2023: Switch Mobilty partners with JSW for electric buses for employee transportation in India.September 2023: Daimler Buses launched the next generation Setra TopClass and ComfortClass touring coaches that meet the highest standards of safety, economy, and flexibility.
9. What pricing options are available for accessing the report?
Pricing options include single-user, multi-user, and enterprise licenses priced at USD 3800, USD 4500, and USD 5800 respectively.
10. Is the market size provided in terms of value or volume?
The market size is provided in terms of value, measured in Million.
11. Are there any specific market keywords associated with the report?
Yes, the market keyword associated with the report is "Electric Bus Industry," which aids in identifying and referencing the specific market segment covered.
12. How do I determine which pricing option suits my needs best?
The pricing options vary based on user requirements and access needs. Individual users may opt for single-user licenses, while businesses requiring broader access may choose multi-user or enterprise licenses for cost-effective access to the report.
13. Are there any additional resources or data provided in the Electric Bus Industry report?
While the report offers comprehensive insights, it's advisable to review the specific contents or supplementary materials provided to ascertain if additional resources or data are available.
14. How can I stay updated on further developments or reports in the Electric Bus Industry?
To stay informed about further developments, trends, and reports in the Electric Bus Industry, consider subscribing to industry newsletters, following relevant companies and organizations, or regularly checking reputable industry news sources and publications.
Methodology
Step 1 - Identification of Relevant Samples Size from Population Database


Step 2 - Approaches for Defining Global Market Size (Value, Volume* & Price*)

Note*: In applicable scenarios
Step 3 - Data Sources
Primary Research
- Web Analytics
- Survey Reports
- Research Institute
- Latest Research Reports
- Opinion Leaders
Secondary Research
- Annual Reports
- White Paper
- Latest Press Release
- Industry Association
- Paid Database
- Investor Presentations

Step 4 - Data Triangulation
Involves using different sources of information in order to increase the validity of a study
These sources are likely to be stakeholders in a program - participants, other researchers, program staff, other community members, and so on.
Then we put all data in single framework & apply various statistical tools to find out the dynamic on the market.
During the analysis stage, feedback from the stakeholder groups would be compared to determine areas of agreement as well as areas of divergence


