
Key Insights
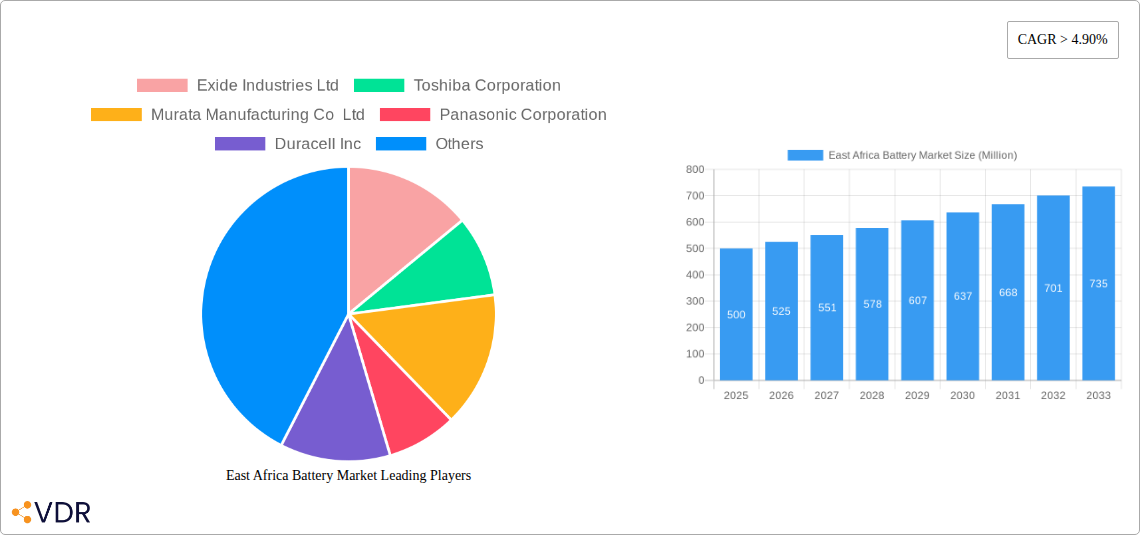
The East African battery market, currently experiencing robust growth, is projected to maintain a Compound Annual Growth Rate (CAGR) exceeding 4.90% from 2025 to 2033. This expansion is driven by several key factors. The increasing electrification of transportation, particularly in urban centers like Nairobi and Kampala, is a significant driver. The rising adoption of electric two-wheelers and three-wheelers, coupled with the growing need for energy storage solutions in off-grid areas, fuels market demand. Furthermore, expanding telecommunications infrastructure and the proliferation of mobile devices necessitate reliable power backup solutions, further boosting battery sales. Government initiatives promoting renewable energy integration and improved infrastructure development also contribute to market growth. Key players like Exide Industries Ltd, Toshiba Corporation, and Panasonic Corporation are strategically expanding their presence in the region to capitalize on these opportunities. However, challenges remain, including inconsistent power supply, high import tariffs on certain battery types, and a limited awareness of advanced battery technologies among consumers and businesses. These restraints slightly temper the overall growth potential, but the overall outlook for the East African battery market remains positive.
The market segmentation reveals a strong preference for lead-acid batteries, currently dominating the market share. However, the growing demand for higher energy density and longer lifespan batteries is paving the way for increased adoption of lithium-ion and other advanced technologies in the coming years. Regional variations exist, with countries like Kenya and Tanzania exhibiting higher growth rates compared to others due to varying levels of economic development and infrastructure investments. The competitive landscape is characterized by a mix of both international and local players, creating a dynamic market with diverse product offerings and price points. The forecast period anticipates continued market consolidation as larger players acquire smaller companies and invest in expanding their distribution networks throughout the region. The long-term outlook strongly suggests that the East African battery market is poised for significant expansion, driven by consistent economic growth and increasing energy demands.
East Africa Battery Market: A Comprehensive Market Report (2019-2033)
This in-depth report provides a comprehensive analysis of the East Africa Battery Market, encompassing market dynamics, growth trends, regional dominance, product landscape, key players, and future outlook. The study period covers 2019-2033, with a base year of 2025 and a forecast period of 2025-2033. The report segments the market into various categories (specific segments to be detailed within the report itself), offering granular insights for informed decision-making. This report is invaluable for investors, industry professionals, and strategic planners seeking a clear understanding of this rapidly evolving market. The market is valued at XX Million Units in 2025 and is projected to reach XX Million Units by 2033.
East Africa Battery Market Dynamics & Structure
The East Africa battery market is characterized by a moderately concentrated landscape, with both international and local players competing. Technological innovation, driven by the demand for improved energy storage solutions, is a key driver. However, regulatory frameworks and the availability of raw materials pose significant challenges. The market experiences competition from alternative energy storage technologies and is influenced by fluctuating commodity prices and end-user preferences. Mergers and acquisitions are expected to play a role in shaping the market structure.
- Market Concentration: Moderately concentrated, with a top 5 market share of approximately xx%.
- Technological Innovation: Focus on lithium-ion batteries, improving energy density and lifespan.
- Regulatory Framework: Varying regulations across countries impact market growth.
- Competitive Product Substitutes: Fuel cells, capacitors, and other energy storage technologies.
- End-User Demographics: Dominated by the telecom, automotive, and renewable energy sectors.
- M&A Trends: A moderate number of M&A deals are anticipated over the forecast period, with a focus on expanding market reach and technological capabilities. xx M&A deals are estimated to take place between 2025 and 2033.
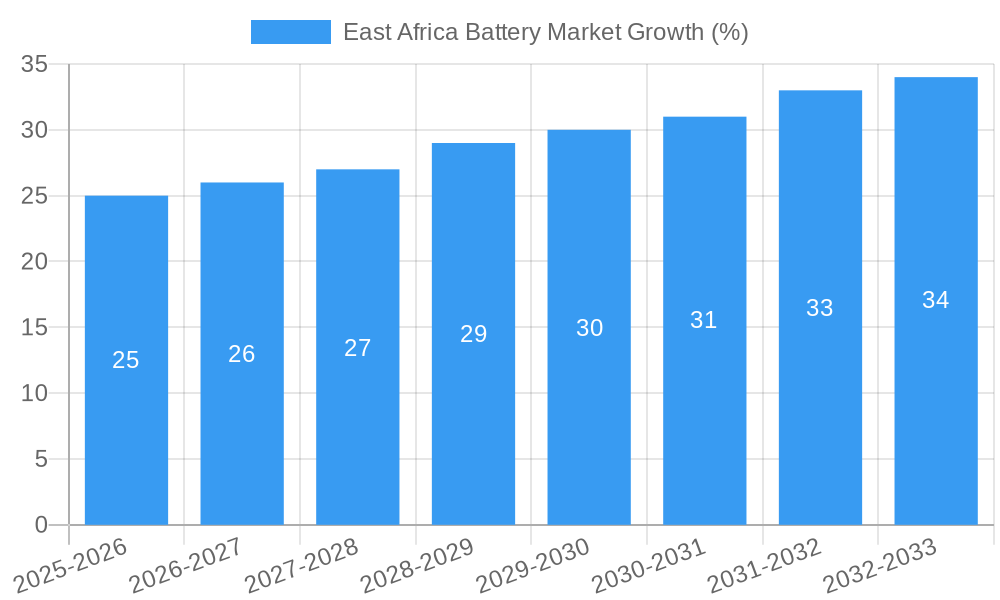
East Africa Battery Market Growth Trends & Insights
The East Africa battery market is experiencing robust growth, driven by increasing electrification across various sectors. Adoption rates are rising rapidly, particularly in the renewable energy and telecommunications sectors. Technological advancements, particularly in lithium-ion battery technology, are further fueling growth. Consumer behavior is shifting toward longer-lasting, higher-performance batteries, creating demand for innovative products. The market is anticipated to exhibit a CAGR of xx% during the forecast period, surpassing xx Million Units by 2033. Market penetration is expected to increase from xx% in 2025 to xx% by 2033.
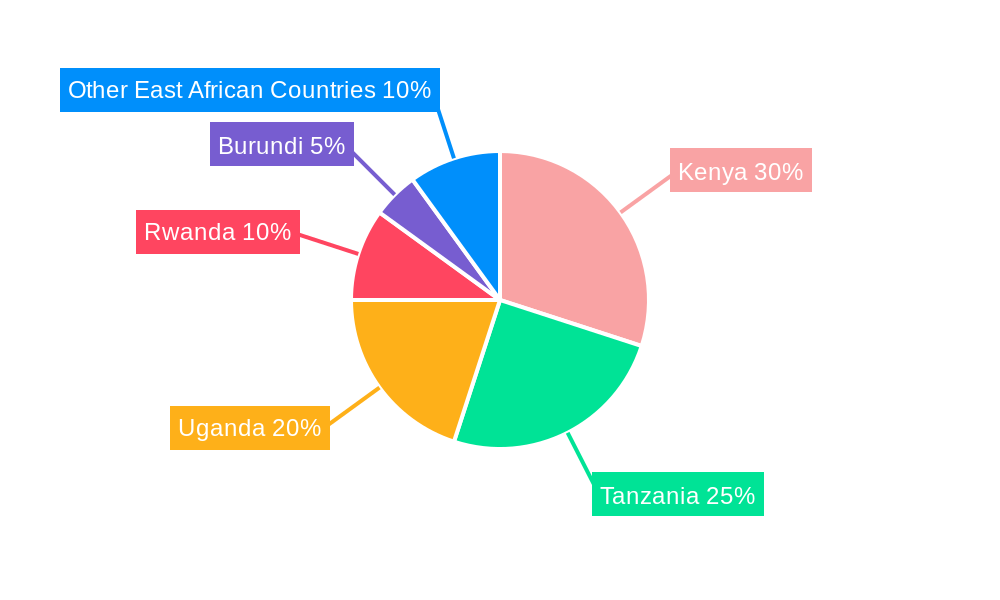
Dominant Regions, Countries, or Segments in East Africa Battery Market
Kenya, Uganda, and Tanzania are the leading countries in the East Africa battery market, driven by strong economic growth, expanding infrastructure, and increasing adoption of renewable energy sources. The rise of mobile money services is a significant driver in these countries, leading to increased demand for portable power solutions. Growth is also propelled by government initiatives promoting renewable energy and supportive economic policies.
- Kenya: Largest market share due to robust infrastructure development and technological adoption.
- Uganda: Significant growth potential fueled by increasing renewable energy installations and expanding telecom sector.
- Tanzania: Strong market growth prospects driven by urbanization and economic development.
- Rwanda: Growing market fueled by initiatives to develop mini-grids coupled with battery storage.
East Africa Battery Market Product Landscape
The East Africa battery market offers a diverse range of products, including lead-acid, lithium-ion, and nickel-cadmium batteries, catering to various applications. Lead-acid batteries dominate the market due to their lower cost, but lithium-ion batteries are gaining traction due to their superior performance. Technological advancements are focusing on improving energy density, lifespan, and safety features. Key product innovations include advancements in battery management systems (BMS) and the development of fast-charging technologies.
Key Drivers, Barriers & Challenges in East Africa Battery Market
Key Drivers:
- Growing demand from the telecom sector.
- Increasing adoption of renewable energy technologies.
- Expansion of the electric vehicle market (although still nascent).
- Government support for clean energy initiatives.
Challenges:
- High initial investment costs associated with adopting new battery technologies.
- Limited access to raw materials and reliable supply chains.
- Lack of standardized battery regulations across the region.
- Intense competition and price pressures. The competitive landscape impacts margins by approximately xx%.
Emerging Opportunities in East Africa Battery Market
- Growing demand for energy storage solutions in off-grid areas.
- Expansion of the electric two-wheeler market.
- Opportunities in providing energy storage for mini-grids and microgrids.
- Development of innovative battery recycling and disposal solutions.
Growth Accelerators in the East Africa Battery Market Industry
Technological advancements in battery chemistry and management systems are significant catalysts for growth. Strategic partnerships between international and local players are fostering market expansion. Furthermore, government initiatives promoting renewable energy adoption and infrastructure development are accelerating market growth.
Key Players Shaping the East Africa Battery Market Market
- Exide Industries Ltd
- Toshiba Corporation
- Murata Manufacturing Co Ltd
- Panasonic Corporation
- Duracell Inc
- ABM Group
- Trojan Battery Company
- Uganda Batteries Limited
- Bodawerk International Ltd
Notable Milestones in East Africa Battery Market Sector
- February 2021: Winch Energy completes funding for solar mini-grid projects in Uganda and Sierra Leone, including 6,000 portable batteries.
- December 2021: Development Bank of Rwanda (BRD) announces plans to develop solar PV and hydro mini-grids with battery storage.
In-Depth East Africa Battery Market Market Outlook
The East Africa battery market is poised for sustained growth, driven by increasing electrification, government support for renewable energy, and technological innovation. Strategic investments in infrastructure, coupled with the expansion of the electric vehicle and renewable energy sectors, present significant opportunities for market players. The focus on improving energy storage solutions will drive further market expansion and create new market segments.
East Africa Battery Market Segmentation
-
1. Type
- 1.1. Primary Battery
- 1.2. Secondary Battery
-
2. Technology
- 2.1. Lithium-ion Battery
- 2.2. Lead-acid Battery
- 2.3. Other Technologies
-
3. Application
- 3.1. Industrial Batteries
- 3.2. Portable Batteries
- 3.3. Other Applications
-
4. Geography
- 4.1. Kenya
- 4.2. Ethiopia
- 4.3. Tanzania
- 4.4. Rest of East Africa
East Africa Battery Market Segmentation By Geography
- 1. Kenya
- 2. Ethiopia
- 3. Tanzania
- 4. Rest of East Africa
East Africa Battery Market REPORT HIGHLIGHTS
| Aspects | Details |
|---|---|
| Study Period | 2019-2033 |
| Base Year | 2024 |
| Estimated Year | 2025 |
| Forecast Period | 2025-2033 |
| Historical Period | 2019-2024 |
| Growth Rate | CAGR of > 4.90% from 2019-2033 |
| Segmentation |
|
Table of Contents
- 1. Introduction
- 1.1. Research Scope
- 1.2. Market Segmentation
- 1.3. Research Methodology
- 1.4. Definitions and Assumptions
- 2. Executive Summary
- 2.1. Introduction
- 3. Market Dynamics
- 3.1. Introduction
- 3.2. Market Drivers
- 3.3. Market Restrains
- 3.4. Market Trends
- 3.4.1. Lithium-ion Battery Segment Expected to be the Fastest-growing Market
- 4. Market Factor Analysis
- 4.1. Porters Five Forces
- 4.2. Supply/Value Chain
- 4.3. PESTEL analysis
- 4.4. Market Entropy
- 4.5. Patent/Trademark Analysis
- 5. Global East Africa Battery Market Analysis, Insights and Forecast, 2019-2031
- 5.1. Market Analysis, Insights and Forecast - by Type
- 5.1.1. Primary Battery
- 5.1.2. Secondary Battery
- 5.2. Market Analysis, Insights and Forecast - by Technology
- 5.2.1. Lithium-ion Battery
- 5.2.2. Lead-acid Battery
- 5.2.3. Other Technologies
- 5.3. Market Analysis, Insights and Forecast - by Application
- 5.3.1. Industrial Batteries
- 5.3.2. Portable Batteries
- 5.3.3. Other Applications
- 5.4. Market Analysis, Insights and Forecast - by Geography
- 5.4.1. Kenya
- 5.4.2. Ethiopia
- 5.4.3. Tanzania
- 5.4.4. Rest of East Africa
- 5.5. Market Analysis, Insights and Forecast - by Region
- 5.5.1. Kenya
- 5.5.2. Ethiopia
- 5.5.3. Tanzania
- 5.5.4. Rest of East Africa
- 5.1. Market Analysis, Insights and Forecast - by Type
- 6. Kenya East Africa Battery Market Analysis, Insights and Forecast, 2019-2031
- 6.1. Market Analysis, Insights and Forecast - by Type
- 6.1.1. Primary Battery
- 6.1.2. Secondary Battery
- 6.2. Market Analysis, Insights and Forecast - by Technology
- 6.2.1. Lithium-ion Battery
- 6.2.2. Lead-acid Battery
- 6.2.3. Other Technologies
- 6.3. Market Analysis, Insights and Forecast - by Application
- 6.3.1. Industrial Batteries
- 6.3.2. Portable Batteries
- 6.3.3. Other Applications
- 6.4. Market Analysis, Insights and Forecast - by Geography
- 6.4.1. Kenya
- 6.4.2. Ethiopia
- 6.4.3. Tanzania
- 6.4.4. Rest of East Africa
- 6.1. Market Analysis, Insights and Forecast - by Type
- 7. Ethiopia East Africa Battery Market Analysis, Insights and Forecast, 2019-2031
- 7.1. Market Analysis, Insights and Forecast - by Type
- 7.1.1. Primary Battery
- 7.1.2. Secondary Battery
- 7.2. Market Analysis, Insights and Forecast - by Technology
- 7.2.1. Lithium-ion Battery
- 7.2.2. Lead-acid Battery
- 7.2.3. Other Technologies
- 7.3. Market Analysis, Insights and Forecast - by Application
- 7.3.1. Industrial Batteries
- 7.3.2. Portable Batteries
- 7.3.3. Other Applications
- 7.4. Market Analysis, Insights and Forecast - by Geography
- 7.4.1. Kenya
- 7.4.2. Ethiopia
- 7.4.3. Tanzania
- 7.4.4. Rest of East Africa
- 7.1. Market Analysis, Insights and Forecast - by Type
- 8. Tanzania East Africa Battery Market Analysis, Insights and Forecast, 2019-2031
- 8.1. Market Analysis, Insights and Forecast - by Type
- 8.1.1. Primary Battery
- 8.1.2. Secondary Battery
- 8.2. Market Analysis, Insights and Forecast - by Technology
- 8.2.1. Lithium-ion Battery
- 8.2.2. Lead-acid Battery
- 8.2.3. Other Technologies
- 8.3. Market Analysis, Insights and Forecast - by Application
- 8.3.1. Industrial Batteries
- 8.3.2. Portable Batteries
- 8.3.3. Other Applications
- 8.4. Market Analysis, Insights and Forecast - by Geography
- 8.4.1. Kenya
- 8.4.2. Ethiopia
- 8.4.3. Tanzania
- 8.4.4. Rest of East Africa
- 8.1. Market Analysis, Insights and Forecast - by Type
- 9. Rest of East Africa East Africa Battery Market Analysis, Insights and Forecast, 2019-2031
- 9.1. Market Analysis, Insights and Forecast - by Type
- 9.1.1. Primary Battery
- 9.1.2. Secondary Battery
- 9.2. Market Analysis, Insights and Forecast - by Technology
- 9.2.1. Lithium-ion Battery
- 9.2.2. Lead-acid Battery
- 9.2.3. Other Technologies
- 9.3. Market Analysis, Insights and Forecast - by Application
- 9.3.1. Industrial Batteries
- 9.3.2. Portable Batteries
- 9.3.3. Other Applications
- 9.4. Market Analysis, Insights and Forecast - by Geography
- 9.4.1. Kenya
- 9.4.2. Ethiopia
- 9.4.3. Tanzania
- 9.4.4. Rest of East Africa
- 9.1. Market Analysis, Insights and Forecast - by Type
- 10. Competitive Analysis
- 10.1. Global Market Share Analysis 2024
- 10.2. Company Profiles
- 10.2.1 Exide Industries Ltd
- 10.2.1.1. Overview
- 10.2.1.2. Products
- 10.2.1.3. SWOT Analysis
- 10.2.1.4. Recent Developments
- 10.2.1.5. Financials (Based on Availability)
- 10.2.2 Toshiba Corporation
- 10.2.2.1. Overview
- 10.2.2.2. Products
- 10.2.2.3. SWOT Analysis
- 10.2.2.4. Recent Developments
- 10.2.2.5. Financials (Based on Availability)
- 10.2.3 Murata Manufacturing Co Ltd
- 10.2.3.1. Overview
- 10.2.3.2. Products
- 10.2.3.3. SWOT Analysis
- 10.2.3.4. Recent Developments
- 10.2.3.5. Financials (Based on Availability)
- 10.2.4 Panasonic Corporation
- 10.2.4.1. Overview
- 10.2.4.2. Products
- 10.2.4.3. SWOT Analysis
- 10.2.4.4. Recent Developments
- 10.2.4.5. Financials (Based on Availability)
- 10.2.5 Duracell Inc
- 10.2.5.1. Overview
- 10.2.5.2. Products
- 10.2.5.3. SWOT Analysis
- 10.2.5.4. Recent Developments
- 10.2.5.5. Financials (Based on Availability)
- 10.2.6 ABM Group
- 10.2.6.1. Overview
- 10.2.6.2. Products
- 10.2.6.3. SWOT Analysis
- 10.2.6.4. Recent Developments
- 10.2.6.5. Financials (Based on Availability)
- 10.2.7 Trojan Battery Company
- 10.2.7.1. Overview
- 10.2.7.2. Products
- 10.2.7.3. SWOT Analysis
- 10.2.7.4. Recent Developments
- 10.2.7.5. Financials (Based on Availability)
- 10.2.8 Uganda Batteries Limited
- 10.2.8.1. Overview
- 10.2.8.2. Products
- 10.2.8.3. SWOT Analysis
- 10.2.8.4. Recent Developments
- 10.2.8.5. Financials (Based on Availability)
- 10.2.9 Bodawerk International Ltd*List Not Exhaustive
- 10.2.9.1. Overview
- 10.2.9.2. Products
- 10.2.9.3. SWOT Analysis
- 10.2.9.4. Recent Developments
- 10.2.9.5. Financials (Based on Availability)
- 10.2.1 Exide Industries Ltd
List of Figures
- Figure 1: Global East Africa Battery Market Revenue Breakdown (Million, %) by Region 2024 & 2032
- Figure 2: Kenya East Africa Battery Market Revenue (Million), by Type 2024 & 2032
- Figure 3: Kenya East Africa Battery Market Revenue Share (%), by Type 2024 & 2032
- Figure 4: Kenya East Africa Battery Market Revenue (Million), by Technology 2024 & 2032
- Figure 5: Kenya East Africa Battery Market Revenue Share (%), by Technology 2024 & 2032
- Figure 6: Kenya East Africa Battery Market Revenue (Million), by Application 2024 & 2032
- Figure 7: Kenya East Africa Battery Market Revenue Share (%), by Application 2024 & 2032
- Figure 8: Kenya East Africa Battery Market Revenue (Million), by Geography 2024 & 2032
- Figure 9: Kenya East Africa Battery Market Revenue Share (%), by Geography 2024 & 2032
- Figure 10: Kenya East Africa Battery Market Revenue (Million), by Country 2024 & 2032
- Figure 11: Kenya East Africa Battery Market Revenue Share (%), by Country 2024 & 2032
- Figure 12: Ethiopia East Africa Battery Market Revenue (Million), by Type 2024 & 2032
- Figure 13: Ethiopia East Africa Battery Market Revenue Share (%), by Type 2024 & 2032
- Figure 14: Ethiopia East Africa Battery Market Revenue (Million), by Technology 2024 & 2032
- Figure 15: Ethiopia East Africa Battery Market Revenue Share (%), by Technology 2024 & 2032
- Figure 16: Ethiopia East Africa Battery Market Revenue (Million), by Application 2024 & 2032
- Figure 17: Ethiopia East Africa Battery Market Revenue Share (%), by Application 2024 & 2032
- Figure 18: Ethiopia East Africa Battery Market Revenue (Million), by Geography 2024 & 2032
- Figure 19: Ethiopia East Africa Battery Market Revenue Share (%), by Geography 2024 & 2032
- Figure 20: Ethiopia East Africa Battery Market Revenue (Million), by Country 2024 & 2032
- Figure 21: Ethiopia East Africa Battery Market Revenue Share (%), by Country 2024 & 2032
- Figure 22: Tanzania East Africa Battery Market Revenue (Million), by Type 2024 & 2032
- Figure 23: Tanzania East Africa Battery Market Revenue Share (%), by Type 2024 & 2032
- Figure 24: Tanzania East Africa Battery Market Revenue (Million), by Technology 2024 & 2032
- Figure 25: Tanzania East Africa Battery Market Revenue Share (%), by Technology 2024 & 2032
- Figure 26: Tanzania East Africa Battery Market Revenue (Million), by Application 2024 & 2032
- Figure 27: Tanzania East Africa Battery Market Revenue Share (%), by Application 2024 & 2032
- Figure 28: Tanzania East Africa Battery Market Revenue (Million), by Geography 2024 & 2032
- Figure 29: Tanzania East Africa Battery Market Revenue Share (%), by Geography 2024 & 2032
- Figure 30: Tanzania East Africa Battery Market Revenue (Million), by Country 2024 & 2032
- Figure 31: Tanzania East Africa Battery Market Revenue Share (%), by Country 2024 & 2032
- Figure 32: Rest of East Africa East Africa Battery Market Revenue (Million), by Type 2024 & 2032
- Figure 33: Rest of East Africa East Africa Battery Market Revenue Share (%), by Type 2024 & 2032
- Figure 34: Rest of East Africa East Africa Battery Market Revenue (Million), by Technology 2024 & 2032
- Figure 35: Rest of East Africa East Africa Battery Market Revenue Share (%), by Technology 2024 & 2032
- Figure 36: Rest of East Africa East Africa Battery Market Revenue (Million), by Application 2024 & 2032
- Figure 37: Rest of East Africa East Africa Battery Market Revenue Share (%), by Application 2024 & 2032
- Figure 38: Rest of East Africa East Africa Battery Market Revenue (Million), by Geography 2024 & 2032
- Figure 39: Rest of East Africa East Africa Battery Market Revenue Share (%), by Geography 2024 & 2032
- Figure 40: Rest of East Africa East Africa Battery Market Revenue (Million), by Country 2024 & 2032
- Figure 41: Rest of East Africa East Africa Battery Market Revenue Share (%), by Country 2024 & 2032
List of Tables
- Table 1: Global East Africa Battery Market Revenue Million Forecast, by Region 2019 & 2032
- Table 2: Global East Africa Battery Market Revenue Million Forecast, by Type 2019 & 2032
- Table 3: Global East Africa Battery Market Revenue Million Forecast, by Technology 2019 & 2032
- Table 4: Global East Africa Battery Market Revenue Million Forecast, by Application 2019 & 2032
- Table 5: Global East Africa Battery Market Revenue Million Forecast, by Geography 2019 & 2032
- Table 6: Global East Africa Battery Market Revenue Million Forecast, by Region 2019 & 2032
- Table 7: Global East Africa Battery Market Revenue Million Forecast, by Type 2019 & 2032
- Table 8: Global East Africa Battery Market Revenue Million Forecast, by Technology 2019 & 2032
- Table 9: Global East Africa Battery Market Revenue Million Forecast, by Application 2019 & 2032
- Table 10: Global East Africa Battery Market Revenue Million Forecast, by Geography 2019 & 2032
- Table 11: Global East Africa Battery Market Revenue Million Forecast, by Country 2019 & 2032
- Table 12: Global East Africa Battery Market Revenue Million Forecast, by Type 2019 & 2032
- Table 13: Global East Africa Battery Market Revenue Million Forecast, by Technology 2019 & 2032
- Table 14: Global East Africa Battery Market Revenue Million Forecast, by Application 2019 & 2032
- Table 15: Global East Africa Battery Market Revenue Million Forecast, by Geography 2019 & 2032
- Table 16: Global East Africa Battery Market Revenue Million Forecast, by Country 2019 & 2032
- Table 17: Global East Africa Battery Market Revenue Million Forecast, by Type 2019 & 2032
- Table 18: Global East Africa Battery Market Revenue Million Forecast, by Technology 2019 & 2032
- Table 19: Global East Africa Battery Market Revenue Million Forecast, by Application 2019 & 2032
- Table 20: Global East Africa Battery Market Revenue Million Forecast, by Geography 2019 & 2032
- Table 21: Global East Africa Battery Market Revenue Million Forecast, by Country 2019 & 2032
- Table 22: Global East Africa Battery Market Revenue Million Forecast, by Type 2019 & 2032
- Table 23: Global East Africa Battery Market Revenue Million Forecast, by Technology 2019 & 2032
- Table 24: Global East Africa Battery Market Revenue Million Forecast, by Application 2019 & 2032
- Table 25: Global East Africa Battery Market Revenue Million Forecast, by Geography 2019 & 2032
- Table 26: Global East Africa Battery Market Revenue Million Forecast, by Country 2019 & 2032
Frequently Asked Questions
1. What is the projected Compound Annual Growth Rate (CAGR) of the East Africa Battery Market?
The projected CAGR is approximately > 4.90%.
2. Which companies are prominent players in the East Africa Battery Market?
Key companies in the market include Exide Industries Ltd, Toshiba Corporation, Murata Manufacturing Co Ltd, Panasonic Corporation, Duracell Inc, ABM Group, Trojan Battery Company, Uganda Batteries Limited, Bodawerk International Ltd*List Not Exhaustive.
3. What are the main segments of the East Africa Battery Market?
The market segments include Type, Technology, Application, Geography.
4. Can you provide details about the market size?
The market size is estimated to be USD XX Million as of 2022.
5. What are some drivers contributing to market growth?
N/A
6. What are the notable trends driving market growth?
Lithium-ion Battery Segment Expected to be the Fastest-growing Market.
7. Are there any restraints impacting market growth?
N/A
8. Can you provide examples of recent developments in the market?
In February 2021, Winch Energy, an off-grid utility provider, completed the funding for solar mini-grid projects in 49 villages across Uganda and Sierra Leone. The project includes 6,000 portable batteries installed through the project to provide people outside of the mini-grid catchment area with clean electricity.
9. What pricing options are available for accessing the report?
Pricing options include single-user, multi-user, and enterprise licenses priced at USD 4750, USD 5250, and USD 8750 respectively.
10. Is the market size provided in terms of value or volume?
The market size is provided in terms of value, measured in Million.
11. Are there any specific market keywords associated with the report?
Yes, the market keyword associated with the report is "East Africa Battery Market," which aids in identifying and referencing the specific market segment covered.
12. How do I determine which pricing option suits my needs best?
The pricing options vary based on user requirements and access needs. Individual users may opt for single-user licenses, while businesses requiring broader access may choose multi-user or enterprise licenses for cost-effective access to the report.
13. Are there any additional resources or data provided in the East Africa Battery Market report?
While the report offers comprehensive insights, it's advisable to review the specific contents or supplementary materials provided to ascertain if additional resources or data are available.
14. How can I stay updated on further developments or reports in the East Africa Battery Market?
To stay informed about further developments, trends, and reports in the East Africa Battery Market, consider subscribing to industry newsletters, following relevant companies and organizations, or regularly checking reputable industry news sources and publications.
Methodology
Step 1 - Identification of Relevant Samples Size from Population Database


Step 2 - Approaches for Defining Global Market Size (Value, Volume* & Price*)

Note*: In applicable scenarios
Step 3 - Data Sources
Primary Research
- Web Analytics
- Survey Reports
- Research Institute
- Latest Research Reports
- Opinion Leaders
Secondary Research
- Annual Reports
- White Paper
- Latest Press Release
- Industry Association
- Paid Database
- Investor Presentations

Step 4 - Data Triangulation
Involves using different sources of information in order to increase the validity of a study
These sources are likely to be stakeholders in a program - participants, other researchers, program staff, other community members, and so on.
Then we put all data in single framework & apply various statistical tools to find out the dynamic on the market.
During the analysis stage, feedback from the stakeholder groups would be compared to determine areas of agreement as well as areas of divergence


