
Key Insights
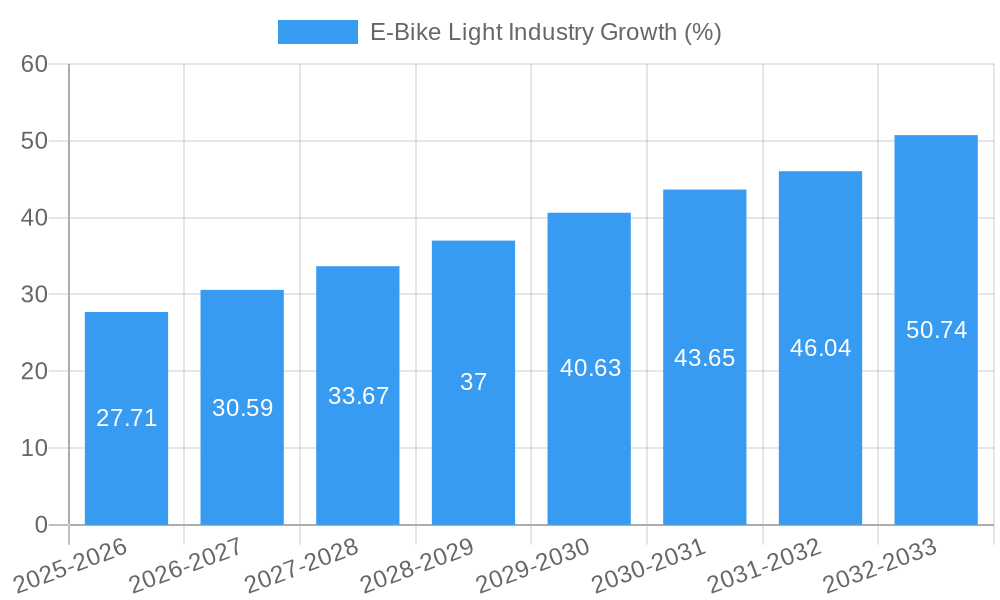
The e-bike light industry is experiencing robust growth, projected to reach a market size of $402.95 million in 2025 and maintain a Compound Annual Growth Rate (CAGR) exceeding 6.50% from 2025 to 2033. This expansion is fueled by several key drivers. The increasing popularity of e-bikes globally, driven by environmental concerns and the need for sustainable transportation, is a primary factor. Furthermore, advancements in LED technology are resulting in brighter, longer-lasting, and more energy-efficient lights, enhancing safety and rider experience. Government regulations mandating lighting on e-bikes in many regions are also contributing to market growth. The industry is segmented by light mounting (headlights, rear safety lights), sales channel (offline and online stores), and end-user (aftermarket and stock fitting). Online sales channels are experiencing rapid growth, driven by increased e-commerce penetration and the convenience of online purchasing. The aftermarket segment is also showing strong growth, as e-bike owners increasingly seek to upgrade their lighting systems for improved visibility and safety. Leading companies such as Spanninga Metaal B.V., D-light, and Supernova Design GmbH are driving innovation and competition within the market. Geographical analysis indicates strong growth across North America, Europe, and the Asia-Pacific region, with significant potential in emerging markets.
The continued growth of the e-bike market, coupled with increasing consumer awareness of safety features and a rising preference for high-quality lighting solutions, will further propel the e-bike light industry. The industry's focus on innovation, including the integration of smart features and improved durability, is expected to attract a wider range of consumers. While potential restraints such as fluctuating raw material prices and intense competition could impact growth, the overall outlook for the e-bike light industry remains positive, driven by consistent technological advancements and a growing demand for safer and more sustainable transportation solutions. The diverse product segments and strong regional presence suggest a robust and resilient market with considerable future potential.

E-Bike Light Industry Market Report: 2019-2033
This comprehensive report provides a detailed analysis of the E-bike Light industry, offering invaluable insights for industry professionals, investors, and strategic decision-makers. With a study period spanning 2019-2033, a base year of 2025, and a forecast period of 2025-2033, this report delivers a robust understanding of current market dynamics and future growth trajectories. The report covers key segments including Headlights, Rear Safety Lights, Offline and Online Sales Channels, and Aftermarket vs. Stock Fitting, analyzing market size in Million units.
E-Bike Light Industry Market Dynamics & Structure
This section delves into the intricate structure of the e-bike light market, analyzing market concentration, technological advancements, regulatory landscapes, competitive dynamics, and end-user demographics. The analysis incorporates quantitative data such as market share percentages and qualitative insights on factors influencing market growth. The report also examines M&A activity within the industry. The global e-bike light market is estimated at xx Million units in 2025.
- Market Concentration: The market exhibits a moderately concentrated structure, with a few major players holding significant market share. The top five players account for approximately xx% of the total market in 2025.
- Technological Innovation: Continuous innovation in LED technology, battery life, and light design is a major driver. The integration of smart features and connectivity is also gaining traction.
- Regulatory Frameworks: Government regulations regarding e-bike safety and lighting standards significantly impact market dynamics. Compliance costs and varying standards across regions pose challenges.
- Competitive Landscape: Intense competition exists among established players and new entrants, driving innovation and price pressures. Product differentiation and branding are crucial for success.
- End-User Demographics: The growing popularity of e-bikes across diverse demographics, including commuters, recreational users, and delivery services, fuels demand for e-bike lights.
- M&A Trends: The industry has witnessed xx M&A deals between 2019 and 2024, primarily focused on expanding product portfolios and market reach.
E-Bike Light Industry Growth Trends & Insights
This section leverages extensive market research to analyze the evolution of the e-bike light market size, adoption rates, technological disruptions, and changing consumer preferences. The analysis provides key performance indicators such as the Compound Annual Growth Rate (CAGR) and market penetration rates. The global market is projected to reach xx Million units by 2033, exhibiting a CAGR of xx% during the forecast period.
[Detailed paragraph analysis of market size evolution, adoption rates, technological disruptions, and consumer behavior shifts will be included here, incorporating specific metrics like CAGR and market penetration rates].
Dominant Regions, Countries, or Segments in E-Bike Light Industry
This section identifies the leading regions, countries, and segments driving market growth, based on data from By Light Mounting (Headlight, Rear Safety Light), By Sales Channel (Offline Stores, Online Stores), and By End-User (Aftermarket, Stock Fitting). The analysis focuses on market share, growth potential, and key drivers influencing market dominance.
- By Light Mounting: The Headlight segment dominates, holding a xx% market share in 2025, driven by safety regulations and consumer preference for enhanced visibility.
- By Sales Channel: Online stores are exhibiting faster growth than offline stores, with an increasing preference for e-commerce platforms among consumers.
- By End-User: The aftermarket segment holds a larger market share compared to stock fitting, owing to the rising popularity of e-bike customization. [Detailed paragraph analysis of regional and segmental dominance factors, including market share and growth potential will be included here.]
E-Bike Light Industry Product Landscape
The e-bike light market showcases diverse product innovations, encompassing advancements in LED technology, improved battery life, enhanced brightness, and integrated smart features. Products are categorized by features such as brightness (lumens), battery type, and mounting style. Unique selling propositions include integrated turn signals, daytime running lights, and USB charging capabilities. Technological advancements focus on improving energy efficiency, durability, and safety.
Key Drivers, Barriers & Challenges in E-Bike Light Industry
Key Drivers: The e-bike light market is propelled by factors such as stringent safety regulations, rising e-bike sales, growing consumer awareness of safety, and technological advancements in lighting technology.
Challenges & Restraints: Supply chain disruptions, fluctuating raw material prices, and intense competition pose significant challenges. Stringent regulatory compliance requirements and varying international standards also create hurdles.
Emerging Opportunities in E-Bike Light Industry
Emerging opportunities lie in untapped markets in developing economies, the integration of smart features and connectivity, and the development of sustainable and eco-friendly lighting solutions. The growing demand for customizable lighting options and the integration of e-bike lights with other smart devices also present significant opportunities.
Growth Accelerators in the E-Bike Light Industry
Technological breakthroughs, strategic partnerships and collaborations, market expansion into new geographical regions, and the increasing focus on product innovation are key accelerators for long-term growth in the e-bike light industry.
Key Players Shaping the E-Bike Light Industry Market
- Spanninga Metaal B V
- D-light
- Herrmans OY AB
- Supernova Design GmbH
- Gaciron Technology
- Magicshine
- Limeforge Ltd
- Lezyne
- Lord Benex
Notable Milestones in E-Bike Light Industry Sector
- December 2022: Magicshine introduced ME StVZO 100LUX E-BIKE LIGHT in India.
- March 2023: Upway, a French e-bike refurbisher, launched in the United States, expanding the market for refurbished e-bikes and potentially boosting the demand for replacement parts, including lights.
In-Depth E-Bike Light Industry Market Outlook
The future of the e-bike light industry is promising, driven by the continued growth of the e-bike market and ongoing technological advancements. Strategic partnerships, expansion into new markets, and a focus on product innovation will be crucial for success. The market is poised for significant growth, with substantial opportunities for players to capitalize on the increasing demand for high-quality, reliable, and innovative e-bike lighting solutions.
E-Bike Light Industry Segmentation
-
1. Light Mounting
- 1.1. Headlight
- 1.2. Rear Safety Light
-
2. Sales Channel
- 2.1. Offline Stores
- 2.2. Online Stores
-
3. End-User
- 3.1. Aftermarket
- 3.2. Stock Fitting
E-Bike Light Industry Segmentation By Geography
-
1. North America
- 1.1. United States
- 1.2. Canada
- 1.3. Rest of North America
-
2. Europe
- 2.1. Germany
- 2.2. United Kingdom
- 2.3. France
- 2.4. Russia
- 2.5. Spain
- 2.6. Rest of Europe
-
3. Asia Pacific
- 3.1. India
- 3.2. China
- 3.3. Japan
- 3.4. South Korea
- 3.5. Rest of Asia Pacific
-
4. Rest of the World
- 4.1. South America
- 4.2. Middle East and Africa

E-Bike Light Industry REPORT HIGHLIGHTS
| Aspects | Details |
|---|---|
| Study Period | 2019-2033 |
| Base Year | 2024 |
| Estimated Year | 2025 |
| Forecast Period | 2025-2033 |
| Historical Period | 2019-2024 |
| Growth Rate | CAGR of > 6.50% from 2019-2033 |
| Segmentation |
|
Table of Contents
- 1. Introduction
- 1.1. Research Scope
- 1.2. Market Segmentation
- 1.3. Research Methodology
- 1.4. Definitions and Assumptions
- 2. Executive Summary
- 2.1. Introduction
- 3. Market Dynamics
- 3.1. Introduction
- 3.2. Market Drivers
- 3.2.1. Rise in Sales of E-bikes
- 3.3. Market Restrains
- 3.3.1. High Cost of EV Solid-State Battery May Hamper the Growth of the Market
- 3.4. Market Trends
- 3.4.1. Growing Demand for E-bikes
- 4. Market Factor Analysis
- 4.1. Porters Five Forces
- 4.2. Supply/Value Chain
- 4.3. PESTEL analysis
- 4.4. Market Entropy
- 4.5. Patent/Trademark Analysis
- 5. Global E-Bike Light Industry Analysis, Insights and Forecast, 2019-2031
- 5.1. Market Analysis, Insights and Forecast - by Light Mounting
- 5.1.1. Headlight
- 5.1.2. Rear Safety Light
- 5.2. Market Analysis, Insights and Forecast - by Sales Channel
- 5.2.1. Offline Stores
- 5.2.2. Online Stores
- 5.3. Market Analysis, Insights and Forecast - by End-User
- 5.3.1. Aftermarket
- 5.3.2. Stock Fitting
- 5.4. Market Analysis, Insights and Forecast - by Region
- 5.4.1. North America
- 5.4.2. Europe
- 5.4.3. Asia Pacific
- 5.4.4. Rest of the World
- 5.1. Market Analysis, Insights and Forecast - by Light Mounting
- 6. North America E-Bike Light Industry Analysis, Insights and Forecast, 2019-2031
- 6.1. Market Analysis, Insights and Forecast - by Light Mounting
- 6.1.1. Headlight
- 6.1.2. Rear Safety Light
- 6.2. Market Analysis, Insights and Forecast - by Sales Channel
- 6.2.1. Offline Stores
- 6.2.2. Online Stores
- 6.3. Market Analysis, Insights and Forecast - by End-User
- 6.3.1. Aftermarket
- 6.3.2. Stock Fitting
- 6.1. Market Analysis, Insights and Forecast - by Light Mounting
- 7. Europe E-Bike Light Industry Analysis, Insights and Forecast, 2019-2031
- 7.1. Market Analysis, Insights and Forecast - by Light Mounting
- 7.1.1. Headlight
- 7.1.2. Rear Safety Light
- 7.2. Market Analysis, Insights and Forecast - by Sales Channel
- 7.2.1. Offline Stores
- 7.2.2. Online Stores
- 7.3. Market Analysis, Insights and Forecast - by End-User
- 7.3.1. Aftermarket
- 7.3.2. Stock Fitting
- 7.1. Market Analysis, Insights and Forecast - by Light Mounting
- 8. Asia Pacific E-Bike Light Industry Analysis, Insights and Forecast, 2019-2031
- 8.1. Market Analysis, Insights and Forecast - by Light Mounting
- 8.1.1. Headlight
- 8.1.2. Rear Safety Light
- 8.2. Market Analysis, Insights and Forecast - by Sales Channel
- 8.2.1. Offline Stores
- 8.2.2. Online Stores
- 8.3. Market Analysis, Insights and Forecast - by End-User
- 8.3.1. Aftermarket
- 8.3.2. Stock Fitting
- 8.1. Market Analysis, Insights and Forecast - by Light Mounting
- 9. Rest of the World E-Bike Light Industry Analysis, Insights and Forecast, 2019-2031
- 9.1. Market Analysis, Insights and Forecast - by Light Mounting
- 9.1.1. Headlight
- 9.1.2. Rear Safety Light
- 9.2. Market Analysis, Insights and Forecast - by Sales Channel
- 9.2.1. Offline Stores
- 9.2.2. Online Stores
- 9.3. Market Analysis, Insights and Forecast - by End-User
- 9.3.1. Aftermarket
- 9.3.2. Stock Fitting
- 9.1. Market Analysis, Insights and Forecast - by Light Mounting
- 10. North America E-Bike Light Industry Analysis, Insights and Forecast, 2019-2031
- 10.1. Market Analysis, Insights and Forecast - By Country/Sub-region
- 10.1.1 United States
- 10.1.2 Canada
- 10.1.3 Rest of North America
- 11. Europe E-Bike Light Industry Analysis, Insights and Forecast, 2019-2031
- 11.1. Market Analysis, Insights and Forecast - By Country/Sub-region
- 11.1.1 Germany
- 11.1.2 United Kingdom
- 11.1.3 France
- 11.1.4 Russia
- 11.1.5 Spain
- 11.1.6 Rest of Europe
- 12. Asia Pacific E-Bike Light Industry Analysis, Insights and Forecast, 2019-2031
- 12.1. Market Analysis, Insights and Forecast - By Country/Sub-region
- 12.1.1 India
- 12.1.2 China
- 12.1.3 Japan
- 12.1.4 South Korea
- 12.1.5 Rest of Asia Pacific
- 13. Rest of the World E-Bike Light Industry Analysis, Insights and Forecast, 2019-2031
- 13.1. Market Analysis, Insights and Forecast - By Country/Sub-region
- 13.1.1 South America
- 13.1.2 Middle East and Africa
- 14. Competitive Analysis
- 14.1. Global Market Share Analysis 2024
- 14.2. Company Profiles
- 14.2.1 Spanninga Metaal B V
- 14.2.1.1. Overview
- 14.2.1.2. Products
- 14.2.1.3. SWOT Analysis
- 14.2.1.4. Recent Developments
- 14.2.1.5. Financials (Based on Availability)
- 14.2.2 D-light
- 14.2.2.1. Overview
- 14.2.2.2. Products
- 14.2.2.3. SWOT Analysis
- 14.2.2.4. Recent Developments
- 14.2.2.5. Financials (Based on Availability)
- 14.2.3 Herrmans OY AB
- 14.2.3.1. Overview
- 14.2.3.2. Products
- 14.2.3.3. SWOT Analysis
- 14.2.3.4. Recent Developments
- 14.2.3.5. Financials (Based on Availability)
- 14.2.4 Supernova Design GmbH
- 14.2.4.1. Overview
- 14.2.4.2. Products
- 14.2.4.3. SWOT Analysis
- 14.2.4.4. Recent Developments
- 14.2.4.5. Financials (Based on Availability)
- 14.2.5 Gaciron Technology
- 14.2.5.1. Overview
- 14.2.5.2. Products
- 14.2.5.3. SWOT Analysis
- 14.2.5.4. Recent Developments
- 14.2.5.5. Financials (Based on Availability)
- 14.2.6 Magicshin
- 14.2.6.1. Overview
- 14.2.6.2. Products
- 14.2.6.3. SWOT Analysis
- 14.2.6.4. Recent Developments
- 14.2.6.5. Financials (Based on Availability)
- 14.2.7 Limeforge Ltd
- 14.2.7.1. Overview
- 14.2.7.2. Products
- 14.2.7.3. SWOT Analysis
- 14.2.7.4. Recent Developments
- 14.2.7.5. Financials (Based on Availability)
- 14.2.8 Lezyne
- 14.2.8.1. Overview
- 14.2.8.2. Products
- 14.2.8.3. SWOT Analysis
- 14.2.8.4. Recent Developments
- 14.2.8.5. Financials (Based on Availability)
- 14.2.9 Lord Benex
- 14.2.9.1. Overview
- 14.2.9.2. Products
- 14.2.9.3. SWOT Analysis
- 14.2.9.4. Recent Developments
- 14.2.9.5. Financials (Based on Availability)
- 14.2.1 Spanninga Metaal B V
List of Figures
- Figure 1: Global E-Bike Light Industry Revenue Breakdown (Million, %) by Region 2024 & 2032
- Figure 2: North America E-Bike Light Industry Revenue (Million), by Country 2024 & 2032
- Figure 3: North America E-Bike Light Industry Revenue Share (%), by Country 2024 & 2032
- Figure 4: Europe E-Bike Light Industry Revenue (Million), by Country 2024 & 2032
- Figure 5: Europe E-Bike Light Industry Revenue Share (%), by Country 2024 & 2032
- Figure 6: Asia Pacific E-Bike Light Industry Revenue (Million), by Country 2024 & 2032
- Figure 7: Asia Pacific E-Bike Light Industry Revenue Share (%), by Country 2024 & 2032
- Figure 8: Rest of the World E-Bike Light Industry Revenue (Million), by Country 2024 & 2032
- Figure 9: Rest of the World E-Bike Light Industry Revenue Share (%), by Country 2024 & 2032
- Figure 10: North America E-Bike Light Industry Revenue (Million), by Light Mounting 2024 & 2032
- Figure 11: North America E-Bike Light Industry Revenue Share (%), by Light Mounting 2024 & 2032
- Figure 12: North America E-Bike Light Industry Revenue (Million), by Sales Channel 2024 & 2032
- Figure 13: North America E-Bike Light Industry Revenue Share (%), by Sales Channel 2024 & 2032
- Figure 14: North America E-Bike Light Industry Revenue (Million), by End-User 2024 & 2032
- Figure 15: North America E-Bike Light Industry Revenue Share (%), by End-User 2024 & 2032
- Figure 16: North America E-Bike Light Industry Revenue (Million), by Country 2024 & 2032
- Figure 17: North America E-Bike Light Industry Revenue Share (%), by Country 2024 & 2032
- Figure 18: Europe E-Bike Light Industry Revenue (Million), by Light Mounting 2024 & 2032
- Figure 19: Europe E-Bike Light Industry Revenue Share (%), by Light Mounting 2024 & 2032
- Figure 20: Europe E-Bike Light Industry Revenue (Million), by Sales Channel 2024 & 2032
- Figure 21: Europe E-Bike Light Industry Revenue Share (%), by Sales Channel 2024 & 2032
- Figure 22: Europe E-Bike Light Industry Revenue (Million), by End-User 2024 & 2032
- Figure 23: Europe E-Bike Light Industry Revenue Share (%), by End-User 2024 & 2032
- Figure 24: Europe E-Bike Light Industry Revenue (Million), by Country 2024 & 2032
- Figure 25: Europe E-Bike Light Industry Revenue Share (%), by Country 2024 & 2032
- Figure 26: Asia Pacific E-Bike Light Industry Revenue (Million), by Light Mounting 2024 & 2032
- Figure 27: Asia Pacific E-Bike Light Industry Revenue Share (%), by Light Mounting 2024 & 2032
- Figure 28: Asia Pacific E-Bike Light Industry Revenue (Million), by Sales Channel 2024 & 2032
- Figure 29: Asia Pacific E-Bike Light Industry Revenue Share (%), by Sales Channel 2024 & 2032
- Figure 30: Asia Pacific E-Bike Light Industry Revenue (Million), by End-User 2024 & 2032
- Figure 31: Asia Pacific E-Bike Light Industry Revenue Share (%), by End-User 2024 & 2032
- Figure 32: Asia Pacific E-Bike Light Industry Revenue (Million), by Country 2024 & 2032
- Figure 33: Asia Pacific E-Bike Light Industry Revenue Share (%), by Country 2024 & 2032
- Figure 34: Rest of the World E-Bike Light Industry Revenue (Million), by Light Mounting 2024 & 2032
- Figure 35: Rest of the World E-Bike Light Industry Revenue Share (%), by Light Mounting 2024 & 2032
- Figure 36: Rest of the World E-Bike Light Industry Revenue (Million), by Sales Channel 2024 & 2032
- Figure 37: Rest of the World E-Bike Light Industry Revenue Share (%), by Sales Channel 2024 & 2032
- Figure 38: Rest of the World E-Bike Light Industry Revenue (Million), by End-User 2024 & 2032
- Figure 39: Rest of the World E-Bike Light Industry Revenue Share (%), by End-User 2024 & 2032
- Figure 40: Rest of the World E-Bike Light Industry Revenue (Million), by Country 2024 & 2032
- Figure 41: Rest of the World E-Bike Light Industry Revenue Share (%), by Country 2024 & 2032
List of Tables
- Table 1: Global E-Bike Light Industry Revenue Million Forecast, by Region 2019 & 2032
- Table 2: Global E-Bike Light Industry Revenue Million Forecast, by Light Mounting 2019 & 2032
- Table 3: Global E-Bike Light Industry Revenue Million Forecast, by Sales Channel 2019 & 2032
- Table 4: Global E-Bike Light Industry Revenue Million Forecast, by End-User 2019 & 2032
- Table 5: Global E-Bike Light Industry Revenue Million Forecast, by Region 2019 & 2032
- Table 6: Global E-Bike Light Industry Revenue Million Forecast, by Country 2019 & 2032
- Table 7: United States E-Bike Light Industry Revenue (Million) Forecast, by Application 2019 & 2032
- Table 8: Canada E-Bike Light Industry Revenue (Million) Forecast, by Application 2019 & 2032
- Table 9: Rest of North America E-Bike Light Industry Revenue (Million) Forecast, by Application 2019 & 2032
- Table 10: Global E-Bike Light Industry Revenue Million Forecast, by Country 2019 & 2032
- Table 11: Germany E-Bike Light Industry Revenue (Million) Forecast, by Application 2019 & 2032
- Table 12: United Kingdom E-Bike Light Industry Revenue (Million) Forecast, by Application 2019 & 2032
- Table 13: France E-Bike Light Industry Revenue (Million) Forecast, by Application 2019 & 2032
- Table 14: Russia E-Bike Light Industry Revenue (Million) Forecast, by Application 2019 & 2032
- Table 15: Spain E-Bike Light Industry Revenue (Million) Forecast, by Application 2019 & 2032
- Table 16: Rest of Europe E-Bike Light Industry Revenue (Million) Forecast, by Application 2019 & 2032
- Table 17: Global E-Bike Light Industry Revenue Million Forecast, by Country 2019 & 2032
- Table 18: India E-Bike Light Industry Revenue (Million) Forecast, by Application 2019 & 2032
- Table 19: China E-Bike Light Industry Revenue (Million) Forecast, by Application 2019 & 2032
- Table 20: Japan E-Bike Light Industry Revenue (Million) Forecast, by Application 2019 & 2032
- Table 21: South Korea E-Bike Light Industry Revenue (Million) Forecast, by Application 2019 & 2032
- Table 22: Rest of Asia Pacific E-Bike Light Industry Revenue (Million) Forecast, by Application 2019 & 2032
- Table 23: Global E-Bike Light Industry Revenue Million Forecast, by Country 2019 & 2032
- Table 24: South America E-Bike Light Industry Revenue (Million) Forecast, by Application 2019 & 2032
- Table 25: Middle East and Africa E-Bike Light Industry Revenue (Million) Forecast, by Application 2019 & 2032
- Table 26: Global E-Bike Light Industry Revenue Million Forecast, by Light Mounting 2019 & 2032
- Table 27: Global E-Bike Light Industry Revenue Million Forecast, by Sales Channel 2019 & 2032
- Table 28: Global E-Bike Light Industry Revenue Million Forecast, by End-User 2019 & 2032
- Table 29: Global E-Bike Light Industry Revenue Million Forecast, by Country 2019 & 2032
- Table 30: United States E-Bike Light Industry Revenue (Million) Forecast, by Application 2019 & 2032
- Table 31: Canada E-Bike Light Industry Revenue (Million) Forecast, by Application 2019 & 2032
- Table 32: Rest of North America E-Bike Light Industry Revenue (Million) Forecast, by Application 2019 & 2032
- Table 33: Global E-Bike Light Industry Revenue Million Forecast, by Light Mounting 2019 & 2032
- Table 34: Global E-Bike Light Industry Revenue Million Forecast, by Sales Channel 2019 & 2032
- Table 35: Global E-Bike Light Industry Revenue Million Forecast, by End-User 2019 & 2032
- Table 36: Global E-Bike Light Industry Revenue Million Forecast, by Country 2019 & 2032
- Table 37: Germany E-Bike Light Industry Revenue (Million) Forecast, by Application 2019 & 2032
- Table 38: United Kingdom E-Bike Light Industry Revenue (Million) Forecast, by Application 2019 & 2032
- Table 39: France E-Bike Light Industry Revenue (Million) Forecast, by Application 2019 & 2032
- Table 40: Russia E-Bike Light Industry Revenue (Million) Forecast, by Application 2019 & 2032
- Table 41: Spain E-Bike Light Industry Revenue (Million) Forecast, by Application 2019 & 2032
- Table 42: Rest of Europe E-Bike Light Industry Revenue (Million) Forecast, by Application 2019 & 2032
- Table 43: Global E-Bike Light Industry Revenue Million Forecast, by Light Mounting 2019 & 2032
- Table 44: Global E-Bike Light Industry Revenue Million Forecast, by Sales Channel 2019 & 2032
- Table 45: Global E-Bike Light Industry Revenue Million Forecast, by End-User 2019 & 2032
- Table 46: Global E-Bike Light Industry Revenue Million Forecast, by Country 2019 & 2032
- Table 47: India E-Bike Light Industry Revenue (Million) Forecast, by Application 2019 & 2032
- Table 48: China E-Bike Light Industry Revenue (Million) Forecast, by Application 2019 & 2032
- Table 49: Japan E-Bike Light Industry Revenue (Million) Forecast, by Application 2019 & 2032
- Table 50: South Korea E-Bike Light Industry Revenue (Million) Forecast, by Application 2019 & 2032
- Table 51: Rest of Asia Pacific E-Bike Light Industry Revenue (Million) Forecast, by Application 2019 & 2032
- Table 52: Global E-Bike Light Industry Revenue Million Forecast, by Light Mounting 2019 & 2032
- Table 53: Global E-Bike Light Industry Revenue Million Forecast, by Sales Channel 2019 & 2032
- Table 54: Global E-Bike Light Industry Revenue Million Forecast, by End-User 2019 & 2032
- Table 55: Global E-Bike Light Industry Revenue Million Forecast, by Country 2019 & 2032
- Table 56: South America E-Bike Light Industry Revenue (Million) Forecast, by Application 2019 & 2032
- Table 57: Middle East and Africa E-Bike Light Industry Revenue (Million) Forecast, by Application 2019 & 2032
Frequently Asked Questions
1. What is the projected Compound Annual Growth Rate (CAGR) of the E-Bike Light Industry?
The projected CAGR is approximately > 6.50%.
2. Which companies are prominent players in the E-Bike Light Industry?
Key companies in the market include Spanninga Metaal B V, D-light, Herrmans OY AB, Supernova Design GmbH, Gaciron Technology, Magicshin, Limeforge Ltd, Lezyne, Lord Benex.
3. What are the main segments of the E-Bike Light Industry?
The market segments include Light Mounting, Sales Channel, End-User.
4. Can you provide details about the market size?
The market size is estimated to be USD 402.95 Million as of 2022.
5. What are some drivers contributing to market growth?
Rise in Sales of E-bikes.
6. What are the notable trends driving market growth?
Growing Demand for E-bikes.
7. Are there any restraints impacting market growth?
High Cost of EV Solid-State Battery May Hamper the Growth of the Market.
8. Can you provide examples of recent developments in the market?
March 2023: Upway, the French refurbisher and reseller of electric bikes across various brands, launched in the United States. The company will focus its efforts on the Northeast region of the country. Still, its bikes will be available for shipping across the continental U.S. Upway already collaborates with major European e-bike brands such as VanMoof, Riese & Müller, and Gazelle. Still, it plans to extend its roster to include American bike brands such as Specialised, Cannondale, and Rad Power Bikes.
9. What pricing options are available for accessing the report?
Pricing options include single-user, multi-user, and enterprise licenses priced at USD 4750, USD 5250, and USD 8750 respectively.
10. Is the market size provided in terms of value or volume?
The market size is provided in terms of value, measured in Million.
11. Are there any specific market keywords associated with the report?
Yes, the market keyword associated with the report is "E-Bike Light Industry," which aids in identifying and referencing the specific market segment covered.
12. How do I determine which pricing option suits my needs best?
The pricing options vary based on user requirements and access needs. Individual users may opt for single-user licenses, while businesses requiring broader access may choose multi-user or enterprise licenses for cost-effective access to the report.
13. Are there any additional resources or data provided in the E-Bike Light Industry report?
While the report offers comprehensive insights, it's advisable to review the specific contents or supplementary materials provided to ascertain if additional resources or data are available.
14. How can I stay updated on further developments or reports in the E-Bike Light Industry?
To stay informed about further developments, trends, and reports in the E-Bike Light Industry, consider subscribing to industry newsletters, following relevant companies and organizations, or regularly checking reputable industry news sources and publications.
Methodology
Step 1 - Identification of Relevant Samples Size from Population Database


Step 2 - Approaches for Defining Global Market Size (Value, Volume* & Price*)

Note*: In applicable scenarios
Step 3 - Data Sources
Primary Research
- Web Analytics
- Survey Reports
- Research Institute
- Latest Research Reports
- Opinion Leaders
Secondary Research
- Annual Reports
- White Paper
- Latest Press Release
- Industry Association
- Paid Database
- Investor Presentations

Step 4 - Data Triangulation
Involves using different sources of information in order to increase the validity of a study
These sources are likely to be stakeholders in a program - participants, other researchers, program staff, other community members, and so on.
Then we put all data in single framework & apply various statistical tools to find out the dynamic on the market.
During the analysis stage, feedback from the stakeholder groups would be compared to determine areas of agreement as well as areas of divergence


