
Key Insights
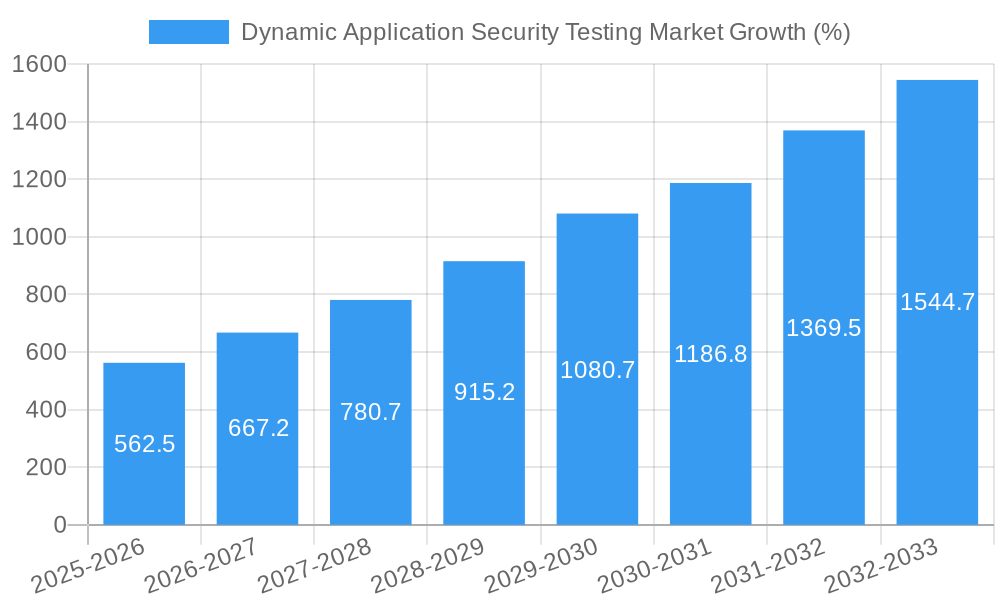
The Dynamic Application Security Testing (DAST) market is experiencing robust growth, projected to reach a market size of $3.04 billion in 2025, expanding at a Compound Annual Growth Rate (CAGR) of 18.74%. This expansion is fueled by the increasing prevalence of web and mobile applications, the rising adoption of cloud-based deployments, and the growing need for robust security measures across diverse industries. Key drivers include the escalating sophistication of cyberattacks, stringent regulatory compliance mandates (like GDPR and CCPA), and the heightened awareness of data breaches' financial and reputational consequences. The market is segmented by application type (web and mobile), deployment mode (cloud and on-premises), end-user vertical (IT & Telecom, Banking, Financial Services and Insurance, Oil & Gas, Government & Defense, Retail & e-commerce, Manufacturing), and organization size (SMEs and large enterprises). The cloud-based DAST segment is expected to witness the most significant growth due to its scalability, cost-effectiveness, and ease of integration. Geographically, North America currently holds a substantial market share, driven by the region's advanced technological infrastructure and early adoption of security solutions. However, the Asia-Pacific region is poised for rapid growth, propelled by increasing digitalization and a burgeoning IT sector.
The competitive landscape is characterized by a blend of established players like IBM, Micro Focus, and Checkmarx, alongside emerging innovative companies. These vendors are continuously enhancing their DAST solutions to incorporate advanced features like AI-powered vulnerability detection, automated remediation capabilities, and seamless integration with DevOps pipelines. While challenges such as the complexity of modern applications and the shortage of skilled cybersecurity professionals exist, the market's growth trajectory remains positive, driven by an unwavering need for secure software development and deployment across industries. The forecast period (2025-2033) suggests continued strong growth, fueled by emerging technologies like serverless computing and the increasing adoption of microservices architecture, which will demand more sophisticated and adaptable DAST solutions.

Dynamic Application Security Testing (DAST) Market: A Comprehensive Report (2019-2033)
This in-depth report provides a comprehensive analysis of the Dynamic Application Security Testing (DAST) market, encompassing market dynamics, growth trends, regional segmentation, product landscape, key players, and future outlook. The study period covers 2019-2033, with 2025 as the base and estimated year. The report leverages extensive primary and secondary research to deliver actionable insights for industry professionals, investors, and strategic decision-makers. The DAST market, a vital subset of the broader Application Security Testing market, is poised for significant growth, driven by increasing cyber threats and stringent regulatory compliance requirements.
Parent Market: Application Security Testing Market (xx Million) Child Market: Dynamic Application Security Testing Market (xx Million)
Dynamic Application Security Testing Market Market Dynamics & Structure
The DAST market is characterized by moderate concentration, with several major players holding significant market share. Technological innovation, particularly in areas like AI-powered vulnerability detection and automated testing, is a key driver. Stringent regulatory frameworks, such as GDPR and CCPA, are further fueling demand. The market witnesses continuous development of competitive product substitutes, including Static Application Security Testing (SAST) and Interactive Application Security Testing (IAST) solutions. End-user demographics are diverse, spanning various industry verticals and organization sizes. M&A activity has been relatively consistent, with larger players acquiring smaller companies to expand their product portfolios and market reach.
- Market Concentration: Moderately concentrated, with top 5 players holding approximately xx% market share in 2025.
- Technological Innovation: AI/ML integration, automated testing, and cloud-based solutions are driving innovation.
- Regulatory Frameworks: GDPR, CCPA, and other regulations are mandating robust security testing practices.
- Competitive Substitutes: SAST, IAST, and manual penetration testing present competitive alternatives.
- End-User Demographics: Diverse, including SMEs and large enterprises across various industry verticals.
- M&A Trends: Steady M&A activity, with approximately xx deals recorded between 2019 and 2024.
Dynamic Application Security Testing Market Growth Trends & Insights
The global DAST market experienced substantial growth during the historical period (2019-2024), expanding from xx million in 2019 to xx million in 2024, exhibiting a CAGR of xx%. This growth is attributed to rising adoption rates across diverse industry verticals, driven by increasing cyber threats and evolving security landscapes. Technological disruptions, such as the shift towards cloud-native applications and the adoption of DevOps methodologies, have further stimulated market growth. Consumer behavior shifts, characterized by increased awareness of data privacy and security risks, have contributed significantly to the market's expansion. The forecast period (2025-2033) projects continued expansion, with a projected CAGR of xx%, driven by factors such as increasing adoption of cloud-based DAST solutions, the rise of AI-powered security tools, and growing demand for secure software development practices. Market penetration in key industry verticals, particularly IT & Telecom, Banking, Financial Services and Insurance, and Government and Defense, is expected to increase steadily during the forecast period.
Dominant Regions, Countries, or Segments in Dynamic Application Security Testing Market
North America currently holds the largest market share in the DAST market, driven by early adoption of advanced security technologies, robust IT infrastructure, and a high concentration of major players. Europe follows closely, with strong regulatory pressure and a growing awareness of cybersecurity threats contributing to market growth. Within the segmentation, the web application segment dominates the market due to its prevalence and vulnerability to various attacks. Cloud-based deployment is witnessing the fastest growth due to its scalability and cost-effectiveness. The banking, financial services, and insurance (BFSI) sector exhibits the highest demand for DAST solutions owing to stringent regulatory compliance requirements and the high sensitivity of financial data. Large enterprises represent a significant portion of the market due to their increased resources and risk exposure.
- Key Drivers:
- North America: Strong technological advancement, robust IT infrastructure, stringent regulations.
- Europe: Stringent data privacy regulations (GDPR), growing cybersecurity awareness.
- Asia-Pacific: Rapid economic growth, increasing digitalization, government initiatives.
- Web Applications: High prevalence, wide range of vulnerabilities.
- Cloud Deployment: Scalability, cost-effectiveness, ease of integration.
- BFSI Sector: Stringent regulatory compliance, high sensitivity of data.
- Large Enterprises: Higher budgets, greater risk exposure, sophisticated security needs.
Dynamic Application Security Testing Market Product Landscape
The DAST market offers a diverse range of products, from basic vulnerability scanners to sophisticated AI-powered solutions integrating into CI/CD pipelines. Products are differentiated by features like automation levels, integration capabilities, the types of vulnerabilities detected, and reporting functionalities. Recent advancements include enhanced accuracy in vulnerability detection, improved integration with DevOps workflows, and the emergence of cloud-based SaaS platforms. The unique selling propositions (USPs) of various products often include ease of use, comprehensive reporting, and integration with other security tools. The market is characterized by continuous improvements in accuracy, speed, and ease of implementation, reflecting the ongoing efforts to make DAST more accessible and effective for various user skill levels.
Key Drivers, Barriers & Challenges in Dynamic Application Security Testing Market
Key Drivers: The rising incidence of cyberattacks, stringent government regulations, the increasing adoption of cloud computing, and the need for continuous integration/continuous delivery (CI/CD) pipelines are pushing the DAST market growth. The adoption of Agile and DevOps methodologies also necessitates automated security testing like DAST.
Challenges and Restraints: The high cost of implementation, the complexity of integrating DAST tools into existing infrastructure, and the potential for false positives can hinder market adoption. The shortage of skilled cybersecurity professionals capable of interpreting DAST results also presents a challenge. Furthermore, the constant evolution of attack vectors requires continuous updates and improvements to DAST tools, adding to costs and complexity. The competitive landscape, with many established and emerging players, is another factor to consider.
Emerging Opportunities in Dynamic Application Security Testing Market
The growing adoption of IoT devices and the expansion of 5G networks present significant opportunities. Integration of AI and ML for improved accuracy and automation is another key trend. The demand for DAST solutions tailored to specific industry verticals and the potential for expanding into emerging markets (e.g., Africa, South America) represent further growth areas. The development of more user-friendly interfaces to cater to a broader range of users is also an emerging opportunity.
Growth Accelerators in the Dynamic Application Security Testing Market Industry
Strategic partnerships between DAST providers and other security vendors are accelerating market growth by enabling integrated solutions. Technological breakthroughs in AI and machine learning continue to enhance the accuracy and efficiency of DAST tools. The expansion of cloud-based DAST solutions, coupled with flexible pricing models, makes the technology accessible to a wider range of organizations. Increased awareness among businesses about the significance of application security and its link to operational resilience is contributing significantly to market growth.
Key Players Shaping the Dynamic Application Security Testing Market Market
- Detectify
- IBM Corporation
- Microfocus
- GitLab
- HCL
- Veracode
- Acunetix
- Intruder
- Checkmarx
- Indusface
Notable Milestones in Dynamic Application Security Testing Market Sector
- November 2023: Veracode released the beta version of its DAST Essentials tool and a Veracode GitHub application for automated code checking. This signifies a push towards more streamlined DAST integration into development workflows.
- April 2023: Synopsys announced plans to integrate DAST capabilities into its Polaris platform. This highlights the growing trend of incorporating DAST into broader software integrity platforms.
In-Depth Dynamic Application Security Testing Market Market Outlook
The future of the DAST market looks promising. Continued technological advancements, coupled with increasing awareness of application security risks, will drive significant market growth. Strategic partnerships, product innovation, and expansion into new geographical territories will further propel market expansion. The rising demand for cloud-based solutions and the integration of AI/ML will continue shaping the market landscape, opening up new opportunities for players focusing on innovation and addressing evolving cybersecurity threats. The overall potential for growth is substantial, offering significant returns on investment for companies operating within this dynamic sector.
Dynamic Application Security Testing Market Segmentation
-
1. Bye Application Type
- 1.1. Web
- 1.2. Mobile
-
2. Deployment Mode*
- 2.1. Cloud
- 2.2. On-premises
-
3. End-user Vertical
- 3.1. Banking, Financial Services, and Insurance
- 3.2. Oil, Gas and Energy
- 3.3. Government and Defense
- 3.4. Retail & e-commerce
- 3.5. Manufacturing
-
4. Organization Size
- 4.1. SMEs
- 4.2. Large Enterprises
Dynamic Application Security Testing Market Segmentation By Geography
- 1. North America
- 2. Europe
- 3. Asia Pacific
- 4. Rest of World

Dynamic Application Security Testing Market REPORT HIGHLIGHTS
| Aspects | Details |
|---|---|
| Study Period | 2019-2033 |
| Base Year | 2024 |
| Estimated Year | 2025 |
| Forecast Period | 2025-2033 |
| Historical Period | 2019-2024 |
| Growth Rate | CAGR of 18.74% from 2019-2033 |
| Segmentation |
|
Table of Contents
- 1. Introduction
- 1.1. Research Scope
- 1.2. Market Segmentation
- 1.3. Research Methodology
- 1.4. Definitions and Assumptions
- 2. Executive Summary
- 2.1. Introduction
- 3. Market Dynamics
- 3.1. Introduction
- 3.2. Market Drivers
- 3.2.1. Digital transformation technologies and IoT; High potential damages from attacks and increasing sophistication of attacks; Rising web and mobile applications
- 3.3. Market Restrains
- 3.3.1. Concerns Associated With Data Privacy And Security; Lack of Standardized Protocols and Frameworks for IoT Deployments
- 3.4. Market Trends
- 3.4.1. BFSI is Expected to Witness Significant Growth
- 4. Market Factor Analysis
- 4.1. Porters Five Forces
- 4.2. Supply/Value Chain
- 4.3. PESTEL analysis
- 4.4. Market Entropy
- 4.5. Patent/Trademark Analysis
- 5. Global Dynamic Application Security Testing Market Analysis, Insights and Forecast, 2019-2031
- 5.1. Market Analysis, Insights and Forecast - by Bye Application Type
- 5.1.1. Web
- 5.1.2. Mobile
- 5.2. Market Analysis, Insights and Forecast - by Deployment Mode*
- 5.2.1. Cloud
- 5.2.2. On-premises
- 5.3. Market Analysis, Insights and Forecast - by End-user Vertical
- 5.3.1. Banking, Financial Services, and Insurance
- 5.3.2. Oil, Gas and Energy
- 5.3.3. Government and Defense
- 5.3.4. Retail & e-commerce
- 5.3.5. Manufacturing
- 5.4. Market Analysis, Insights and Forecast - by Organization Size
- 5.4.1. SMEs
- 5.4.2. Large Enterprises
- 5.5. Market Analysis, Insights and Forecast - by Region
- 5.5.1. North America
- 5.5.2. Europe
- 5.5.3. Asia Pacific
- 5.5.4. Rest of World
- 5.1. Market Analysis, Insights and Forecast - by Bye Application Type
- 6. North America Dynamic Application Security Testing Market Analysis, Insights and Forecast, 2019-2031
- 6.1. Market Analysis, Insights and Forecast - by Bye Application Type
- 6.1.1. Web
- 6.1.2. Mobile
- 6.2. Market Analysis, Insights and Forecast - by Deployment Mode*
- 6.2.1. Cloud
- 6.2.2. On-premises
- 6.3. Market Analysis, Insights and Forecast - by End-user Vertical
- 6.3.1. Banking, Financial Services, and Insurance
- 6.3.2. Oil, Gas and Energy
- 6.3.3. Government and Defense
- 6.3.4. Retail & e-commerce
- 6.3.5. Manufacturing
- 6.4. Market Analysis, Insights and Forecast - by Organization Size
- 6.4.1. SMEs
- 6.4.2. Large Enterprises
- 6.1. Market Analysis, Insights and Forecast - by Bye Application Type
- 7. Europe Dynamic Application Security Testing Market Analysis, Insights and Forecast, 2019-2031
- 7.1. Market Analysis, Insights and Forecast - by Bye Application Type
- 7.1.1. Web
- 7.1.2. Mobile
- 7.2. Market Analysis, Insights and Forecast - by Deployment Mode*
- 7.2.1. Cloud
- 7.2.2. On-premises
- 7.3. Market Analysis, Insights and Forecast - by End-user Vertical
- 7.3.1. Banking, Financial Services, and Insurance
- 7.3.2. Oil, Gas and Energy
- 7.3.3. Government and Defense
- 7.3.4. Retail & e-commerce
- 7.3.5. Manufacturing
- 7.4. Market Analysis, Insights and Forecast - by Organization Size
- 7.4.1. SMEs
- 7.4.2. Large Enterprises
- 7.1. Market Analysis, Insights and Forecast - by Bye Application Type
- 8. Asia Pacific Dynamic Application Security Testing Market Analysis, Insights and Forecast, 2019-2031
- 8.1. Market Analysis, Insights and Forecast - by Bye Application Type
- 8.1.1. Web
- 8.1.2. Mobile
- 8.2. Market Analysis, Insights and Forecast - by Deployment Mode*
- 8.2.1. Cloud
- 8.2.2. On-premises
- 8.3. Market Analysis, Insights and Forecast - by End-user Vertical
- 8.3.1. Banking, Financial Services, and Insurance
- 8.3.2. Oil, Gas and Energy
- 8.3.3. Government and Defense
- 8.3.4. Retail & e-commerce
- 8.3.5. Manufacturing
- 8.4. Market Analysis, Insights and Forecast - by Organization Size
- 8.4.1. SMEs
- 8.4.2. Large Enterprises
- 8.1. Market Analysis, Insights and Forecast - by Bye Application Type
- 9. Rest of World Dynamic Application Security Testing Market Analysis, Insights and Forecast, 2019-2031
- 9.1. Market Analysis, Insights and Forecast - by Bye Application Type
- 9.1.1. Web
- 9.1.2. Mobile
- 9.2. Market Analysis, Insights and Forecast - by Deployment Mode*
- 9.2.1. Cloud
- 9.2.2. On-premises
- 9.3. Market Analysis, Insights and Forecast - by End-user Vertical
- 9.3.1. Banking, Financial Services, and Insurance
- 9.3.2. Oil, Gas and Energy
- 9.3.3. Government and Defense
- 9.3.4. Retail & e-commerce
- 9.3.5. Manufacturing
- 9.4. Market Analysis, Insights and Forecast - by Organization Size
- 9.4.1. SMEs
- 9.4.2. Large Enterprises
- 9.1. Market Analysis, Insights and Forecast - by Bye Application Type
- 10. North America Dynamic Application Security Testing Market Analysis, Insights and Forecast, 2019-2031
- 10.1. Market Analysis, Insights and Forecast - By Country/Sub-region
- 10.1.1 United States
- 10.1.2 Canada
- 10.1.3 Mexico
- 11. Europe Dynamic Application Security Testing Market Analysis, Insights and Forecast, 2019-2031
- 11.1. Market Analysis, Insights and Forecast - By Country/Sub-region
- 11.1.1 Germany
- 11.1.2 United Kingdom
- 11.1.3 France
- 11.1.4 Spain
- 11.1.5 Italy
- 11.1.6 Spain
- 11.1.7 Belgium
- 11.1.8 Netherland
- 11.1.9 Nordics
- 11.1.10 Rest of Europe
- 12. Asia Pacific Dynamic Application Security Testing Market Analysis, Insights and Forecast, 2019-2031
- 12.1. Market Analysis, Insights and Forecast - By Country/Sub-region
- 12.1.1 China
- 12.1.2 Japan
- 12.1.3 India
- 12.1.4 South Korea
- 12.1.5 Southeast Asia
- 12.1.6 Australia
- 12.1.7 Indonesia
- 12.1.8 Phillipes
- 12.1.9 Singapore
- 12.1.10 Thailandc
- 12.1.11 Rest of Asia Pacific
- 13. South America Dynamic Application Security Testing Market Analysis, Insights and Forecast, 2019-2031
- 13.1. Market Analysis, Insights and Forecast - By Country/Sub-region
- 13.1.1 Brazil
- 13.1.2 Argentina
- 13.1.3 Peru
- 13.1.4 Chile
- 13.1.5 Colombia
- 13.1.6 Ecuador
- 13.1.7 Venezuela
- 13.1.8 Rest of South America
- 14. North America Dynamic Application Security Testing Market Analysis, Insights and Forecast, 2019-2031
- 14.1. Market Analysis, Insights and Forecast - By Country/Sub-region
- 14.1.1 United States
- 14.1.2 Canada
- 14.1.3 Mexico
- 15. MEA Dynamic Application Security Testing Market Analysis, Insights and Forecast, 2019-2031
- 15.1. Market Analysis, Insights and Forecast - By Country/Sub-region
- 15.1.1 United Arab Emirates
- 15.1.2 Saudi Arabia
- 15.1.3 South Africa
- 15.1.4 Rest of Middle East and Africa
- 16. Competitive Analysis
- 16.1. Global Market Share Analysis 2024
- 16.2. Company Profiles
- 16.2.1 Detectifty*List Not Exhaustive
- 16.2.1.1. Overview
- 16.2.1.2. Products
- 16.2.1.3. SWOT Analysis
- 16.2.1.4. Recent Developments
- 16.2.1.5. Financials (Based on Availability)
- 16.2.2 IBM Corporation
- 16.2.2.1. Overview
- 16.2.2.2. Products
- 16.2.2.3. SWOT Analysis
- 16.2.2.4. Recent Developments
- 16.2.2.5. Financials (Based on Availability)
- 16.2.3 Microfocus
- 16.2.3.1. Overview
- 16.2.3.2. Products
- 16.2.3.3. SWOT Analysis
- 16.2.3.4. Recent Developments
- 16.2.3.5. Financials (Based on Availability)
- 16.2.4 GitLab
- 16.2.4.1. Overview
- 16.2.4.2. Products
- 16.2.4.3. SWOT Analysis
- 16.2.4.4. Recent Developments
- 16.2.4.5. Financials (Based on Availability)
- 16.2.5 HCL
- 16.2.5.1. Overview
- 16.2.5.2. Products
- 16.2.5.3. SWOT Analysis
- 16.2.5.4. Recent Developments
- 16.2.5.5. Financials (Based on Availability)
- 16.2.6 Veracode
- 16.2.6.1. Overview
- 16.2.6.2. Products
- 16.2.6.3. SWOT Analysis
- 16.2.6.4. Recent Developments
- 16.2.6.5. Financials (Based on Availability)
- 16.2.7 Acunetix
- 16.2.7.1. Overview
- 16.2.7.2. Products
- 16.2.7.3. SWOT Analysis
- 16.2.7.4. Recent Developments
- 16.2.7.5. Financials (Based on Availability)
- 16.2.8 Intruder
- 16.2.8.1. Overview
- 16.2.8.2. Products
- 16.2.8.3. SWOT Analysis
- 16.2.8.4. Recent Developments
- 16.2.8.5. Financials (Based on Availability)
- 16.2.9 Checkmarx
- 16.2.9.1. Overview
- 16.2.9.2. Products
- 16.2.9.3. SWOT Analysis
- 16.2.9.4. Recent Developments
- 16.2.9.5. Financials (Based on Availability)
- 16.2.10 Indusface
- 16.2.10.1. Overview
- 16.2.10.2. Products
- 16.2.10.3. SWOT Analysis
- 16.2.10.4. Recent Developments
- 16.2.10.5. Financials (Based on Availability)
- 16.2.1 Detectifty*List Not Exhaustive
List of Figures
- Figure 1: Global Dynamic Application Security Testing Market Revenue Breakdown (Million, %) by Region 2024 & 2032
- Figure 2: North America Dynamic Application Security Testing Market Revenue (Million), by Country 2024 & 2032
- Figure 3: North America Dynamic Application Security Testing Market Revenue Share (%), by Country 2024 & 2032
- Figure 4: Europe Dynamic Application Security Testing Market Revenue (Million), by Country 2024 & 2032
- Figure 5: Europe Dynamic Application Security Testing Market Revenue Share (%), by Country 2024 & 2032
- Figure 6: Asia Pacific Dynamic Application Security Testing Market Revenue (Million), by Country 2024 & 2032
- Figure 7: Asia Pacific Dynamic Application Security Testing Market Revenue Share (%), by Country 2024 & 2032
- Figure 8: South America Dynamic Application Security Testing Market Revenue (Million), by Country 2024 & 2032
- Figure 9: South America Dynamic Application Security Testing Market Revenue Share (%), by Country 2024 & 2032
- Figure 10: North America Dynamic Application Security Testing Market Revenue (Million), by Country 2024 & 2032
- Figure 11: North America Dynamic Application Security Testing Market Revenue Share (%), by Country 2024 & 2032
- Figure 12: MEA Dynamic Application Security Testing Market Revenue (Million), by Country 2024 & 2032
- Figure 13: MEA Dynamic Application Security Testing Market Revenue Share (%), by Country 2024 & 2032
- Figure 14: North America Dynamic Application Security Testing Market Revenue (Million), by Bye Application Type 2024 & 2032
- Figure 15: North America Dynamic Application Security Testing Market Revenue Share (%), by Bye Application Type 2024 & 2032
- Figure 16: North America Dynamic Application Security Testing Market Revenue (Million), by Deployment Mode* 2024 & 2032
- Figure 17: North America Dynamic Application Security Testing Market Revenue Share (%), by Deployment Mode* 2024 & 2032
- Figure 18: North America Dynamic Application Security Testing Market Revenue (Million), by End-user Vertical 2024 & 2032
- Figure 19: North America Dynamic Application Security Testing Market Revenue Share (%), by End-user Vertical 2024 & 2032
- Figure 20: North America Dynamic Application Security Testing Market Revenue (Million), by Organization Size 2024 & 2032
- Figure 21: North America Dynamic Application Security Testing Market Revenue Share (%), by Organization Size 2024 & 2032
- Figure 22: North America Dynamic Application Security Testing Market Revenue (Million), by Country 2024 & 2032
- Figure 23: North America Dynamic Application Security Testing Market Revenue Share (%), by Country 2024 & 2032
- Figure 24: Europe Dynamic Application Security Testing Market Revenue (Million), by Bye Application Type 2024 & 2032
- Figure 25: Europe Dynamic Application Security Testing Market Revenue Share (%), by Bye Application Type 2024 & 2032
- Figure 26: Europe Dynamic Application Security Testing Market Revenue (Million), by Deployment Mode* 2024 & 2032
- Figure 27: Europe Dynamic Application Security Testing Market Revenue Share (%), by Deployment Mode* 2024 & 2032
- Figure 28: Europe Dynamic Application Security Testing Market Revenue (Million), by End-user Vertical 2024 & 2032
- Figure 29: Europe Dynamic Application Security Testing Market Revenue Share (%), by End-user Vertical 2024 & 2032
- Figure 30: Europe Dynamic Application Security Testing Market Revenue (Million), by Organization Size 2024 & 2032
- Figure 31: Europe Dynamic Application Security Testing Market Revenue Share (%), by Organization Size 2024 & 2032
- Figure 32: Europe Dynamic Application Security Testing Market Revenue (Million), by Country 2024 & 2032
- Figure 33: Europe Dynamic Application Security Testing Market Revenue Share (%), by Country 2024 & 2032
- Figure 34: Asia Pacific Dynamic Application Security Testing Market Revenue (Million), by Bye Application Type 2024 & 2032
- Figure 35: Asia Pacific Dynamic Application Security Testing Market Revenue Share (%), by Bye Application Type 2024 & 2032
- Figure 36: Asia Pacific Dynamic Application Security Testing Market Revenue (Million), by Deployment Mode* 2024 & 2032
- Figure 37: Asia Pacific Dynamic Application Security Testing Market Revenue Share (%), by Deployment Mode* 2024 & 2032
- Figure 38: Asia Pacific Dynamic Application Security Testing Market Revenue (Million), by End-user Vertical 2024 & 2032
- Figure 39: Asia Pacific Dynamic Application Security Testing Market Revenue Share (%), by End-user Vertical 2024 & 2032
- Figure 40: Asia Pacific Dynamic Application Security Testing Market Revenue (Million), by Organization Size 2024 & 2032
- Figure 41: Asia Pacific Dynamic Application Security Testing Market Revenue Share (%), by Organization Size 2024 & 2032
- Figure 42: Asia Pacific Dynamic Application Security Testing Market Revenue (Million), by Country 2024 & 2032
- Figure 43: Asia Pacific Dynamic Application Security Testing Market Revenue Share (%), by Country 2024 & 2032
- Figure 44: Rest of World Dynamic Application Security Testing Market Revenue (Million), by Bye Application Type 2024 & 2032
- Figure 45: Rest of World Dynamic Application Security Testing Market Revenue Share (%), by Bye Application Type 2024 & 2032
- Figure 46: Rest of World Dynamic Application Security Testing Market Revenue (Million), by Deployment Mode* 2024 & 2032
- Figure 47: Rest of World Dynamic Application Security Testing Market Revenue Share (%), by Deployment Mode* 2024 & 2032
- Figure 48: Rest of World Dynamic Application Security Testing Market Revenue (Million), by End-user Vertical 2024 & 2032
- Figure 49: Rest of World Dynamic Application Security Testing Market Revenue Share (%), by End-user Vertical 2024 & 2032
- Figure 50: Rest of World Dynamic Application Security Testing Market Revenue (Million), by Organization Size 2024 & 2032
- Figure 51: Rest of World Dynamic Application Security Testing Market Revenue Share (%), by Organization Size 2024 & 2032
- Figure 52: Rest of World Dynamic Application Security Testing Market Revenue (Million), by Country 2024 & 2032
- Figure 53: Rest of World Dynamic Application Security Testing Market Revenue Share (%), by Country 2024 & 2032
List of Tables
- Table 1: Global Dynamic Application Security Testing Market Revenue Million Forecast, by Region 2019 & 2032
- Table 2: Global Dynamic Application Security Testing Market Revenue Million Forecast, by Bye Application Type 2019 & 2032
- Table 3: Global Dynamic Application Security Testing Market Revenue Million Forecast, by Deployment Mode* 2019 & 2032
- Table 4: Global Dynamic Application Security Testing Market Revenue Million Forecast, by End-user Vertical 2019 & 2032
- Table 5: Global Dynamic Application Security Testing Market Revenue Million Forecast, by Organization Size 2019 & 2032
- Table 6: Global Dynamic Application Security Testing Market Revenue Million Forecast, by Region 2019 & 2032
- Table 7: Global Dynamic Application Security Testing Market Revenue Million Forecast, by Country 2019 & 2032
- Table 8: United States Dynamic Application Security Testing Market Revenue (Million) Forecast, by Application 2019 & 2032
- Table 9: Canada Dynamic Application Security Testing Market Revenue (Million) Forecast, by Application 2019 & 2032
- Table 10: Mexico Dynamic Application Security Testing Market Revenue (Million) Forecast, by Application 2019 & 2032
- Table 11: Global Dynamic Application Security Testing Market Revenue Million Forecast, by Country 2019 & 2032
- Table 12: Germany Dynamic Application Security Testing Market Revenue (Million) Forecast, by Application 2019 & 2032
- Table 13: United Kingdom Dynamic Application Security Testing Market Revenue (Million) Forecast, by Application 2019 & 2032
- Table 14: France Dynamic Application Security Testing Market Revenue (Million) Forecast, by Application 2019 & 2032
- Table 15: Spain Dynamic Application Security Testing Market Revenue (Million) Forecast, by Application 2019 & 2032
- Table 16: Italy Dynamic Application Security Testing Market Revenue (Million) Forecast, by Application 2019 & 2032
- Table 17: Spain Dynamic Application Security Testing Market Revenue (Million) Forecast, by Application 2019 & 2032
- Table 18: Belgium Dynamic Application Security Testing Market Revenue (Million) Forecast, by Application 2019 & 2032
- Table 19: Netherland Dynamic Application Security Testing Market Revenue (Million) Forecast, by Application 2019 & 2032
- Table 20: Nordics Dynamic Application Security Testing Market Revenue (Million) Forecast, by Application 2019 & 2032
- Table 21: Rest of Europe Dynamic Application Security Testing Market Revenue (Million) Forecast, by Application 2019 & 2032
- Table 22: Global Dynamic Application Security Testing Market Revenue Million Forecast, by Country 2019 & 2032
- Table 23: China Dynamic Application Security Testing Market Revenue (Million) Forecast, by Application 2019 & 2032
- Table 24: Japan Dynamic Application Security Testing Market Revenue (Million) Forecast, by Application 2019 & 2032
- Table 25: India Dynamic Application Security Testing Market Revenue (Million) Forecast, by Application 2019 & 2032
- Table 26: South Korea Dynamic Application Security Testing Market Revenue (Million) Forecast, by Application 2019 & 2032
- Table 27: Southeast Asia Dynamic Application Security Testing Market Revenue (Million) Forecast, by Application 2019 & 2032
- Table 28: Australia Dynamic Application Security Testing Market Revenue (Million) Forecast, by Application 2019 & 2032
- Table 29: Indonesia Dynamic Application Security Testing Market Revenue (Million) Forecast, by Application 2019 & 2032
- Table 30: Phillipes Dynamic Application Security Testing Market Revenue (Million) Forecast, by Application 2019 & 2032
- Table 31: Singapore Dynamic Application Security Testing Market Revenue (Million) Forecast, by Application 2019 & 2032
- Table 32: Thailandc Dynamic Application Security Testing Market Revenue (Million) Forecast, by Application 2019 & 2032
- Table 33: Rest of Asia Pacific Dynamic Application Security Testing Market Revenue (Million) Forecast, by Application 2019 & 2032
- Table 34: Global Dynamic Application Security Testing Market Revenue Million Forecast, by Country 2019 & 2032
- Table 35: Brazil Dynamic Application Security Testing Market Revenue (Million) Forecast, by Application 2019 & 2032
- Table 36: Argentina Dynamic Application Security Testing Market Revenue (Million) Forecast, by Application 2019 & 2032
- Table 37: Peru Dynamic Application Security Testing Market Revenue (Million) Forecast, by Application 2019 & 2032
- Table 38: Chile Dynamic Application Security Testing Market Revenue (Million) Forecast, by Application 2019 & 2032
- Table 39: Colombia Dynamic Application Security Testing Market Revenue (Million) Forecast, by Application 2019 & 2032
- Table 40: Ecuador Dynamic Application Security Testing Market Revenue (Million) Forecast, by Application 2019 & 2032
- Table 41: Venezuela Dynamic Application Security Testing Market Revenue (Million) Forecast, by Application 2019 & 2032
- Table 42: Rest of South America Dynamic Application Security Testing Market Revenue (Million) Forecast, by Application 2019 & 2032
- Table 43: Global Dynamic Application Security Testing Market Revenue Million Forecast, by Country 2019 & 2032
- Table 44: United States Dynamic Application Security Testing Market Revenue (Million) Forecast, by Application 2019 & 2032
- Table 45: Canada Dynamic Application Security Testing Market Revenue (Million) Forecast, by Application 2019 & 2032
- Table 46: Mexico Dynamic Application Security Testing Market Revenue (Million) Forecast, by Application 2019 & 2032
- Table 47: Global Dynamic Application Security Testing Market Revenue Million Forecast, by Country 2019 & 2032
- Table 48: United Arab Emirates Dynamic Application Security Testing Market Revenue (Million) Forecast, by Application 2019 & 2032
- Table 49: Saudi Arabia Dynamic Application Security Testing Market Revenue (Million) Forecast, by Application 2019 & 2032
- Table 50: South Africa Dynamic Application Security Testing Market Revenue (Million) Forecast, by Application 2019 & 2032
- Table 51: Rest of Middle East and Africa Dynamic Application Security Testing Market Revenue (Million) Forecast, by Application 2019 & 2032
- Table 52: Global Dynamic Application Security Testing Market Revenue Million Forecast, by Bye Application Type 2019 & 2032
- Table 53: Global Dynamic Application Security Testing Market Revenue Million Forecast, by Deployment Mode* 2019 & 2032
- Table 54: Global Dynamic Application Security Testing Market Revenue Million Forecast, by End-user Vertical 2019 & 2032
- Table 55: Global Dynamic Application Security Testing Market Revenue Million Forecast, by Organization Size 2019 & 2032
- Table 56: Global Dynamic Application Security Testing Market Revenue Million Forecast, by Country 2019 & 2032
- Table 57: Global Dynamic Application Security Testing Market Revenue Million Forecast, by Bye Application Type 2019 & 2032
- Table 58: Global Dynamic Application Security Testing Market Revenue Million Forecast, by Deployment Mode* 2019 & 2032
- Table 59: Global Dynamic Application Security Testing Market Revenue Million Forecast, by End-user Vertical 2019 & 2032
- Table 60: Global Dynamic Application Security Testing Market Revenue Million Forecast, by Organization Size 2019 & 2032
- Table 61: Global Dynamic Application Security Testing Market Revenue Million Forecast, by Country 2019 & 2032
- Table 62: Global Dynamic Application Security Testing Market Revenue Million Forecast, by Bye Application Type 2019 & 2032
- Table 63: Global Dynamic Application Security Testing Market Revenue Million Forecast, by Deployment Mode* 2019 & 2032
- Table 64: Global Dynamic Application Security Testing Market Revenue Million Forecast, by End-user Vertical 2019 & 2032
- Table 65: Global Dynamic Application Security Testing Market Revenue Million Forecast, by Organization Size 2019 & 2032
- Table 66: Global Dynamic Application Security Testing Market Revenue Million Forecast, by Country 2019 & 2032
- Table 67: Global Dynamic Application Security Testing Market Revenue Million Forecast, by Bye Application Type 2019 & 2032
- Table 68: Global Dynamic Application Security Testing Market Revenue Million Forecast, by Deployment Mode* 2019 & 2032
- Table 69: Global Dynamic Application Security Testing Market Revenue Million Forecast, by End-user Vertical 2019 & 2032
- Table 70: Global Dynamic Application Security Testing Market Revenue Million Forecast, by Organization Size 2019 & 2032
- Table 71: Global Dynamic Application Security Testing Market Revenue Million Forecast, by Country 2019 & 2032
Frequently Asked Questions
1. What is the projected Compound Annual Growth Rate (CAGR) of the Dynamic Application Security Testing Market?
The projected CAGR is approximately 18.74%.
2. Which companies are prominent players in the Dynamic Application Security Testing Market?
Key companies in the market include Detectifty*List Not Exhaustive, IBM Corporation, Microfocus, GitLab, HCL, Veracode, Acunetix, Intruder, Checkmarx, Indusface.
3. What are the main segments of the Dynamic Application Security Testing Market?
The market segments include Bye Application Type, Deployment Mode*, End-user Vertical, Organization Size.
4. Can you provide details about the market size?
The market size is estimated to be USD 3.04 Million as of 2022.
5. What are some drivers contributing to market growth?
Digital transformation technologies and IoT; High potential damages from attacks and increasing sophistication of attacks; Rising web and mobile applications.
6. What are the notable trends driving market growth?
BFSI is Expected to Witness Significant Growth.
7. Are there any restraints impacting market growth?
Concerns Associated With Data Privacy And Security; Lack of Standardized Protocols and Frameworks for IoT Deployments.
8. Can you provide examples of recent developments in the market?
November 2023 - Veracode has released a beta of the Automated Dynamic Application Security Test Tool, DAST Essentials, intended for integration into an integrated development environment. Additionally, the company has made available a Veracode GitHub application that enables configuring Veracode's DAST tool for automatically checking code when it is inserted into the repository.
9. What pricing options are available for accessing the report?
Pricing options include single-user, multi-user, and enterprise licenses priced at USD 4750, USD 5250, and USD 8750 respectively.
10. Is the market size provided in terms of value or volume?
The market size is provided in terms of value, measured in Million.
11. Are there any specific market keywords associated with the report?
Yes, the market keyword associated with the report is "Dynamic Application Security Testing Market," which aids in identifying and referencing the specific market segment covered.
12. How do I determine which pricing option suits my needs best?
The pricing options vary based on user requirements and access needs. Individual users may opt for single-user licenses, while businesses requiring broader access may choose multi-user or enterprise licenses for cost-effective access to the report.
13. Are there any additional resources or data provided in the Dynamic Application Security Testing Market report?
While the report offers comprehensive insights, it's advisable to review the specific contents or supplementary materials provided to ascertain if additional resources or data are available.
14. How can I stay updated on further developments or reports in the Dynamic Application Security Testing Market?
To stay informed about further developments, trends, and reports in the Dynamic Application Security Testing Market, consider subscribing to industry newsletters, following relevant companies and organizations, or regularly checking reputable industry news sources and publications.
Methodology
Step 1 - Identification of Relevant Samples Size from Population Database


Step 2 - Approaches for Defining Global Market Size (Value, Volume* & Price*)

Note*: In applicable scenarios
Step 3 - Data Sources
Primary Research
- Web Analytics
- Survey Reports
- Research Institute
- Latest Research Reports
- Opinion Leaders
Secondary Research
- Annual Reports
- White Paper
- Latest Press Release
- Industry Association
- Paid Database
- Investor Presentations

Step 4 - Data Triangulation
Involves using different sources of information in order to increase the validity of a study
These sources are likely to be stakeholders in a program - participants, other researchers, program staff, other community members, and so on.
Then we put all data in single framework & apply various statistical tools to find out the dynamic on the market.
During the analysis stage, feedback from the stakeholder groups would be compared to determine areas of agreement as well as areas of divergence


