
Key Insights
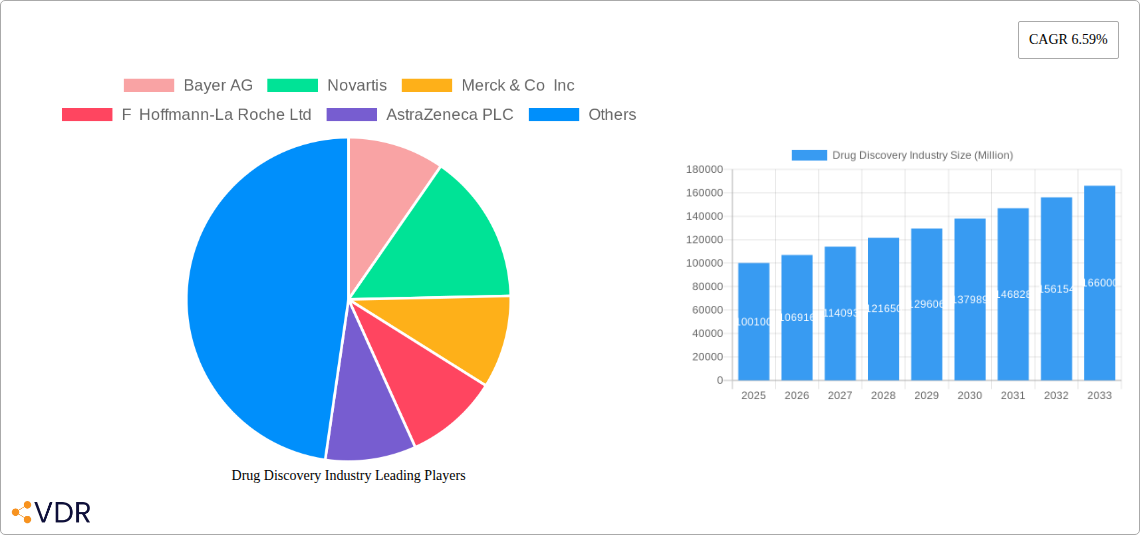
The global drug discovery market, valued at $100.10 billion in 2025, is projected to experience robust growth, driven by a confluence of factors. Increased prevalence of chronic diseases like cancer, diabetes, and cardiovascular ailments fuels the demand for novel therapies. Advancements in technologies such as high-throughput screening, pharmacogenomics, and artificial intelligence are significantly accelerating the drug development process, reducing timelines and costs. The rising adoption of personalized medicine, tailoring treatments to individual genetic profiles, further propels market expansion. Furthermore, substantial investments from pharmaceutical companies and contract research organizations (CROs) in research and development contribute to the market's dynamism. The competitive landscape is characterized by a mix of large multinational pharmaceutical companies and specialized biotech firms, fostering innovation and driving competition. Growth is anticipated across all segments, with biologic drugs and advanced technologies like nanotechnology showing particularly promising potential. However, challenges remain, including stringent regulatory approvals, high R&D costs, and the inherent risks associated with drug development.
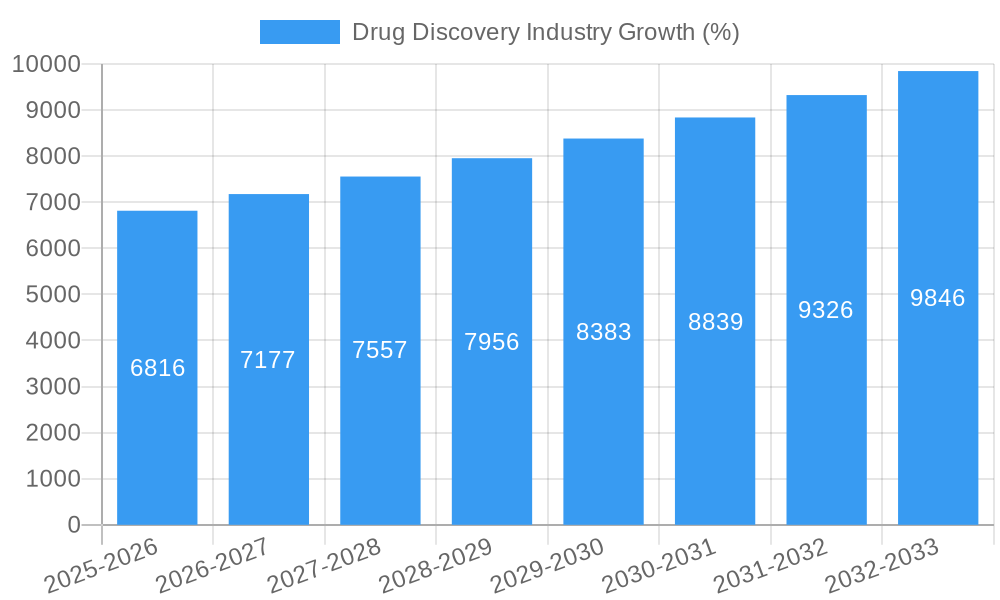
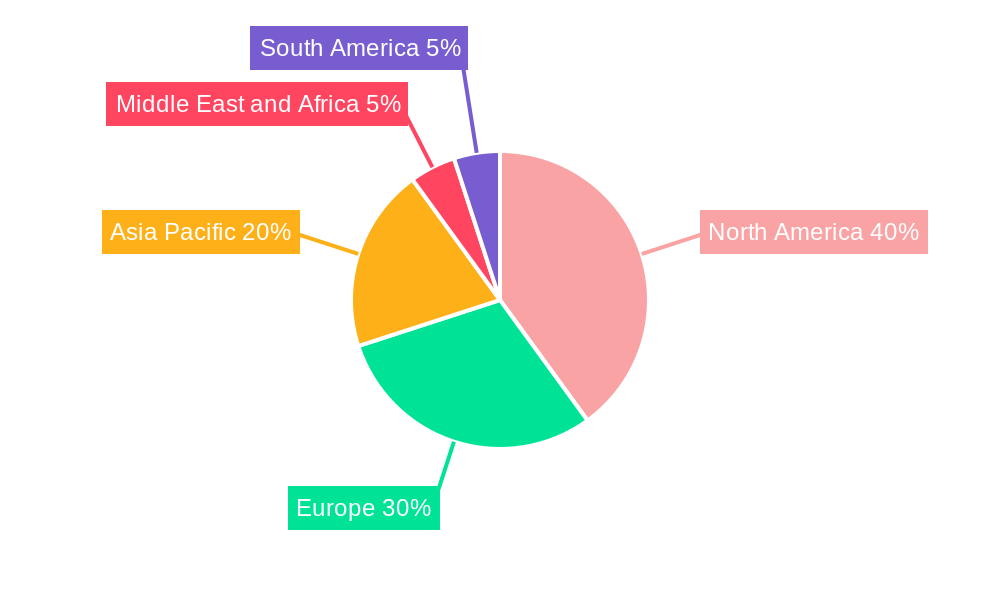
Despite these challenges, the market is expected to maintain a Compound Annual Growth Rate (CAGR) of 6.59% from 2025 to 2033, indicating a substantial expansion. Regional variations in market growth will be influenced by factors such as healthcare infrastructure, regulatory frameworks, and disease prevalence. North America and Europe are expected to maintain a significant market share due to well-established pharmaceutical industries and advanced healthcare systems. However, the Asia-Pacific region is anticipated to demonstrate considerable growth potential owing to rising disposable incomes, expanding healthcare expenditure, and an increasing prevalence of chronic diseases. Strategic partnerships, mergers and acquisitions, and the continuous development of innovative drug discovery platforms will shape the future of this dynamic and crucial industry.
Drug Discovery Industry Market Report: 2019-2033
This comprehensive report provides an in-depth analysis of the Drug Discovery Industry, encompassing market dynamics, growth trends, key players, and future outlook. With a focus on both parent and child markets, this report offers invaluable insights for pharmaceutical companies, CROs, investors, and industry professionals seeking to navigate this rapidly evolving landscape. The study period covers 2019-2033, with a base year of 2025 and a forecast period of 2025-2033. The market size is projected in Million units.
Drug Discovery Industry Market Dynamics & Structure
The Drug Discovery market, valued at xx Million in 2025, is characterized by high concentration among a few multinational pharmaceutical giants like Bayer AG, Novartis, Merck & Co Inc, F Hoffmann-La Roche Ltd, AstraZeneca PLC, Sanofi, Eli Lilly and Company, Takeda Pharmaceuticals, AbbVie Inc, Bristol-Myers Squibb Company, GlaxoSmithKline PLC, and Pfizer Inc. Technological innovation, particularly in areas like AI and high-throughput screening, is a key driver, while stringent regulatory frameworks and increasing competition pose challenges. Market share is highly skewed towards established players.
- Market Concentration: Highly concentrated, with top 10 players holding approximately xx% market share in 2025.
- Technological Innovation: High-throughput screening, pharmacogenomics, and AI are driving productivity and efficiency gains.
- Regulatory Landscape: Stringent regulatory approvals impact timelines and costs; variations across geographies add complexity.
- Competitive Landscape: Intense competition fueled by innovation and patent expirations. Significant M&A activity is reshaping the competitive landscape.
- M&A Activity: xx major M&A deals recorded between 2019-2024, totaling approximately xx Million in value.
- End-User Demographics: Dominated by pharmaceutical companies, with increasing participation from CROs.
Drug Discovery Industry Growth Trends & Insights
The Drug Discovery market exhibits robust growth, driven by rising prevalence of chronic diseases, increasing R&D investments, and technological advancements. The market is segmented by drug type (small molecule drugs and biologic drugs) and technology (high-throughput screening, pharmacogenomics, combinatorial chemistry, nanotechnology, and other technologies). The adoption of advanced technologies like AI and machine learning is accelerating drug discovery processes and reducing development timelines. Consumer behavior is shifting towards personalized medicine, demanding targeted therapies and innovative treatment approaches.
- Market Size Evolution: The market grew from xx Million in 2019 to xx Million in 2024, with a projected CAGR of xx% from 2025 to 2033.
- Adoption Rates: High-throughput screening adoption is increasing steadily, while pharmacogenomics penetration is gaining momentum.
- Technological Disruptions: AI and machine learning are revolutionizing drug discovery, leading to improved efficiency and reduced costs.
- Consumer Behavior: Demand for personalized medicine is driving innovation in targeted therapies and companion diagnostics.
Dominant Regions, Countries, or Segments in Drug Discovery Industry
North America (primarily the US) holds the largest market share due to high R&D spending, presence of major pharmaceutical companies, and advanced healthcare infrastructure. Europe and Asia Pacific are also significant markets, exhibiting strong growth potential. Within drug types, biologic drugs are experiencing faster growth compared to small molecule drugs, driven by advancements in biotechnology. High-throughput screening remains the dominant technology, though the adoption of AI and pharmacogenomics is increasing.
- Leading Region: North America, followed by Europe and Asia Pacific.
- Key Drivers (North America): High R&D spending, advanced healthcare infrastructure, presence of major pharma companies.
- Key Drivers (Europe): Strong government support for R&D, presence of innovative biotech companies.
- Key Drivers (Asia Pacific): Growing healthcare expenditure, increasing prevalence of chronic diseases, supportive government policies.
- Dominant Drug Type: Small molecule drugs currently hold a larger market share, but biologic drugs are demonstrating higher growth rates.
- Dominant Technology: High-throughput screening, with increasing adoption of AI and pharmacogenomics.
Drug Discovery Industry Product Landscape
The drug discovery product landscape is dynamic, characterized by the continuous development of novel drugs and advanced technologies. Companies are focusing on developing targeted therapies, personalized medicines, and innovative drug delivery systems. The key performance indicators include efficacy, safety, cost-effectiveness, and speed of development. Unique selling propositions revolve around improved therapeutic outcomes, reduced side effects, and faster time-to-market.
Key Drivers, Barriers & Challenges in Drug Discovery Industry
Key Drivers: Increasing prevalence of chronic diseases, rising R&D investments, technological advancements (AI, machine learning), government initiatives promoting drug discovery.
Key Challenges: High R&D costs, stringent regulatory approvals, long development timelines, competition from generic drugs, intellectual property protection challenges, supply chain disruptions impacting raw material availability (estimated xx% increase in cost of raw materials between 2019-2024).
Emerging Opportunities in Drug Discovery Industry
Emerging opportunities lie in personalized medicine, gene therapy, immunotherapy, and the application of AI and machine learning to accelerate drug discovery. Untapped markets in emerging economies present significant growth potential. Focus on addressing unmet medical needs in areas like rare diseases and neglected tropical diseases also offers lucrative opportunities.
Growth Accelerators in the Drug Discovery Industry Industry
Technological breakthroughs in areas like AI and CRISPR-Cas9 gene editing are accelerating drug discovery. Strategic partnerships between pharmaceutical companies and biotech firms are fostering innovation. Market expansion into emerging economies and the development of novel drug delivery systems are further fueling long-term growth.
Key Players Shaping the Drug Discovery Industry Market
- Bayer AG
- Novartis
- Merck & Co Inc
- F Hoffmann-La Roche Ltd
- AstraZeneca PLC
- Sanofi
- Eli Lilly and Company
- Takeda Pharmaceuticals
- AbbVie Inc
- Bristol-Myers Squibb Company
- GlaxoSmithKline PLC
- Pfizer Inc
Notable Milestones in Drug Discovery Industry Sector
- October 2022: Verge Genomics initiates Phase 1 clinical trial of VRG50635, showcasing the growing role of AI in drug discovery.
- October 2022: NGM Bio releases positive Phase 2 trial results for NGM621, demonstrating progress in treating geographic atrophy.
In-Depth Drug Discovery Industry Market Outlook
The Drug Discovery market is poised for continued strong growth, driven by technological advancements, rising healthcare expenditure, and increasing prevalence of chronic diseases. Strategic partnerships, investments in R&D, and expansion into emerging markets will shape the future of the industry. Companies focusing on innovative therapies and personalized medicine are expected to gain a competitive edge.
Drug Discovery Industry Segmentation
-
1. Drug Type
- 1.1. Small Molecule Drugs
- 1.2. Biologic Drugs
-
2. Technology
- 2.1. High Throughput Screening
- 2.2. Pharmacogenomics
- 2.3. Combinatorial Chemistry
- 2.4. Nanotechnology
- 2.5. Other Technologies
-
3. End User
- 3.1. Pharmaceutical Companies
- 3.2. Contract Research Organizations (CROs)
- 3.3. Other End Users
Drug Discovery Industry Segmentation By Geography
-
1. North America
- 1.1. United States
- 1.2. Canada
- 1.3. Mexico
-
2. Europe
- 2.1. United Kingdom
- 2.2. Germany
- 2.3. France
- 2.4. Italy
- 2.5. Spain
- 2.6. Rest of Europe
-
3. Asia Pacific
- 3.1. China
- 3.2. Japan
- 3.3. India
- 3.4. Australia
- 3.5. South Korea
- 3.6. Rest of Asia Pacific
-
4. Middle East and Africa
- 4.1. GCC
- 4.2. South Africa
- 4.3. Rest of Middle East and Africa
-
5. South America
- 5.1. Brazil
- 5.2. Argentina
- 5.3. Rest of South America
Drug Discovery Industry REPORT HIGHLIGHTS
| Aspects | Details |
|---|---|
| Study Period | 2019-2033 |
| Base Year | 2024 |
| Estimated Year | 2025 |
| Forecast Period | 2025-2033 |
| Historical Period | 2019-2024 |
| Growth Rate | CAGR of 6.59% from 2019-2033 |
| Segmentation |
|
Table of Contents
- 1. Introduction
- 1.1. Research Scope
- 1.2. Market Segmentation
- 1.3. Research Methodology
- 1.4. Definitions and Assumptions
- 2. Executive Summary
- 2.1. Introduction
- 3. Market Dynamics
- 3.1. Introduction
- 3.2. Market Drivers
- 3.2.1. Rising Burden of Various Chronic Diseases; Increasing R&D Expenditure and Investment in the Development of Novel Drug Molecules
- 3.3. Market Restrains
- 3.3.1. Huge Capital Investment with Low Profit Margins; Stringent Government Regulations
- 3.4. Market Trends
- 3.4.1. Biologics Drug Segment is Expected to Show a Significant Growth Over the Forecast Period.
- 4. Market Factor Analysis
- 4.1. Porters Five Forces
- 4.2. Supply/Value Chain
- 4.3. PESTEL analysis
- 4.4. Market Entropy
- 4.5. Patent/Trademark Analysis
- 5. Global Drug Discovery Industry Analysis, Insights and Forecast, 2019-2031
- 5.1. Market Analysis, Insights and Forecast - by Drug Type
- 5.1.1. Small Molecule Drugs
- 5.1.2. Biologic Drugs
- 5.2. Market Analysis, Insights and Forecast - by Technology
- 5.2.1. High Throughput Screening
- 5.2.2. Pharmacogenomics
- 5.2.3. Combinatorial Chemistry
- 5.2.4. Nanotechnology
- 5.2.5. Other Technologies
- 5.3. Market Analysis, Insights and Forecast - by End User
- 5.3.1. Pharmaceutical Companies
- 5.3.2. Contract Research Organizations (CROs)
- 5.3.3. Other End Users
- 5.4. Market Analysis, Insights and Forecast - by Region
- 5.4.1. North America
- 5.4.2. Europe
- 5.4.3. Asia Pacific
- 5.4.4. Middle East and Africa
- 5.4.5. South America
- 5.1. Market Analysis, Insights and Forecast - by Drug Type
- 6. North America Drug Discovery Industry Analysis, Insights and Forecast, 2019-2031
- 6.1. Market Analysis, Insights and Forecast - by Drug Type
- 6.1.1. Small Molecule Drugs
- 6.1.2. Biologic Drugs
- 6.2. Market Analysis, Insights and Forecast - by Technology
- 6.2.1. High Throughput Screening
- 6.2.2. Pharmacogenomics
- 6.2.3. Combinatorial Chemistry
- 6.2.4. Nanotechnology
- 6.2.5. Other Technologies
- 6.3. Market Analysis, Insights and Forecast - by End User
- 6.3.1. Pharmaceutical Companies
- 6.3.2. Contract Research Organizations (CROs)
- 6.3.3. Other End Users
- 6.1. Market Analysis, Insights and Forecast - by Drug Type
- 7. Europe Drug Discovery Industry Analysis, Insights and Forecast, 2019-2031
- 7.1. Market Analysis, Insights and Forecast - by Drug Type
- 7.1.1. Small Molecule Drugs
- 7.1.2. Biologic Drugs
- 7.2. Market Analysis, Insights and Forecast - by Technology
- 7.2.1. High Throughput Screening
- 7.2.2. Pharmacogenomics
- 7.2.3. Combinatorial Chemistry
- 7.2.4. Nanotechnology
- 7.2.5. Other Technologies
- 7.3. Market Analysis, Insights and Forecast - by End User
- 7.3.1. Pharmaceutical Companies
- 7.3.2. Contract Research Organizations (CROs)
- 7.3.3. Other End Users
- 7.1. Market Analysis, Insights and Forecast - by Drug Type
- 8. Asia Pacific Drug Discovery Industry Analysis, Insights and Forecast, 2019-2031
- 8.1. Market Analysis, Insights and Forecast - by Drug Type
- 8.1.1. Small Molecule Drugs
- 8.1.2. Biologic Drugs
- 8.2. Market Analysis, Insights and Forecast - by Technology
- 8.2.1. High Throughput Screening
- 8.2.2. Pharmacogenomics
- 8.2.3. Combinatorial Chemistry
- 8.2.4. Nanotechnology
- 8.2.5. Other Technologies
- 8.3. Market Analysis, Insights and Forecast - by End User
- 8.3.1. Pharmaceutical Companies
- 8.3.2. Contract Research Organizations (CROs)
- 8.3.3. Other End Users
- 8.1. Market Analysis, Insights and Forecast - by Drug Type
- 9. Middle East and Africa Drug Discovery Industry Analysis, Insights and Forecast, 2019-2031
- 9.1. Market Analysis, Insights and Forecast - by Drug Type
- 9.1.1. Small Molecule Drugs
- 9.1.2. Biologic Drugs
- 9.2. Market Analysis, Insights and Forecast - by Technology
- 9.2.1. High Throughput Screening
- 9.2.2. Pharmacogenomics
- 9.2.3. Combinatorial Chemistry
- 9.2.4. Nanotechnology
- 9.2.5. Other Technologies
- 9.3. Market Analysis, Insights and Forecast - by End User
- 9.3.1. Pharmaceutical Companies
- 9.3.2. Contract Research Organizations (CROs)
- 9.3.3. Other End Users
- 9.1. Market Analysis, Insights and Forecast - by Drug Type
- 10. South America Drug Discovery Industry Analysis, Insights and Forecast, 2019-2031
- 10.1. Market Analysis, Insights and Forecast - by Drug Type
- 10.1.1. Small Molecule Drugs
- 10.1.2. Biologic Drugs
- 10.2. Market Analysis, Insights and Forecast - by Technology
- 10.2.1. High Throughput Screening
- 10.2.2. Pharmacogenomics
- 10.2.3. Combinatorial Chemistry
- 10.2.4. Nanotechnology
- 10.2.5. Other Technologies
- 10.3. Market Analysis, Insights and Forecast - by End User
- 10.3.1. Pharmaceutical Companies
- 10.3.2. Contract Research Organizations (CROs)
- 10.3.3. Other End Users
- 10.1. Market Analysis, Insights and Forecast - by Drug Type
- 11. North America Drug Discovery Industry Analysis, Insights and Forecast, 2019-2031
- 11.1. Market Analysis, Insights and Forecast - By Country/Sub-region
- 11.1.1 United States
- 11.1.2 Canada
- 11.1.3 Mexico
- 12. Europe Drug Discovery Industry Analysis, Insights and Forecast, 2019-2031
- 12.1. Market Analysis, Insights and Forecast - By Country/Sub-region
- 12.1.1 United Kingdom
- 12.1.2 Germany
- 12.1.3 France
- 12.1.4 Italy
- 12.1.5 Spain
- 12.1.6 Rest of Europe
- 13. Asia Pacific Drug Discovery Industry Analysis, Insights and Forecast, 2019-2031
- 13.1. Market Analysis, Insights and Forecast - By Country/Sub-region
- 13.1.1 China
- 13.1.2 Japan
- 13.1.3 India
- 13.1.4 Australia
- 13.1.5 South Korea
- 13.1.6 Rest of Asia Pacific
- 14. Middle East and Africa Drug Discovery Industry Analysis, Insights and Forecast, 2019-2031
- 14.1. Market Analysis, Insights and Forecast - By Country/Sub-region
- 14.1.1 GCC
- 14.1.2 South Africa
- 14.1.3 Rest of Middle East and Africa
- 15. South America Drug Discovery Industry Analysis, Insights and Forecast, 2019-2031
- 15.1. Market Analysis, Insights and Forecast - By Country/Sub-region
- 15.1.1 Brazil
- 15.1.2 Argentina
- 15.1.3 Rest of South America
- 16. Competitive Analysis
- 16.1. Global Market Share Analysis 2024
- 16.2. Company Profiles
- 16.2.1 Bayer AG
- 16.2.1.1. Overview
- 16.2.1.2. Products
- 16.2.1.3. SWOT Analysis
- 16.2.1.4. Recent Developments
- 16.2.1.5. Financials (Based on Availability)
- 16.2.2 Novartis
- 16.2.2.1. Overview
- 16.2.2.2. Products
- 16.2.2.3. SWOT Analysis
- 16.2.2.4. Recent Developments
- 16.2.2.5. Financials (Based on Availability)
- 16.2.3 Merck & Co Inc
- 16.2.3.1. Overview
- 16.2.3.2. Products
- 16.2.3.3. SWOT Analysis
- 16.2.3.4. Recent Developments
- 16.2.3.5. Financials (Based on Availability)
- 16.2.4 F Hoffmann-La Roche Ltd
- 16.2.4.1. Overview
- 16.2.4.2. Products
- 16.2.4.3. SWOT Analysis
- 16.2.4.4. Recent Developments
- 16.2.4.5. Financials (Based on Availability)
- 16.2.5 AstraZeneca PLC
- 16.2.5.1. Overview
- 16.2.5.2. Products
- 16.2.5.3. SWOT Analysis
- 16.2.5.4. Recent Developments
- 16.2.5.5. Financials (Based on Availability)
- 16.2.6 Sanofi
- 16.2.6.1. Overview
- 16.2.6.2. Products
- 16.2.6.3. SWOT Analysis
- 16.2.6.4. Recent Developments
- 16.2.6.5. Financials (Based on Availability)
- 16.2.7 Eli Lilly and Company
- 16.2.7.1. Overview
- 16.2.7.2. Products
- 16.2.7.3. SWOT Analysis
- 16.2.7.4. Recent Developments
- 16.2.7.5. Financials (Based on Availability)
- 16.2.8 Takeda Pharmaceuticals
- 16.2.8.1. Overview
- 16.2.8.2. Products
- 16.2.8.3. SWOT Analysis
- 16.2.8.4. Recent Developments
- 16.2.8.5. Financials (Based on Availability)
- 16.2.9 AbbVie Inc
- 16.2.9.1. Overview
- 16.2.9.2. Products
- 16.2.9.3. SWOT Analysis
- 16.2.9.4. Recent Developments
- 16.2.9.5. Financials (Based on Availability)
- 16.2.10 Bristol-Myers Squibb Company
- 16.2.10.1. Overview
- 16.2.10.2. Products
- 16.2.10.3. SWOT Analysis
- 16.2.10.4. Recent Developments
- 16.2.10.5. Financials (Based on Availability)
- 16.2.11 GlaxoSmithKline PLC
- 16.2.11.1. Overview
- 16.2.11.2. Products
- 16.2.11.3. SWOT Analysis
- 16.2.11.4. Recent Developments
- 16.2.11.5. Financials (Based on Availability)
- 16.2.12 Pfizer Inc
- 16.2.12.1. Overview
- 16.2.12.2. Products
- 16.2.12.3. SWOT Analysis
- 16.2.12.4. Recent Developments
- 16.2.12.5. Financials (Based on Availability)
- 16.2.1 Bayer AG
List of Figures
- Figure 1: Global Drug Discovery Industry Revenue Breakdown (Million, %) by Region 2024 & 2032
- Figure 2: Global Drug Discovery Industry Volume Breakdown (K Unit, %) by Region 2024 & 2032
- Figure 3: North America Drug Discovery Industry Revenue (Million), by Country 2024 & 2032
- Figure 4: North America Drug Discovery Industry Volume (K Unit), by Country 2024 & 2032
- Figure 5: North America Drug Discovery Industry Revenue Share (%), by Country 2024 & 2032
- Figure 6: North America Drug Discovery Industry Volume Share (%), by Country 2024 & 2032
- Figure 7: Europe Drug Discovery Industry Revenue (Million), by Country 2024 & 2032
- Figure 8: Europe Drug Discovery Industry Volume (K Unit), by Country 2024 & 2032
- Figure 9: Europe Drug Discovery Industry Revenue Share (%), by Country 2024 & 2032
- Figure 10: Europe Drug Discovery Industry Volume Share (%), by Country 2024 & 2032
- Figure 11: Asia Pacific Drug Discovery Industry Revenue (Million), by Country 2024 & 2032
- Figure 12: Asia Pacific Drug Discovery Industry Volume (K Unit), by Country 2024 & 2032
- Figure 13: Asia Pacific Drug Discovery Industry Revenue Share (%), by Country 2024 & 2032
- Figure 14: Asia Pacific Drug Discovery Industry Volume Share (%), by Country 2024 & 2032
- Figure 15: Middle East and Africa Drug Discovery Industry Revenue (Million), by Country 2024 & 2032
- Figure 16: Middle East and Africa Drug Discovery Industry Volume (K Unit), by Country 2024 & 2032
- Figure 17: Middle East and Africa Drug Discovery Industry Revenue Share (%), by Country 2024 & 2032
- Figure 18: Middle East and Africa Drug Discovery Industry Volume Share (%), by Country 2024 & 2032
- Figure 19: South America Drug Discovery Industry Revenue (Million), by Country 2024 & 2032
- Figure 20: South America Drug Discovery Industry Volume (K Unit), by Country 2024 & 2032
- Figure 21: South America Drug Discovery Industry Revenue Share (%), by Country 2024 & 2032
- Figure 22: South America Drug Discovery Industry Volume Share (%), by Country 2024 & 2032
- Figure 23: North America Drug Discovery Industry Revenue (Million), by Drug Type 2024 & 2032
- Figure 24: North America Drug Discovery Industry Volume (K Unit), by Drug Type 2024 & 2032
- Figure 25: North America Drug Discovery Industry Revenue Share (%), by Drug Type 2024 & 2032
- Figure 26: North America Drug Discovery Industry Volume Share (%), by Drug Type 2024 & 2032
- Figure 27: North America Drug Discovery Industry Revenue (Million), by Technology 2024 & 2032
- Figure 28: North America Drug Discovery Industry Volume (K Unit), by Technology 2024 & 2032
- Figure 29: North America Drug Discovery Industry Revenue Share (%), by Technology 2024 & 2032
- Figure 30: North America Drug Discovery Industry Volume Share (%), by Technology 2024 & 2032
- Figure 31: North America Drug Discovery Industry Revenue (Million), by End User 2024 & 2032
- Figure 32: North America Drug Discovery Industry Volume (K Unit), by End User 2024 & 2032
- Figure 33: North America Drug Discovery Industry Revenue Share (%), by End User 2024 & 2032
- Figure 34: North America Drug Discovery Industry Volume Share (%), by End User 2024 & 2032
- Figure 35: North America Drug Discovery Industry Revenue (Million), by Country 2024 & 2032
- Figure 36: North America Drug Discovery Industry Volume (K Unit), by Country 2024 & 2032
- Figure 37: North America Drug Discovery Industry Revenue Share (%), by Country 2024 & 2032
- Figure 38: North America Drug Discovery Industry Volume Share (%), by Country 2024 & 2032
- Figure 39: Europe Drug Discovery Industry Revenue (Million), by Drug Type 2024 & 2032
- Figure 40: Europe Drug Discovery Industry Volume (K Unit), by Drug Type 2024 & 2032
- Figure 41: Europe Drug Discovery Industry Revenue Share (%), by Drug Type 2024 & 2032
- Figure 42: Europe Drug Discovery Industry Volume Share (%), by Drug Type 2024 & 2032
- Figure 43: Europe Drug Discovery Industry Revenue (Million), by Technology 2024 & 2032
- Figure 44: Europe Drug Discovery Industry Volume (K Unit), by Technology 2024 & 2032
- Figure 45: Europe Drug Discovery Industry Revenue Share (%), by Technology 2024 & 2032
- Figure 46: Europe Drug Discovery Industry Volume Share (%), by Technology 2024 & 2032
- Figure 47: Europe Drug Discovery Industry Revenue (Million), by End User 2024 & 2032
- Figure 48: Europe Drug Discovery Industry Volume (K Unit), by End User 2024 & 2032
- Figure 49: Europe Drug Discovery Industry Revenue Share (%), by End User 2024 & 2032
- Figure 50: Europe Drug Discovery Industry Volume Share (%), by End User 2024 & 2032
- Figure 51: Europe Drug Discovery Industry Revenue (Million), by Country 2024 & 2032
- Figure 52: Europe Drug Discovery Industry Volume (K Unit), by Country 2024 & 2032
- Figure 53: Europe Drug Discovery Industry Revenue Share (%), by Country 2024 & 2032
- Figure 54: Europe Drug Discovery Industry Volume Share (%), by Country 2024 & 2032
- Figure 55: Asia Pacific Drug Discovery Industry Revenue (Million), by Drug Type 2024 & 2032
- Figure 56: Asia Pacific Drug Discovery Industry Volume (K Unit), by Drug Type 2024 & 2032
- Figure 57: Asia Pacific Drug Discovery Industry Revenue Share (%), by Drug Type 2024 & 2032
- Figure 58: Asia Pacific Drug Discovery Industry Volume Share (%), by Drug Type 2024 & 2032
- Figure 59: Asia Pacific Drug Discovery Industry Revenue (Million), by Technology 2024 & 2032
- Figure 60: Asia Pacific Drug Discovery Industry Volume (K Unit), by Technology 2024 & 2032
- Figure 61: Asia Pacific Drug Discovery Industry Revenue Share (%), by Technology 2024 & 2032
- Figure 62: Asia Pacific Drug Discovery Industry Volume Share (%), by Technology 2024 & 2032
- Figure 63: Asia Pacific Drug Discovery Industry Revenue (Million), by End User 2024 & 2032
- Figure 64: Asia Pacific Drug Discovery Industry Volume (K Unit), by End User 2024 & 2032
- Figure 65: Asia Pacific Drug Discovery Industry Revenue Share (%), by End User 2024 & 2032
- Figure 66: Asia Pacific Drug Discovery Industry Volume Share (%), by End User 2024 & 2032
- Figure 67: Asia Pacific Drug Discovery Industry Revenue (Million), by Country 2024 & 2032
- Figure 68: Asia Pacific Drug Discovery Industry Volume (K Unit), by Country 2024 & 2032
- Figure 69: Asia Pacific Drug Discovery Industry Revenue Share (%), by Country 2024 & 2032
- Figure 70: Asia Pacific Drug Discovery Industry Volume Share (%), by Country 2024 & 2032
- Figure 71: Middle East and Africa Drug Discovery Industry Revenue (Million), by Drug Type 2024 & 2032
- Figure 72: Middle East and Africa Drug Discovery Industry Volume (K Unit), by Drug Type 2024 & 2032
- Figure 73: Middle East and Africa Drug Discovery Industry Revenue Share (%), by Drug Type 2024 & 2032
- Figure 74: Middle East and Africa Drug Discovery Industry Volume Share (%), by Drug Type 2024 & 2032
- Figure 75: Middle East and Africa Drug Discovery Industry Revenue (Million), by Technology 2024 & 2032
- Figure 76: Middle East and Africa Drug Discovery Industry Volume (K Unit), by Technology 2024 & 2032
- Figure 77: Middle East and Africa Drug Discovery Industry Revenue Share (%), by Technology 2024 & 2032
- Figure 78: Middle East and Africa Drug Discovery Industry Volume Share (%), by Technology 2024 & 2032
- Figure 79: Middle East and Africa Drug Discovery Industry Revenue (Million), by End User 2024 & 2032
- Figure 80: Middle East and Africa Drug Discovery Industry Volume (K Unit), by End User 2024 & 2032
- Figure 81: Middle East and Africa Drug Discovery Industry Revenue Share (%), by End User 2024 & 2032
- Figure 82: Middle East and Africa Drug Discovery Industry Volume Share (%), by End User 2024 & 2032
- Figure 83: Middle East and Africa Drug Discovery Industry Revenue (Million), by Country 2024 & 2032
- Figure 84: Middle East and Africa Drug Discovery Industry Volume (K Unit), by Country 2024 & 2032
- Figure 85: Middle East and Africa Drug Discovery Industry Revenue Share (%), by Country 2024 & 2032
- Figure 86: Middle East and Africa Drug Discovery Industry Volume Share (%), by Country 2024 & 2032
- Figure 87: South America Drug Discovery Industry Revenue (Million), by Drug Type 2024 & 2032
- Figure 88: South America Drug Discovery Industry Volume (K Unit), by Drug Type 2024 & 2032
- Figure 89: South America Drug Discovery Industry Revenue Share (%), by Drug Type 2024 & 2032
- Figure 90: South America Drug Discovery Industry Volume Share (%), by Drug Type 2024 & 2032
- Figure 91: South America Drug Discovery Industry Revenue (Million), by Technology 2024 & 2032
- Figure 92: South America Drug Discovery Industry Volume (K Unit), by Technology 2024 & 2032
- Figure 93: South America Drug Discovery Industry Revenue Share (%), by Technology 2024 & 2032
- Figure 94: South America Drug Discovery Industry Volume Share (%), by Technology 2024 & 2032
- Figure 95: South America Drug Discovery Industry Revenue (Million), by End User 2024 & 2032
- Figure 96: South America Drug Discovery Industry Volume (K Unit), by End User 2024 & 2032
- Figure 97: South America Drug Discovery Industry Revenue Share (%), by End User 2024 & 2032
- Figure 98: South America Drug Discovery Industry Volume Share (%), by End User 2024 & 2032
- Figure 99: South America Drug Discovery Industry Revenue (Million), by Country 2024 & 2032
- Figure 100: South America Drug Discovery Industry Volume (K Unit), by Country 2024 & 2032
- Figure 101: South America Drug Discovery Industry Revenue Share (%), by Country 2024 & 2032
- Figure 102: South America Drug Discovery Industry Volume Share (%), by Country 2024 & 2032
List of Tables
- Table 1: Global Drug Discovery Industry Revenue Million Forecast, by Region 2019 & 2032
- Table 2: Global Drug Discovery Industry Volume K Unit Forecast, by Region 2019 & 2032
- Table 3: Global Drug Discovery Industry Revenue Million Forecast, by Drug Type 2019 & 2032
- Table 4: Global Drug Discovery Industry Volume K Unit Forecast, by Drug Type 2019 & 2032
- Table 5: Global Drug Discovery Industry Revenue Million Forecast, by Technology 2019 & 2032
- Table 6: Global Drug Discovery Industry Volume K Unit Forecast, by Technology 2019 & 2032
- Table 7: Global Drug Discovery Industry Revenue Million Forecast, by End User 2019 & 2032
- Table 8: Global Drug Discovery Industry Volume K Unit Forecast, by End User 2019 & 2032
- Table 9: Global Drug Discovery Industry Revenue Million Forecast, by Region 2019 & 2032
- Table 10: Global Drug Discovery Industry Volume K Unit Forecast, by Region 2019 & 2032
- Table 11: Global Drug Discovery Industry Revenue Million Forecast, by Country 2019 & 2032
- Table 12: Global Drug Discovery Industry Volume K Unit Forecast, by Country 2019 & 2032
- Table 13: United States Drug Discovery Industry Revenue (Million) Forecast, by Application 2019 & 2032
- Table 14: United States Drug Discovery Industry Volume (K Unit) Forecast, by Application 2019 & 2032
- Table 15: Canada Drug Discovery Industry Revenue (Million) Forecast, by Application 2019 & 2032
- Table 16: Canada Drug Discovery Industry Volume (K Unit) Forecast, by Application 2019 & 2032
- Table 17: Mexico Drug Discovery Industry Revenue (Million) Forecast, by Application 2019 & 2032
- Table 18: Mexico Drug Discovery Industry Volume (K Unit) Forecast, by Application 2019 & 2032
- Table 19: Global Drug Discovery Industry Revenue Million Forecast, by Country 2019 & 2032
- Table 20: Global Drug Discovery Industry Volume K Unit Forecast, by Country 2019 & 2032
- Table 21: United Kingdom Drug Discovery Industry Revenue (Million) Forecast, by Application 2019 & 2032
- Table 22: United Kingdom Drug Discovery Industry Volume (K Unit) Forecast, by Application 2019 & 2032
- Table 23: Germany Drug Discovery Industry Revenue (Million) Forecast, by Application 2019 & 2032
- Table 24: Germany Drug Discovery Industry Volume (K Unit) Forecast, by Application 2019 & 2032
- Table 25: France Drug Discovery Industry Revenue (Million) Forecast, by Application 2019 & 2032
- Table 26: France Drug Discovery Industry Volume (K Unit) Forecast, by Application 2019 & 2032
- Table 27: Italy Drug Discovery Industry Revenue (Million) Forecast, by Application 2019 & 2032
- Table 28: Italy Drug Discovery Industry Volume (K Unit) Forecast, by Application 2019 & 2032
- Table 29: Spain Drug Discovery Industry Revenue (Million) Forecast, by Application 2019 & 2032
- Table 30: Spain Drug Discovery Industry Volume (K Unit) Forecast, by Application 2019 & 2032
- Table 31: Rest of Europe Drug Discovery Industry Revenue (Million) Forecast, by Application 2019 & 2032
- Table 32: Rest of Europe Drug Discovery Industry Volume (K Unit) Forecast, by Application 2019 & 2032
- Table 33: Global Drug Discovery Industry Revenue Million Forecast, by Country 2019 & 2032
- Table 34: Global Drug Discovery Industry Volume K Unit Forecast, by Country 2019 & 2032
- Table 35: China Drug Discovery Industry Revenue (Million) Forecast, by Application 2019 & 2032
- Table 36: China Drug Discovery Industry Volume (K Unit) Forecast, by Application 2019 & 2032
- Table 37: Japan Drug Discovery Industry Revenue (Million) Forecast, by Application 2019 & 2032
- Table 38: Japan Drug Discovery Industry Volume (K Unit) Forecast, by Application 2019 & 2032
- Table 39: India Drug Discovery Industry Revenue (Million) Forecast, by Application 2019 & 2032
- Table 40: India Drug Discovery Industry Volume (K Unit) Forecast, by Application 2019 & 2032
- Table 41: Australia Drug Discovery Industry Revenue (Million) Forecast, by Application 2019 & 2032
- Table 42: Australia Drug Discovery Industry Volume (K Unit) Forecast, by Application 2019 & 2032
- Table 43: South Korea Drug Discovery Industry Revenue (Million) Forecast, by Application 2019 & 2032
- Table 44: South Korea Drug Discovery Industry Volume (K Unit) Forecast, by Application 2019 & 2032
- Table 45: Rest of Asia Pacific Drug Discovery Industry Revenue (Million) Forecast, by Application 2019 & 2032
- Table 46: Rest of Asia Pacific Drug Discovery Industry Volume (K Unit) Forecast, by Application 2019 & 2032
- Table 47: Global Drug Discovery Industry Revenue Million Forecast, by Country 2019 & 2032
- Table 48: Global Drug Discovery Industry Volume K Unit Forecast, by Country 2019 & 2032
- Table 49: GCC Drug Discovery Industry Revenue (Million) Forecast, by Application 2019 & 2032
- Table 50: GCC Drug Discovery Industry Volume (K Unit) Forecast, by Application 2019 & 2032
- Table 51: South Africa Drug Discovery Industry Revenue (Million) Forecast, by Application 2019 & 2032
- Table 52: South Africa Drug Discovery Industry Volume (K Unit) Forecast, by Application 2019 & 2032
- Table 53: Rest of Middle East and Africa Drug Discovery Industry Revenue (Million) Forecast, by Application 2019 & 2032
- Table 54: Rest of Middle East and Africa Drug Discovery Industry Volume (K Unit) Forecast, by Application 2019 & 2032
- Table 55: Global Drug Discovery Industry Revenue Million Forecast, by Country 2019 & 2032
- Table 56: Global Drug Discovery Industry Volume K Unit Forecast, by Country 2019 & 2032
- Table 57: Brazil Drug Discovery Industry Revenue (Million) Forecast, by Application 2019 & 2032
- Table 58: Brazil Drug Discovery Industry Volume (K Unit) Forecast, by Application 2019 & 2032
- Table 59: Argentina Drug Discovery Industry Revenue (Million) Forecast, by Application 2019 & 2032
- Table 60: Argentina Drug Discovery Industry Volume (K Unit) Forecast, by Application 2019 & 2032
- Table 61: Rest of South America Drug Discovery Industry Revenue (Million) Forecast, by Application 2019 & 2032
- Table 62: Rest of South America Drug Discovery Industry Volume (K Unit) Forecast, by Application 2019 & 2032
- Table 63: Global Drug Discovery Industry Revenue Million Forecast, by Drug Type 2019 & 2032
- Table 64: Global Drug Discovery Industry Volume K Unit Forecast, by Drug Type 2019 & 2032
- Table 65: Global Drug Discovery Industry Revenue Million Forecast, by Technology 2019 & 2032
- Table 66: Global Drug Discovery Industry Volume K Unit Forecast, by Technology 2019 & 2032
- Table 67: Global Drug Discovery Industry Revenue Million Forecast, by End User 2019 & 2032
- Table 68: Global Drug Discovery Industry Volume K Unit Forecast, by End User 2019 & 2032
- Table 69: Global Drug Discovery Industry Revenue Million Forecast, by Country 2019 & 2032
- Table 70: Global Drug Discovery Industry Volume K Unit Forecast, by Country 2019 & 2032
- Table 71: United States Drug Discovery Industry Revenue (Million) Forecast, by Application 2019 & 2032
- Table 72: United States Drug Discovery Industry Volume (K Unit) Forecast, by Application 2019 & 2032
- Table 73: Canada Drug Discovery Industry Revenue (Million) Forecast, by Application 2019 & 2032
- Table 74: Canada Drug Discovery Industry Volume (K Unit) Forecast, by Application 2019 & 2032
- Table 75: Mexico Drug Discovery Industry Revenue (Million) Forecast, by Application 2019 & 2032
- Table 76: Mexico Drug Discovery Industry Volume (K Unit) Forecast, by Application 2019 & 2032
- Table 77: Global Drug Discovery Industry Revenue Million Forecast, by Drug Type 2019 & 2032
- Table 78: Global Drug Discovery Industry Volume K Unit Forecast, by Drug Type 2019 & 2032
- Table 79: Global Drug Discovery Industry Revenue Million Forecast, by Technology 2019 & 2032
- Table 80: Global Drug Discovery Industry Volume K Unit Forecast, by Technology 2019 & 2032
- Table 81: Global Drug Discovery Industry Revenue Million Forecast, by End User 2019 & 2032
- Table 82: Global Drug Discovery Industry Volume K Unit Forecast, by End User 2019 & 2032
- Table 83: Global Drug Discovery Industry Revenue Million Forecast, by Country 2019 & 2032
- Table 84: Global Drug Discovery Industry Volume K Unit Forecast, by Country 2019 & 2032
- Table 85: United Kingdom Drug Discovery Industry Revenue (Million) Forecast, by Application 2019 & 2032
- Table 86: United Kingdom Drug Discovery Industry Volume (K Unit) Forecast, by Application 2019 & 2032
- Table 87: Germany Drug Discovery Industry Revenue (Million) Forecast, by Application 2019 & 2032
- Table 88: Germany Drug Discovery Industry Volume (K Unit) Forecast, by Application 2019 & 2032
- Table 89: France Drug Discovery Industry Revenue (Million) Forecast, by Application 2019 & 2032
- Table 90: France Drug Discovery Industry Volume (K Unit) Forecast, by Application 2019 & 2032
- Table 91: Italy Drug Discovery Industry Revenue (Million) Forecast, by Application 2019 & 2032
- Table 92: Italy Drug Discovery Industry Volume (K Unit) Forecast, by Application 2019 & 2032
- Table 93: Spain Drug Discovery Industry Revenue (Million) Forecast, by Application 2019 & 2032
- Table 94: Spain Drug Discovery Industry Volume (K Unit) Forecast, by Application 2019 & 2032
- Table 95: Rest of Europe Drug Discovery Industry Revenue (Million) Forecast, by Application 2019 & 2032
- Table 96: Rest of Europe Drug Discovery Industry Volume (K Unit) Forecast, by Application 2019 & 2032
- Table 97: Global Drug Discovery Industry Revenue Million Forecast, by Drug Type 2019 & 2032
- Table 98: Global Drug Discovery Industry Volume K Unit Forecast, by Drug Type 2019 & 2032
- Table 99: Global Drug Discovery Industry Revenue Million Forecast, by Technology 2019 & 2032
- Table 100: Global Drug Discovery Industry Volume K Unit Forecast, by Technology 2019 & 2032
- Table 101: Global Drug Discovery Industry Revenue Million Forecast, by End User 2019 & 2032
- Table 102: Global Drug Discovery Industry Volume K Unit Forecast, by End User 2019 & 2032
- Table 103: Global Drug Discovery Industry Revenue Million Forecast, by Country 2019 & 2032
- Table 104: Global Drug Discovery Industry Volume K Unit Forecast, by Country 2019 & 2032
- Table 105: China Drug Discovery Industry Revenue (Million) Forecast, by Application 2019 & 2032
- Table 106: China Drug Discovery Industry Volume (K Unit) Forecast, by Application 2019 & 2032
- Table 107: Japan Drug Discovery Industry Revenue (Million) Forecast, by Application 2019 & 2032
- Table 108: Japan Drug Discovery Industry Volume (K Unit) Forecast, by Application 2019 & 2032
- Table 109: India Drug Discovery Industry Revenue (Million) Forecast, by Application 2019 & 2032
- Table 110: India Drug Discovery Industry Volume (K Unit) Forecast, by Application 2019 & 2032
- Table 111: Australia Drug Discovery Industry Revenue (Million) Forecast, by Application 2019 & 2032
- Table 112: Australia Drug Discovery Industry Volume (K Unit) Forecast, by Application 2019 & 2032
- Table 113: South Korea Drug Discovery Industry Revenue (Million) Forecast, by Application 2019 & 2032
- Table 114: South Korea Drug Discovery Industry Volume (K Unit) Forecast, by Application 2019 & 2032
- Table 115: Rest of Asia Pacific Drug Discovery Industry Revenue (Million) Forecast, by Application 2019 & 2032
- Table 116: Rest of Asia Pacific Drug Discovery Industry Volume (K Unit) Forecast, by Application 2019 & 2032
- Table 117: Global Drug Discovery Industry Revenue Million Forecast, by Drug Type 2019 & 2032
- Table 118: Global Drug Discovery Industry Volume K Unit Forecast, by Drug Type 2019 & 2032
- Table 119: Global Drug Discovery Industry Revenue Million Forecast, by Technology 2019 & 2032
- Table 120: Global Drug Discovery Industry Volume K Unit Forecast, by Technology 2019 & 2032
- Table 121: Global Drug Discovery Industry Revenue Million Forecast, by End User 2019 & 2032
- Table 122: Global Drug Discovery Industry Volume K Unit Forecast, by End User 2019 & 2032
- Table 123: Global Drug Discovery Industry Revenue Million Forecast, by Country 2019 & 2032
- Table 124: Global Drug Discovery Industry Volume K Unit Forecast, by Country 2019 & 2032
- Table 125: GCC Drug Discovery Industry Revenue (Million) Forecast, by Application 2019 & 2032
- Table 126: GCC Drug Discovery Industry Volume (K Unit) Forecast, by Application 2019 & 2032
- Table 127: South Africa Drug Discovery Industry Revenue (Million) Forecast, by Application 2019 & 2032
- Table 128: South Africa Drug Discovery Industry Volume (K Unit) Forecast, by Application 2019 & 2032
- Table 129: Rest of Middle East and Africa Drug Discovery Industry Revenue (Million) Forecast, by Application 2019 & 2032
- Table 130: Rest of Middle East and Africa Drug Discovery Industry Volume (K Unit) Forecast, by Application 2019 & 2032
- Table 131: Global Drug Discovery Industry Revenue Million Forecast, by Drug Type 2019 & 2032
- Table 132: Global Drug Discovery Industry Volume K Unit Forecast, by Drug Type 2019 & 2032
- Table 133: Global Drug Discovery Industry Revenue Million Forecast, by Technology 2019 & 2032
- Table 134: Global Drug Discovery Industry Volume K Unit Forecast, by Technology 2019 & 2032
- Table 135: Global Drug Discovery Industry Revenue Million Forecast, by End User 2019 & 2032
- Table 136: Global Drug Discovery Industry Volume K Unit Forecast, by End User 2019 & 2032
- Table 137: Global Drug Discovery Industry Revenue Million Forecast, by Country 2019 & 2032
- Table 138: Global Drug Discovery Industry Volume K Unit Forecast, by Country 2019 & 2032
- Table 139: Brazil Drug Discovery Industry Revenue (Million) Forecast, by Application 2019 & 2032
- Table 140: Brazil Drug Discovery Industry Volume (K Unit) Forecast, by Application 2019 & 2032
- Table 141: Argentina Drug Discovery Industry Revenue (Million) Forecast, by Application 2019 & 2032
- Table 142: Argentina Drug Discovery Industry Volume (K Unit) Forecast, by Application 2019 & 2032
- Table 143: Rest of South America Drug Discovery Industry Revenue (Million) Forecast, by Application 2019 & 2032
- Table 144: Rest of South America Drug Discovery Industry Volume (K Unit) Forecast, by Application 2019 & 2032
Frequently Asked Questions
1. What is the projected Compound Annual Growth Rate (CAGR) of the Drug Discovery Industry?
The projected CAGR is approximately 6.59%.
2. Which companies are prominent players in the Drug Discovery Industry?
Key companies in the market include Bayer AG, Novartis, Merck & Co Inc, F Hoffmann-La Roche Ltd, AstraZeneca PLC, Sanofi, Eli Lilly and Company, Takeda Pharmaceuticals, AbbVie Inc, Bristol-Myers Squibb Company, GlaxoSmithKline PLC, Pfizer Inc.
3. What are the main segments of the Drug Discovery Industry?
The market segments include Drug Type, Technology, End User.
4. Can you provide details about the market size?
The market size is estimated to be USD 100.10 Million as of 2022.
5. What are some drivers contributing to market growth?
Rising Burden of Various Chronic Diseases; Increasing R&D Expenditure and Investment in the Development of Novel Drug Molecules.
6. What are the notable trends driving market growth?
Biologics Drug Segment is Expected to Show a Significant Growth Over the Forecast Period..
7. Are there any restraints impacting market growth?
Huge Capital Investment with Low Profit Margins; Stringent Government Regulations.
8. Can you provide examples of recent developments in the market?
October 2022: Verge Genomics, a clinical-stage and technology-enabled biotechnology company pioneering the use of artificial intelligence (AI) and human data to transform drug discovery, announced dosing the first subject in its Phase 1 clinical trial of VRG50635.
9. What pricing options are available for accessing the report?
Pricing options include single-user, multi-user, and enterprise licenses priced at USD 4750, USD 5250, and USD 8750 respectively.
10. Is the market size provided in terms of value or volume?
The market size is provided in terms of value, measured in Million and volume, measured in K Unit.
11. Are there any specific market keywords associated with the report?
Yes, the market keyword associated with the report is "Drug Discovery Industry," which aids in identifying and referencing the specific market segment covered.
12. How do I determine which pricing option suits my needs best?
The pricing options vary based on user requirements and access needs. Individual users may opt for single-user licenses, while businesses requiring broader access may choose multi-user or enterprise licenses for cost-effective access to the report.
13. Are there any additional resources or data provided in the Drug Discovery Industry report?
While the report offers comprehensive insights, it's advisable to review the specific contents or supplementary materials provided to ascertain if additional resources or data are available.
14. How can I stay updated on further developments or reports in the Drug Discovery Industry?
To stay informed about further developments, trends, and reports in the Drug Discovery Industry, consider subscribing to industry newsletters, following relevant companies and organizations, or regularly checking reputable industry news sources and publications.
Methodology
Step 1 - Identification of Relevant Samples Size from Population Database


Step 2 - Approaches for Defining Global Market Size (Value, Volume* & Price*)

Note*: In applicable scenarios
Step 3 - Data Sources
Primary Research
- Web Analytics
- Survey Reports
- Research Institute
- Latest Research Reports
- Opinion Leaders
Secondary Research
- Annual Reports
- White Paper
- Latest Press Release
- Industry Association
- Paid Database
- Investor Presentations

Step 4 - Data Triangulation
Involves using different sources of information in order to increase the validity of a study
These sources are likely to be stakeholders in a program - participants, other researchers, program staff, other community members, and so on.
Then we put all data in single framework & apply various statistical tools to find out the dynamic on the market.
During the analysis stage, feedback from the stakeholder groups would be compared to determine areas of agreement as well as areas of divergence


