
Key Insights
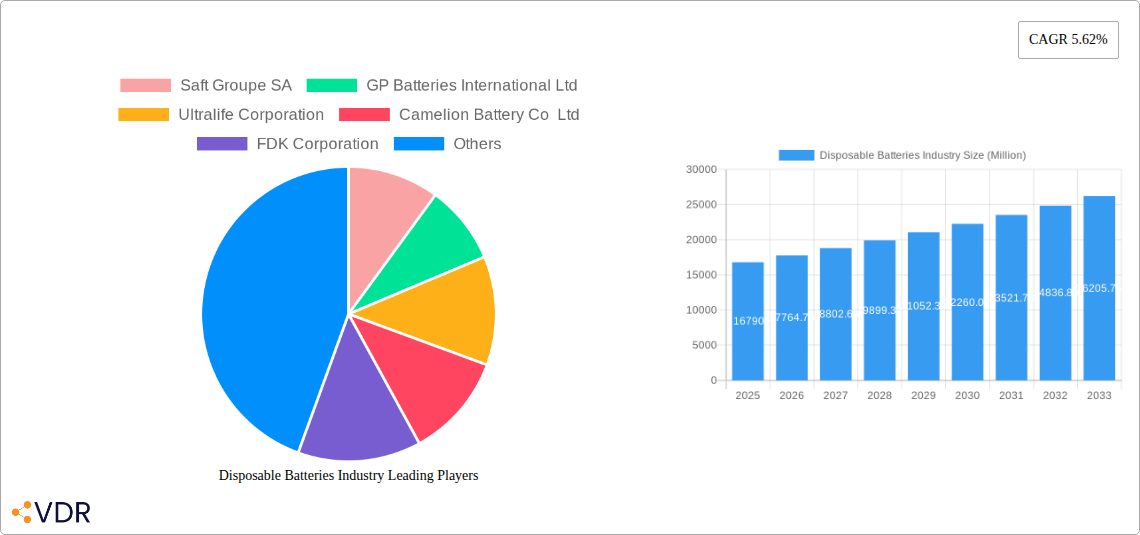
The disposable battery market, valued at $16.79 billion in 2025, is projected to experience steady growth, exhibiting a Compound Annual Growth Rate (CAGR) of 5.62% from 2025 to 2033. This growth is driven by several factors. The increasing demand for portable electronic devices, such as smartphones, remote controls, and toys, fuels significant consumption of disposable batteries, particularly primary alkaline and lithium variants. Furthermore, the expanding e-commerce sector and accessibility of these batteries across diverse retail channels contribute to market expansion. However, growing environmental concerns surrounding battery waste and the rise of rechargeable alternatives pose considerable restraints. Regulations promoting responsible disposal and recycling are anticipated to mitigate some of these challenges, although the shift towards sustainability remains a major factor influencing long-term market dynamics. The market is segmented by battery type, with primary alkaline batteries holding the largest share, followed by primary lithium batteries, catering to specific high-energy applications. Geographically, North America and Asia-Pacific currently dominate the market due to high consumption rates and robust manufacturing capacities, though other regions are expected to witness growth driven by increasing urbanization and rising disposable incomes. The competitive landscape is characterized by both established players like Duracell, Energizer, and Panasonic, as well as regional manufacturers. Ongoing innovation in battery technology, focusing on improved energy density and longer lifespan, is expected to shape future market trends.
The forecast period (2025-2033) will witness continuous growth, fueled by factors like advancements in miniaturization for electronics and increasing demand in emerging economies. However, price fluctuations in raw materials and the intensifying competition from rechargeable battery technologies will present challenges. The market's segmentation by region offers lucrative opportunities for targeted strategies. Companies are expected to invest in research and development to improve product performance and environmental impact. Strategic partnerships and mergers and acquisitions will likely be used to enhance market share and expand geographic reach. The successful companies in this market will balance the demand for affordable, reliable disposable batteries with the growing pressure to create more sustainable alternatives.
Disposable Batteries Industry: A Comprehensive Market Report (2019-2033)
This in-depth report provides a comprehensive analysis of the Disposable Batteries industry, encompassing market dynamics, growth trends, regional performance, key players, and future outlook. The study period covers 2019-2033, with 2025 serving as the base and estimated year. The report segments the market by type (Primary Alkaline Battery, Primary Lithium Battery, Other Types) and analyzes key players such as Saft Groupe SA, GP Batteries International Ltd, Ultralife Corporation, Camelion Battery Co Ltd, FDK Corporation, Toshiba Corporation, Duracell Inc, Energizer Holdings Inc, and Panasonic Corporation. This analysis is crucial for businesses looking to navigate this evolving landscape. The market size is projected to reach xx Million units by 2033.
Disposable Batteries Industry Market Dynamics & Structure
The disposable battery market is characterized by moderate concentration, with several major players dominating global sales. Technological innovation, particularly in energy density and material science, is a key driver. Regulatory frameworks concerning environmental impact and hazardous waste management significantly influence market operations. Competitive substitutes, such as rechargeable batteries, pose a challenge. End-user demographics are diverse, spanning various sectors including consumer electronics, medical devices, and industrial applications. Mergers and acquisitions (M&A) activity is relatively moderate, with strategic alliances focused on expanding market reach and technological capabilities.
- Market Concentration: Moderately concentrated, with top 5 players holding approximately xx% market share (2024).
- Technological Innovation: Focus on enhanced energy density, improved safety features, and eco-friendly materials.
- Regulatory Landscape: Stringent regulations on hazardous waste disposal and environmental impact in several regions.
- Competitive Substitutes: Rechargeable batteries are a significant competitive threat, increasing adoption for certain applications.
- M&A Activity: Moderate level of consolidation, primarily driven by strategic acquisitions of smaller players for technology or market expansion.
- Innovation Barriers: High R&D costs, complex regulatory approvals, and consumer preference for rechargeable options.
Disposable Batteries Industry Growth Trends & Insights
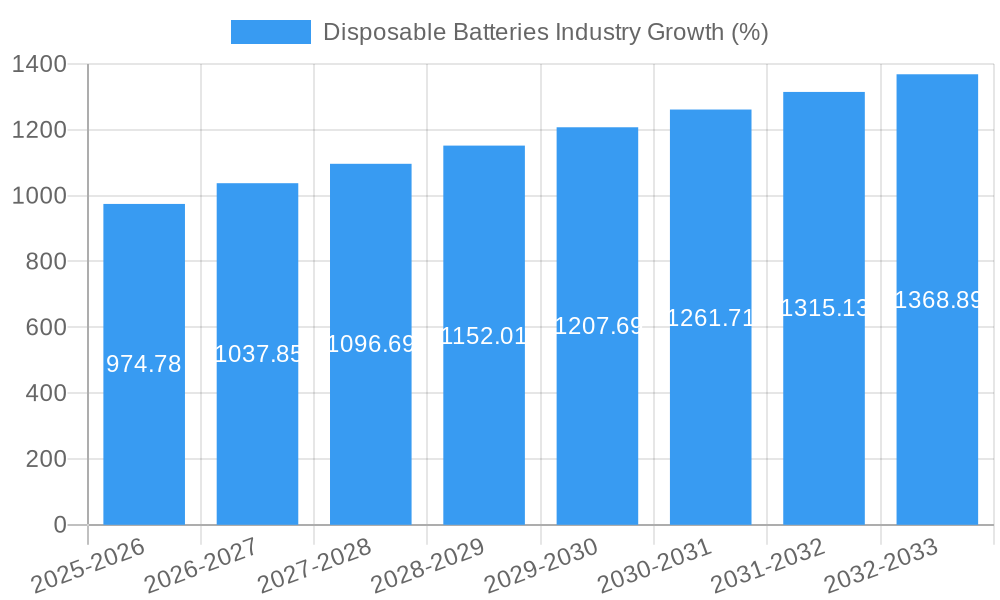
The disposable battery market witnessed steady growth during the historical period (2019-2024), primarily driven by sustained demand from various end-use sectors. However, the growth rate is expected to moderate slightly in the forecast period (2025-2033) due to the increasing adoption of rechargeable batteries. Despite this, the market will maintain a sizable presence due to specific applications requiring non-rechargeable solutions and regional variations in technology adoption. Technological advancements, particularly in material science leading to longer lifespan and improved performance, will contribute to moderate market growth. Consumer behavior is shifting toward environmentally friendly options, creating both opportunities and challenges for manufacturers.
- Market Size Evolution: From xx Million units in 2019 to xx Million units in 2024, projected to xx Million units in 2033.
- CAGR (2019-2024): xx%
- CAGR (2025-2033): xx%
- Market Penetration: High penetration in certain segments (e.g., consumer electronics) but lower in others (e.g., specialized medical devices).
- Technological Disruptions: Advancements in energy density and battery chemistry impact market competition.
- Consumer Behavior Shifts: Increasing preference for environmentally responsible products and a growing awareness of battery waste management.
Dominant Regions, Countries, or Segments in Disposable Batteries Industry
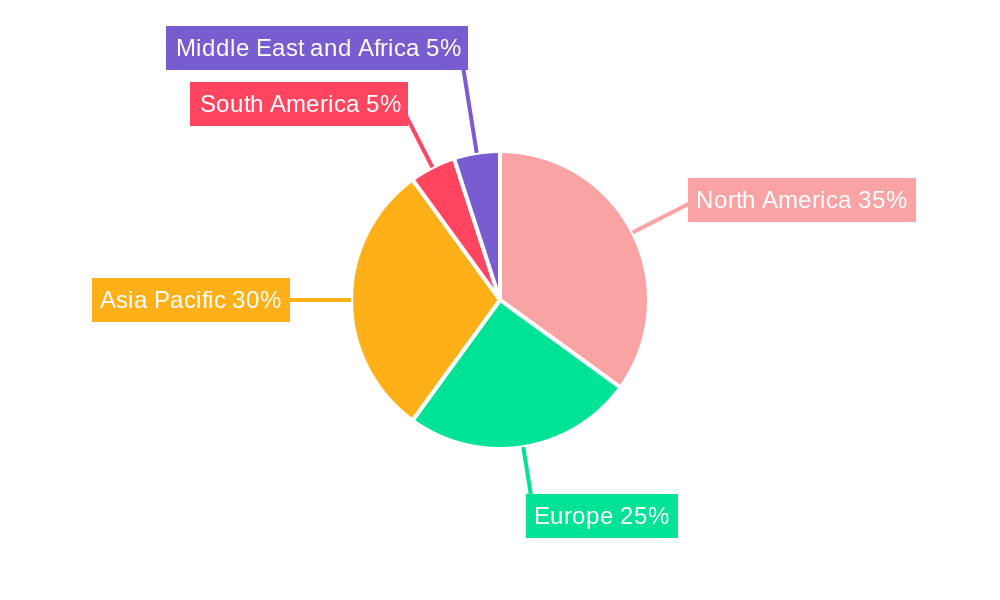
Asia Pacific is expected to be the leading region in terms of disposable battery consumption, driven by rapid economic growth and high demand from the consumer electronics and industrial sectors. Within this region, China and India stand out as significant markets. Within the product segments, the Primary Alkaline Battery segment maintains the largest market share due to its cost-effectiveness, but the Primary Lithium Battery segment is exhibiting faster growth, fueled by its higher energy density and suitability for specialized applications.
- Asia Pacific Dominance: Driven by high population density, rapid economic growth, and strong demand from various industries.
- China and India: Key markets within Asia Pacific exhibiting high growth trajectories.
- Primary Alkaline Battery: Largest market segment due to affordability and widespread applications.
- Primary Lithium Battery: Fastest-growing segment, driven by demand for higher energy density in specialized devices.
- Other Types: Includes specialized batteries like zinc-air and silver-oxide batteries, showing niche market growth.
- Key Growth Drivers: Strong economic growth, increasing disposable incomes, and expanding consumer electronics market.
Disposable Batteries Industry Product Landscape
The disposable battery market offers a diverse product range, including various types of alkaline, lithium, and other specialized batteries. Recent innovations focus on improving energy density, extending shelf life, and enhancing safety features. Key innovations include advanced electrode materials, optimized battery chemistries, and enhanced packaging to prevent leakage. These advancements target specific applications, such as medical implants (requiring high reliability and miniaturization) or industrial tools (needing high energy output). Unique selling propositions emphasize longer lifespan, enhanced safety, and improved performance compared to competitors.
Key Drivers, Barriers & Challenges in Disposable Batteries Industry
Key Drivers:
- Increasing demand from consumer electronics and industrial applications.
- Advancements in battery technology leading to higher energy density and longer lifespan.
- Expansion of emerging economies driving higher consumption.
Key Barriers and Challenges:
- Growing preference for rechargeable batteries, which pose a significant competitive threat.
- Environmental concerns and stringent regulations on hazardous waste disposal.
- Fluctuations in raw material prices impacting production costs. The projected impact of raw material price volatility on 2025 production costs is estimated at xx%.
Emerging Opportunities in Disposable Batteries Industry
- Growing demand for high-capacity batteries in portable electronic devices.
- Expansion into specialized applications in healthcare and industrial settings.
- Development of eco-friendly and sustainable battery technologies.
- Focus on improving battery safety and reducing environmental impact.
Growth Accelerators in the Disposable Batteries Industry Industry
Technological breakthroughs in energy density and battery life are pivotal in driving long-term growth. Strategic partnerships between manufacturers and end-users facilitate customized battery solutions. Market expansion into emerging economies with increasing demand presents significant opportunities. Furthermore, a focus on eco-friendly materials and sustainable manufacturing practices will attract environmentally conscious consumers and meet growing regulatory demands.
Key Players Shaping the Disposable Batteries Industry Market
- Saft Groupe SA
- GP Batteries International Ltd
- Ultralife Corporation
- Camelion Battery Co Ltd
- FDK Corporation
- Toshiba Corporation
- Duracell Inc
- Energizer Holdings Inc
- Panasonic Corporation
Notable Milestones in Disposable Batteries Industry Sector
- September 2023: Technology Development Board (TDB) partners with Aloe Ecell Pvt Ltd to promote sustainable battery solutions under 'Mission LiFE'.
- November 2022: MIT researchers invent new methods to improve primary battery energy density by up to 50%, impacting size, weight, and lifespan.
- March 2022: FDK Corporation consolidates its high-capacity cylindrical primary lithium battery production to a single location (Tottori Plant).
In-Depth Disposable Batteries Industry Market Outlook
The disposable battery market is poised for moderate growth in the coming years. While rechargeable batteries are gaining traction, the demand for disposable batteries in niche applications will persist. Opportunities lie in developing high-performance, eco-friendly batteries and expanding into emerging markets. Strategic partnerships, technological innovation, and a focus on sustainability will be crucial for companies to thrive in this competitive landscape.
Disposable Batteries Industry Segmentation
-
1. Type
- 1.1. Primary Alkaline Battery
- 1.2. Primary Lithium Battery
- 1.3. Other Types
Disposable Batteries Industry Segmentation By Geography
-
1. North America
- 1.1. United States
- 1.2. Canada
- 1.3. Rest of North America
-
2. Europe
- 2.1. Germany
- 2.2. France
- 2.3. United Kingdom
- 2.4. Russia
- 2.5. Rest of Europe
-
3. Asia Pacific
- 3.1. China
- 3.2. Japan
- 3.3. Thailand
- 3.4. Indonesia
- 3.5. Malaysia
- 3.6. India
- 3.7. Rest of Asia Pacific
-
4. South America
- 4.1. Brazil
- 4.2. Argentina
- 4.3. Rest of South America
-
5. Middle East and Africa
- 5.1. Saudi Arabia
- 5.2. United Arab Emirates
- 5.3. South Africa
- 5.4. Rest of Middle East and Africa
Disposable Batteries Industry REPORT HIGHLIGHTS
| Aspects | Details |
|---|---|
| Study Period | 2019-2033 |
| Base Year | 2024 |
| Estimated Year | 2025 |
| Forecast Period | 2025-2033 |
| Historical Period | 2019-2024 |
| Growth Rate | CAGR of 5.62% from 2019-2033 |
| Segmentation |
|
Table of Contents
- 1. Introduction
- 1.1. Research Scope
- 1.2. Market Segmentation
- 1.3. Research Methodology
- 1.4. Definitions and Assumptions
- 2. Executive Summary
- 2.1. Introduction
- 3. Market Dynamics
- 3.1. Introduction
- 3.2. Market Drivers
- 3.2.1. 4.; Growing Consumer Electronics Market4.; Increasing Adoption of Primary Batteries in the Healthcare Sector
- 3.3. Market Restrains
- 3.3.1. 4.; Limited Investments to Support Medium-voltage Transmission Network
- 3.4. Market Trends
- 3.4.1. Primary Alkaline Battery Expected to Dominate the Market
- 4. Market Factor Analysis
- 4.1. Porters Five Forces
- 4.2. Supply/Value Chain
- 4.3. PESTEL analysis
- 4.4. Market Entropy
- 4.5. Patent/Trademark Analysis
- 5. Global Disposable Batteries Industry Analysis, Insights and Forecast, 2019-2031
- 5.1. Market Analysis, Insights and Forecast - by Type
- 5.1.1. Primary Alkaline Battery
- 5.1.2. Primary Lithium Battery
- 5.1.3. Other Types
- 5.2. Market Analysis, Insights and Forecast - by Region
- 5.2.1. North America
- 5.2.2. Europe
- 5.2.3. Asia Pacific
- 5.2.4. South America
- 5.2.5. Middle East and Africa
- 5.1. Market Analysis, Insights and Forecast - by Type
- 6. North America Disposable Batteries Industry Analysis, Insights and Forecast, 2019-2031
- 6.1. Market Analysis, Insights and Forecast - by Type
- 6.1.1. Primary Alkaline Battery
- 6.1.2. Primary Lithium Battery
- 6.1.3. Other Types
- 6.1. Market Analysis, Insights and Forecast - by Type
- 7. Europe Disposable Batteries Industry Analysis, Insights and Forecast, 2019-2031
- 7.1. Market Analysis, Insights and Forecast - by Type
- 7.1.1. Primary Alkaline Battery
- 7.1.2. Primary Lithium Battery
- 7.1.3. Other Types
- 7.1. Market Analysis, Insights and Forecast - by Type
- 8. Asia Pacific Disposable Batteries Industry Analysis, Insights and Forecast, 2019-2031
- 8.1. Market Analysis, Insights and Forecast - by Type
- 8.1.1. Primary Alkaline Battery
- 8.1.2. Primary Lithium Battery
- 8.1.3. Other Types
- 8.1. Market Analysis, Insights and Forecast - by Type
- 9. South America Disposable Batteries Industry Analysis, Insights and Forecast, 2019-2031
- 9.1. Market Analysis, Insights and Forecast - by Type
- 9.1.1. Primary Alkaline Battery
- 9.1.2. Primary Lithium Battery
- 9.1.3. Other Types
- 9.1. Market Analysis, Insights and Forecast - by Type
- 10. Middle East and Africa Disposable Batteries Industry Analysis, Insights and Forecast, 2019-2031
- 10.1. Market Analysis, Insights and Forecast - by Type
- 10.1.1. Primary Alkaline Battery
- 10.1.2. Primary Lithium Battery
- 10.1.3. Other Types
- 10.1. Market Analysis, Insights and Forecast - by Type
- 11. North America Disposable Batteries Industry Analysis, Insights and Forecast, 2019-2031
- 11.1. Market Analysis, Insights and Forecast - By Country/Sub-region
- 11.1.1 United States
- 11.1.2 Canada
- 11.1.3 Rest of North America
- 12. Europe Disposable Batteries Industry Analysis, Insights and Forecast, 2019-2031
- 12.1. Market Analysis, Insights and Forecast - By Country/Sub-region
- 12.1.1 Germany
- 12.1.2 France
- 12.1.3 United Kingdom
- 12.1.4 Russia
- 12.1.5 Rest of Europe
- 13. Asia Pacific Disposable Batteries Industry Analysis, Insights and Forecast, 2019-2031
- 13.1. Market Analysis, Insights and Forecast - By Country/Sub-region
- 13.1.1 China
- 13.1.2 Japan
- 13.1.3 Thailand
- 13.1.4 Indonesia
- 13.1.5 Malaysia
- 13.1.6 India
- 13.1.7 Rest of Asia Pacific
- 14. South America Disposable Batteries Industry Analysis, Insights and Forecast, 2019-2031
- 14.1. Market Analysis, Insights and Forecast - By Country/Sub-region
- 14.1.1 Brazil
- 14.1.2 Argentina
- 14.1.3 Rest of South America
- 15. Middle East and Africa Disposable Batteries Industry Analysis, Insights and Forecast, 2019-2031
- 15.1. Market Analysis, Insights and Forecast - By Country/Sub-region
- 15.1.1 Saudi Arabia
- 15.1.2 United Arab Emirates
- 15.1.3 South Africa
- 15.1.4 Rest of Middle East and Africa
- 16. Competitive Analysis
- 16.1. Global Market Share Analysis 2024
- 16.2. Company Profiles
- 16.2.1 Saft Groupe SA
- 16.2.1.1. Overview
- 16.2.1.2. Products
- 16.2.1.3. SWOT Analysis
- 16.2.1.4. Recent Developments
- 16.2.1.5. Financials (Based on Availability)
- 16.2.2 GP Batteries International Ltd
- 16.2.2.1. Overview
- 16.2.2.2. Products
- 16.2.2.3. SWOT Analysis
- 16.2.2.4. Recent Developments
- 16.2.2.5. Financials (Based on Availability)
- 16.2.3 Ultralife Corporation
- 16.2.3.1. Overview
- 16.2.3.2. Products
- 16.2.3.3. SWOT Analysis
- 16.2.3.4. Recent Developments
- 16.2.3.5. Financials (Based on Availability)
- 16.2.4 Camelion Battery Co Ltd
- 16.2.4.1. Overview
- 16.2.4.2. Products
- 16.2.4.3. SWOT Analysis
- 16.2.4.4. Recent Developments
- 16.2.4.5. Financials (Based on Availability)
- 16.2.5 FDK Corporation
- 16.2.5.1. Overview
- 16.2.5.2. Products
- 16.2.5.3. SWOT Analysis
- 16.2.5.4. Recent Developments
- 16.2.5.5. Financials (Based on Availability)
- 16.2.6 Toshiba Corporation*List Not Exhaustive
- 16.2.6.1. Overview
- 16.2.6.2. Products
- 16.2.6.3. SWOT Analysis
- 16.2.6.4. Recent Developments
- 16.2.6.5. Financials (Based on Availability)
- 16.2.7 Duracell Inc
- 16.2.7.1. Overview
- 16.2.7.2. Products
- 16.2.7.3. SWOT Analysis
- 16.2.7.4. Recent Developments
- 16.2.7.5. Financials (Based on Availability)
- 16.2.8 Energizer Holdings Inc
- 16.2.8.1. Overview
- 16.2.8.2. Products
- 16.2.8.3. SWOT Analysis
- 16.2.8.4. Recent Developments
- 16.2.8.5. Financials (Based on Availability)
- 16.2.9 Panasonic Corporation
- 16.2.9.1. Overview
- 16.2.9.2. Products
- 16.2.9.3. SWOT Analysis
- 16.2.9.4. Recent Developments
- 16.2.9.5. Financials (Based on Availability)
- 16.2.1 Saft Groupe SA
List of Figures
- Figure 1: Global Disposable Batteries Industry Revenue Breakdown (Million, %) by Region 2024 & 2032
- Figure 2: Global Disposable Batteries Industry Volume Breakdown (Kiloton, %) by Region 2024 & 2032
- Figure 3: North America Disposable Batteries Industry Revenue (Million), by Country 2024 & 2032
- Figure 4: North America Disposable Batteries Industry Volume (Kiloton), by Country 2024 & 2032
- Figure 5: North America Disposable Batteries Industry Revenue Share (%), by Country 2024 & 2032
- Figure 6: North America Disposable Batteries Industry Volume Share (%), by Country 2024 & 2032
- Figure 7: Europe Disposable Batteries Industry Revenue (Million), by Country 2024 & 2032
- Figure 8: Europe Disposable Batteries Industry Volume (Kiloton), by Country 2024 & 2032
- Figure 9: Europe Disposable Batteries Industry Revenue Share (%), by Country 2024 & 2032
- Figure 10: Europe Disposable Batteries Industry Volume Share (%), by Country 2024 & 2032
- Figure 11: Asia Pacific Disposable Batteries Industry Revenue (Million), by Country 2024 & 2032
- Figure 12: Asia Pacific Disposable Batteries Industry Volume (Kiloton), by Country 2024 & 2032
- Figure 13: Asia Pacific Disposable Batteries Industry Revenue Share (%), by Country 2024 & 2032
- Figure 14: Asia Pacific Disposable Batteries Industry Volume Share (%), by Country 2024 & 2032
- Figure 15: South America Disposable Batteries Industry Revenue (Million), by Country 2024 & 2032
- Figure 16: South America Disposable Batteries Industry Volume (Kiloton), by Country 2024 & 2032
- Figure 17: South America Disposable Batteries Industry Revenue Share (%), by Country 2024 & 2032
- Figure 18: South America Disposable Batteries Industry Volume Share (%), by Country 2024 & 2032
- Figure 19: Middle East and Africa Disposable Batteries Industry Revenue (Million), by Country 2024 & 2032
- Figure 20: Middle East and Africa Disposable Batteries Industry Volume (Kiloton), by Country 2024 & 2032
- Figure 21: Middle East and Africa Disposable Batteries Industry Revenue Share (%), by Country 2024 & 2032
- Figure 22: Middle East and Africa Disposable Batteries Industry Volume Share (%), by Country 2024 & 2032
- Figure 23: North America Disposable Batteries Industry Revenue (Million), by Type 2024 & 2032
- Figure 24: North America Disposable Batteries Industry Volume (Kiloton), by Type 2024 & 2032
- Figure 25: North America Disposable Batteries Industry Revenue Share (%), by Type 2024 & 2032
- Figure 26: North America Disposable Batteries Industry Volume Share (%), by Type 2024 & 2032
- Figure 27: North America Disposable Batteries Industry Revenue (Million), by Country 2024 & 2032
- Figure 28: North America Disposable Batteries Industry Volume (Kiloton), by Country 2024 & 2032
- Figure 29: North America Disposable Batteries Industry Revenue Share (%), by Country 2024 & 2032
- Figure 30: North America Disposable Batteries Industry Volume Share (%), by Country 2024 & 2032
- Figure 31: Europe Disposable Batteries Industry Revenue (Million), by Type 2024 & 2032
- Figure 32: Europe Disposable Batteries Industry Volume (Kiloton), by Type 2024 & 2032
- Figure 33: Europe Disposable Batteries Industry Revenue Share (%), by Type 2024 & 2032
- Figure 34: Europe Disposable Batteries Industry Volume Share (%), by Type 2024 & 2032
- Figure 35: Europe Disposable Batteries Industry Revenue (Million), by Country 2024 & 2032
- Figure 36: Europe Disposable Batteries Industry Volume (Kiloton), by Country 2024 & 2032
- Figure 37: Europe Disposable Batteries Industry Revenue Share (%), by Country 2024 & 2032
- Figure 38: Europe Disposable Batteries Industry Volume Share (%), by Country 2024 & 2032
- Figure 39: Asia Pacific Disposable Batteries Industry Revenue (Million), by Type 2024 & 2032
- Figure 40: Asia Pacific Disposable Batteries Industry Volume (Kiloton), by Type 2024 & 2032
- Figure 41: Asia Pacific Disposable Batteries Industry Revenue Share (%), by Type 2024 & 2032
- Figure 42: Asia Pacific Disposable Batteries Industry Volume Share (%), by Type 2024 & 2032
- Figure 43: Asia Pacific Disposable Batteries Industry Revenue (Million), by Country 2024 & 2032
- Figure 44: Asia Pacific Disposable Batteries Industry Volume (Kiloton), by Country 2024 & 2032
- Figure 45: Asia Pacific Disposable Batteries Industry Revenue Share (%), by Country 2024 & 2032
- Figure 46: Asia Pacific Disposable Batteries Industry Volume Share (%), by Country 2024 & 2032
- Figure 47: South America Disposable Batteries Industry Revenue (Million), by Type 2024 & 2032
- Figure 48: South America Disposable Batteries Industry Volume (Kiloton), by Type 2024 & 2032
- Figure 49: South America Disposable Batteries Industry Revenue Share (%), by Type 2024 & 2032
- Figure 50: South America Disposable Batteries Industry Volume Share (%), by Type 2024 & 2032
- Figure 51: South America Disposable Batteries Industry Revenue (Million), by Country 2024 & 2032
- Figure 52: South America Disposable Batteries Industry Volume (Kiloton), by Country 2024 & 2032
- Figure 53: South America Disposable Batteries Industry Revenue Share (%), by Country 2024 & 2032
- Figure 54: South America Disposable Batteries Industry Volume Share (%), by Country 2024 & 2032
- Figure 55: Middle East and Africa Disposable Batteries Industry Revenue (Million), by Type 2024 & 2032
- Figure 56: Middle East and Africa Disposable Batteries Industry Volume (Kiloton), by Type 2024 & 2032
- Figure 57: Middle East and Africa Disposable Batteries Industry Revenue Share (%), by Type 2024 & 2032
- Figure 58: Middle East and Africa Disposable Batteries Industry Volume Share (%), by Type 2024 & 2032
- Figure 59: Middle East and Africa Disposable Batteries Industry Revenue (Million), by Country 2024 & 2032
- Figure 60: Middle East and Africa Disposable Batteries Industry Volume (Kiloton), by Country 2024 & 2032
- Figure 61: Middle East and Africa Disposable Batteries Industry Revenue Share (%), by Country 2024 & 2032
- Figure 62: Middle East and Africa Disposable Batteries Industry Volume Share (%), by Country 2024 & 2032
List of Tables
- Table 1: Global Disposable Batteries Industry Revenue Million Forecast, by Region 2019 & 2032
- Table 2: Global Disposable Batteries Industry Volume Kiloton Forecast, by Region 2019 & 2032
- Table 3: Global Disposable Batteries Industry Revenue Million Forecast, by Type 2019 & 2032
- Table 4: Global Disposable Batteries Industry Volume Kiloton Forecast, by Type 2019 & 2032
- Table 5: Global Disposable Batteries Industry Revenue Million Forecast, by Region 2019 & 2032
- Table 6: Global Disposable Batteries Industry Volume Kiloton Forecast, by Region 2019 & 2032
- Table 7: Global Disposable Batteries Industry Revenue Million Forecast, by Country 2019 & 2032
- Table 8: Global Disposable Batteries Industry Volume Kiloton Forecast, by Country 2019 & 2032
- Table 9: United States Disposable Batteries Industry Revenue (Million) Forecast, by Application 2019 & 2032
- Table 10: United States Disposable Batteries Industry Volume (Kiloton) Forecast, by Application 2019 & 2032
- Table 11: Canada Disposable Batteries Industry Revenue (Million) Forecast, by Application 2019 & 2032
- Table 12: Canada Disposable Batteries Industry Volume (Kiloton) Forecast, by Application 2019 & 2032
- Table 13: Rest of North America Disposable Batteries Industry Revenue (Million) Forecast, by Application 2019 & 2032
- Table 14: Rest of North America Disposable Batteries Industry Volume (Kiloton) Forecast, by Application 2019 & 2032
- Table 15: Global Disposable Batteries Industry Revenue Million Forecast, by Country 2019 & 2032
- Table 16: Global Disposable Batteries Industry Volume Kiloton Forecast, by Country 2019 & 2032
- Table 17: Germany Disposable Batteries Industry Revenue (Million) Forecast, by Application 2019 & 2032
- Table 18: Germany Disposable Batteries Industry Volume (Kiloton) Forecast, by Application 2019 & 2032
- Table 19: France Disposable Batteries Industry Revenue (Million) Forecast, by Application 2019 & 2032
- Table 20: France Disposable Batteries Industry Volume (Kiloton) Forecast, by Application 2019 & 2032
- Table 21: United Kingdom Disposable Batteries Industry Revenue (Million) Forecast, by Application 2019 & 2032
- Table 22: United Kingdom Disposable Batteries Industry Volume (Kiloton) Forecast, by Application 2019 & 2032
- Table 23: Russia Disposable Batteries Industry Revenue (Million) Forecast, by Application 2019 & 2032
- Table 24: Russia Disposable Batteries Industry Volume (Kiloton) Forecast, by Application 2019 & 2032
- Table 25: Rest of Europe Disposable Batteries Industry Revenue (Million) Forecast, by Application 2019 & 2032
- Table 26: Rest of Europe Disposable Batteries Industry Volume (Kiloton) Forecast, by Application 2019 & 2032
- Table 27: Global Disposable Batteries Industry Revenue Million Forecast, by Country 2019 & 2032
- Table 28: Global Disposable Batteries Industry Volume Kiloton Forecast, by Country 2019 & 2032
- Table 29: China Disposable Batteries Industry Revenue (Million) Forecast, by Application 2019 & 2032
- Table 30: China Disposable Batteries Industry Volume (Kiloton) Forecast, by Application 2019 & 2032
- Table 31: Japan Disposable Batteries Industry Revenue (Million) Forecast, by Application 2019 & 2032
- Table 32: Japan Disposable Batteries Industry Volume (Kiloton) Forecast, by Application 2019 & 2032
- Table 33: Thailand Disposable Batteries Industry Revenue (Million) Forecast, by Application 2019 & 2032
- Table 34: Thailand Disposable Batteries Industry Volume (Kiloton) Forecast, by Application 2019 & 2032
- Table 35: Indonesia Disposable Batteries Industry Revenue (Million) Forecast, by Application 2019 & 2032
- Table 36: Indonesia Disposable Batteries Industry Volume (Kiloton) Forecast, by Application 2019 & 2032
- Table 37: Malaysia Disposable Batteries Industry Revenue (Million) Forecast, by Application 2019 & 2032
- Table 38: Malaysia Disposable Batteries Industry Volume (Kiloton) Forecast, by Application 2019 & 2032
- Table 39: India Disposable Batteries Industry Revenue (Million) Forecast, by Application 2019 & 2032
- Table 40: India Disposable Batteries Industry Volume (Kiloton) Forecast, by Application 2019 & 2032
- Table 41: Rest of Asia Pacific Disposable Batteries Industry Revenue (Million) Forecast, by Application 2019 & 2032
- Table 42: Rest of Asia Pacific Disposable Batteries Industry Volume (Kiloton) Forecast, by Application 2019 & 2032
- Table 43: Global Disposable Batteries Industry Revenue Million Forecast, by Country 2019 & 2032
- Table 44: Global Disposable Batteries Industry Volume Kiloton Forecast, by Country 2019 & 2032
- Table 45: Brazil Disposable Batteries Industry Revenue (Million) Forecast, by Application 2019 & 2032
- Table 46: Brazil Disposable Batteries Industry Volume (Kiloton) Forecast, by Application 2019 & 2032
- Table 47: Argentina Disposable Batteries Industry Revenue (Million) Forecast, by Application 2019 & 2032
- Table 48: Argentina Disposable Batteries Industry Volume (Kiloton) Forecast, by Application 2019 & 2032
- Table 49: Rest of South America Disposable Batteries Industry Revenue (Million) Forecast, by Application 2019 & 2032
- Table 50: Rest of South America Disposable Batteries Industry Volume (Kiloton) Forecast, by Application 2019 & 2032
- Table 51: Global Disposable Batteries Industry Revenue Million Forecast, by Country 2019 & 2032
- Table 52: Global Disposable Batteries Industry Volume Kiloton Forecast, by Country 2019 & 2032
- Table 53: Saudi Arabia Disposable Batteries Industry Revenue (Million) Forecast, by Application 2019 & 2032
- Table 54: Saudi Arabia Disposable Batteries Industry Volume (Kiloton) Forecast, by Application 2019 & 2032
- Table 55: United Arab Emirates Disposable Batteries Industry Revenue (Million) Forecast, by Application 2019 & 2032
- Table 56: United Arab Emirates Disposable Batteries Industry Volume (Kiloton) Forecast, by Application 2019 & 2032
- Table 57: South Africa Disposable Batteries Industry Revenue (Million) Forecast, by Application 2019 & 2032
- Table 58: South Africa Disposable Batteries Industry Volume (Kiloton) Forecast, by Application 2019 & 2032
- Table 59: Rest of Middle East and Africa Disposable Batteries Industry Revenue (Million) Forecast, by Application 2019 & 2032
- Table 60: Rest of Middle East and Africa Disposable Batteries Industry Volume (Kiloton) Forecast, by Application 2019 & 2032
- Table 61: Global Disposable Batteries Industry Revenue Million Forecast, by Type 2019 & 2032
- Table 62: Global Disposable Batteries Industry Volume Kiloton Forecast, by Type 2019 & 2032
- Table 63: Global Disposable Batteries Industry Revenue Million Forecast, by Country 2019 & 2032
- Table 64: Global Disposable Batteries Industry Volume Kiloton Forecast, by Country 2019 & 2032
- Table 65: United States Disposable Batteries Industry Revenue (Million) Forecast, by Application 2019 & 2032
- Table 66: United States Disposable Batteries Industry Volume (Kiloton) Forecast, by Application 2019 & 2032
- Table 67: Canada Disposable Batteries Industry Revenue (Million) Forecast, by Application 2019 & 2032
- Table 68: Canada Disposable Batteries Industry Volume (Kiloton) Forecast, by Application 2019 & 2032
- Table 69: Rest of North America Disposable Batteries Industry Revenue (Million) Forecast, by Application 2019 & 2032
- Table 70: Rest of North America Disposable Batteries Industry Volume (Kiloton) Forecast, by Application 2019 & 2032
- Table 71: Global Disposable Batteries Industry Revenue Million Forecast, by Type 2019 & 2032
- Table 72: Global Disposable Batteries Industry Volume Kiloton Forecast, by Type 2019 & 2032
- Table 73: Global Disposable Batteries Industry Revenue Million Forecast, by Country 2019 & 2032
- Table 74: Global Disposable Batteries Industry Volume Kiloton Forecast, by Country 2019 & 2032
- Table 75: Germany Disposable Batteries Industry Revenue (Million) Forecast, by Application 2019 & 2032
- Table 76: Germany Disposable Batteries Industry Volume (Kiloton) Forecast, by Application 2019 & 2032
- Table 77: France Disposable Batteries Industry Revenue (Million) Forecast, by Application 2019 & 2032
- Table 78: France Disposable Batteries Industry Volume (Kiloton) Forecast, by Application 2019 & 2032
- Table 79: United Kingdom Disposable Batteries Industry Revenue (Million) Forecast, by Application 2019 & 2032
- Table 80: United Kingdom Disposable Batteries Industry Volume (Kiloton) Forecast, by Application 2019 & 2032
- Table 81: Russia Disposable Batteries Industry Revenue (Million) Forecast, by Application 2019 & 2032
- Table 82: Russia Disposable Batteries Industry Volume (Kiloton) Forecast, by Application 2019 & 2032
- Table 83: Rest of Europe Disposable Batteries Industry Revenue (Million) Forecast, by Application 2019 & 2032
- Table 84: Rest of Europe Disposable Batteries Industry Volume (Kiloton) Forecast, by Application 2019 & 2032
- Table 85: Global Disposable Batteries Industry Revenue Million Forecast, by Type 2019 & 2032
- Table 86: Global Disposable Batteries Industry Volume Kiloton Forecast, by Type 2019 & 2032
- Table 87: Global Disposable Batteries Industry Revenue Million Forecast, by Country 2019 & 2032
- Table 88: Global Disposable Batteries Industry Volume Kiloton Forecast, by Country 2019 & 2032
- Table 89: China Disposable Batteries Industry Revenue (Million) Forecast, by Application 2019 & 2032
- Table 90: China Disposable Batteries Industry Volume (Kiloton) Forecast, by Application 2019 & 2032
- Table 91: Japan Disposable Batteries Industry Revenue (Million) Forecast, by Application 2019 & 2032
- Table 92: Japan Disposable Batteries Industry Volume (Kiloton) Forecast, by Application 2019 & 2032
- Table 93: Thailand Disposable Batteries Industry Revenue (Million) Forecast, by Application 2019 & 2032
- Table 94: Thailand Disposable Batteries Industry Volume (Kiloton) Forecast, by Application 2019 & 2032
- Table 95: Indonesia Disposable Batteries Industry Revenue (Million) Forecast, by Application 2019 & 2032
- Table 96: Indonesia Disposable Batteries Industry Volume (Kiloton) Forecast, by Application 2019 & 2032
- Table 97: Malaysia Disposable Batteries Industry Revenue (Million) Forecast, by Application 2019 & 2032
- Table 98: Malaysia Disposable Batteries Industry Volume (Kiloton) Forecast, by Application 2019 & 2032
- Table 99: India Disposable Batteries Industry Revenue (Million) Forecast, by Application 2019 & 2032
- Table 100: India Disposable Batteries Industry Volume (Kiloton) Forecast, by Application 2019 & 2032
- Table 101: Rest of Asia Pacific Disposable Batteries Industry Revenue (Million) Forecast, by Application 2019 & 2032
- Table 102: Rest of Asia Pacific Disposable Batteries Industry Volume (Kiloton) Forecast, by Application 2019 & 2032
- Table 103: Global Disposable Batteries Industry Revenue Million Forecast, by Type 2019 & 2032
- Table 104: Global Disposable Batteries Industry Volume Kiloton Forecast, by Type 2019 & 2032
- Table 105: Global Disposable Batteries Industry Revenue Million Forecast, by Country 2019 & 2032
- Table 106: Global Disposable Batteries Industry Volume Kiloton Forecast, by Country 2019 & 2032
- Table 107: Brazil Disposable Batteries Industry Revenue (Million) Forecast, by Application 2019 & 2032
- Table 108: Brazil Disposable Batteries Industry Volume (Kiloton) Forecast, by Application 2019 & 2032
- Table 109: Argentina Disposable Batteries Industry Revenue (Million) Forecast, by Application 2019 & 2032
- Table 110: Argentina Disposable Batteries Industry Volume (Kiloton) Forecast, by Application 2019 & 2032
- Table 111: Rest of South America Disposable Batteries Industry Revenue (Million) Forecast, by Application 2019 & 2032
- Table 112: Rest of South America Disposable Batteries Industry Volume (Kiloton) Forecast, by Application 2019 & 2032
- Table 113: Global Disposable Batteries Industry Revenue Million Forecast, by Type 2019 & 2032
- Table 114: Global Disposable Batteries Industry Volume Kiloton Forecast, by Type 2019 & 2032
- Table 115: Global Disposable Batteries Industry Revenue Million Forecast, by Country 2019 & 2032
- Table 116: Global Disposable Batteries Industry Volume Kiloton Forecast, by Country 2019 & 2032
- Table 117: Saudi Arabia Disposable Batteries Industry Revenue (Million) Forecast, by Application 2019 & 2032
- Table 118: Saudi Arabia Disposable Batteries Industry Volume (Kiloton) Forecast, by Application 2019 & 2032
- Table 119: United Arab Emirates Disposable Batteries Industry Revenue (Million) Forecast, by Application 2019 & 2032
- Table 120: United Arab Emirates Disposable Batteries Industry Volume (Kiloton) Forecast, by Application 2019 & 2032
- Table 121: South Africa Disposable Batteries Industry Revenue (Million) Forecast, by Application 2019 & 2032
- Table 122: South Africa Disposable Batteries Industry Volume (Kiloton) Forecast, by Application 2019 & 2032
- Table 123: Rest of Middle East and Africa Disposable Batteries Industry Revenue (Million) Forecast, by Application 2019 & 2032
- Table 124: Rest of Middle East and Africa Disposable Batteries Industry Volume (Kiloton) Forecast, by Application 2019 & 2032
Frequently Asked Questions
1. What is the projected Compound Annual Growth Rate (CAGR) of the Disposable Batteries Industry?
The projected CAGR is approximately 5.62%.
2. Which companies are prominent players in the Disposable Batteries Industry?
Key companies in the market include Saft Groupe SA, GP Batteries International Ltd, Ultralife Corporation, Camelion Battery Co Ltd, FDK Corporation, Toshiba Corporation*List Not Exhaustive, Duracell Inc, Energizer Holdings Inc, Panasonic Corporation.
3. What are the main segments of the Disposable Batteries Industry?
The market segments include Type.
4. Can you provide details about the market size?
The market size is estimated to be USD 16.79 Million as of 2022.
5. What are some drivers contributing to market growth?
4.; Growing Consumer Electronics Market4.; Increasing Adoption of Primary Batteries in the Healthcare Sector.
6. What are the notable trends driving market growth?
Primary Alkaline Battery Expected to Dominate the Market.
7. Are there any restraints impacting market growth?
4.; Limited Investments to Support Medium-voltage Transmission Network.
8. Can you provide examples of recent developments in the market?
September 2023, in accordance with Prime Minister Narendra Modi's ambitious initiative 'Mission LiFE' (Lifestyle for Environment), the Technology Development Board (TDB) revealed its partnership with Aloe Ecell Pvt Ltd, an innovative startup based in Lucknow, Uttar Pradesh.
9. What pricing options are available for accessing the report?
Pricing options include single-user, multi-user, and enterprise licenses priced at USD 4750, USD 5250, and USD 8750 respectively.
10. Is the market size provided in terms of value or volume?
The market size is provided in terms of value, measured in Million and volume, measured in Kiloton.
11. Are there any specific market keywords associated with the report?
Yes, the market keyword associated with the report is "Disposable Batteries Industry," which aids in identifying and referencing the specific market segment covered.
12. How do I determine which pricing option suits my needs best?
The pricing options vary based on user requirements and access needs. Individual users may opt for single-user licenses, while businesses requiring broader access may choose multi-user or enterprise licenses for cost-effective access to the report.
13. Are there any additional resources or data provided in the Disposable Batteries Industry report?
While the report offers comprehensive insights, it's advisable to review the specific contents or supplementary materials provided to ascertain if additional resources or data are available.
14. How can I stay updated on further developments or reports in the Disposable Batteries Industry?
To stay informed about further developments, trends, and reports in the Disposable Batteries Industry, consider subscribing to industry newsletters, following relevant companies and organizations, or regularly checking reputable industry news sources and publications.
Methodology
Step 1 - Identification of Relevant Samples Size from Population Database


Step 2 - Approaches for Defining Global Market Size (Value, Volume* & Price*)

Note*: In applicable scenarios
Step 3 - Data Sources
Primary Research
- Web Analytics
- Survey Reports
- Research Institute
- Latest Research Reports
- Opinion Leaders
Secondary Research
- Annual Reports
- White Paper
- Latest Press Release
- Industry Association
- Paid Database
- Investor Presentations

Step 4 - Data Triangulation
Involves using different sources of information in order to increase the validity of a study
These sources are likely to be stakeholders in a program - participants, other researchers, program staff, other community members, and so on.
Then we put all data in single framework & apply various statistical tools to find out the dynamic on the market.
During the analysis stage, feedback from the stakeholder groups would be compared to determine areas of agreement as well as areas of divergence


