

Key Insights
The global Digital Power Supply market is poised for significant expansion, projected to reach an estimated $431 million by 2025, driven by a robust Compound Annual Growth Rate (CAGR) of 5.2% from 2019 to 2033. This sustained growth is primarily fueled by the escalating demand across critical sectors such as computer equipment, communication equipment, and medical devices, all of which rely heavily on precise and efficient power management solutions. The increasing complexity and miniaturization of electronic components necessitate advanced digital power supplies that offer superior control, programmability, and energy efficiency. Furthermore, the proliferation of IoT devices and the continuous advancements in telecommunications infrastructure are creating substantial opportunities for market players. Emerging applications in industrial automation and measurement equipment are also contributing to the market's upward trajectory, as industries increasingly adopt sophisticated digital control systems.
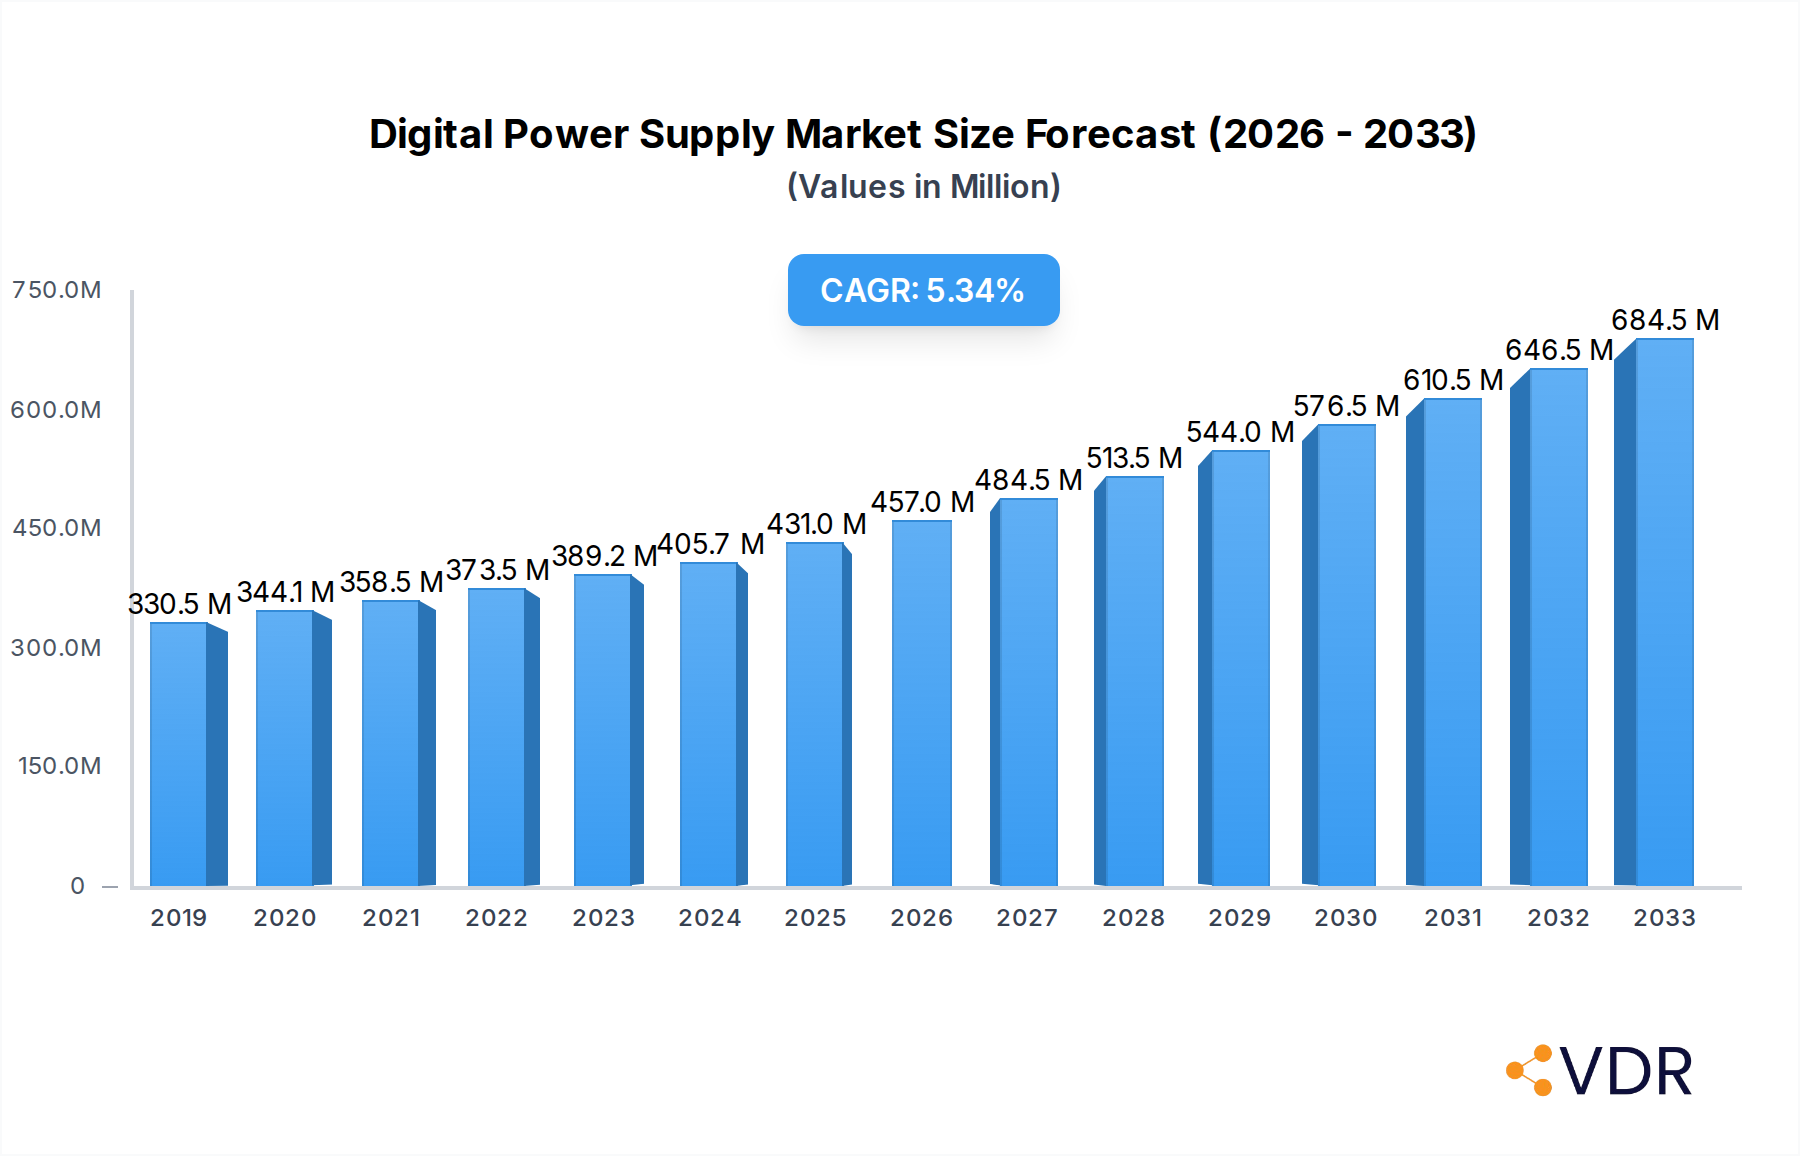
Digital Power Supply Market Size (In Million)
The market's growth is further bolstered by technological advancements, including the development of more compact, intelligent, and feature-rich digital power supply units. Key trends such as the integration of AI and machine learning for predictive maintenance and optimized power delivery are gaining traction, offering enhanced performance and reliability. While the market exhibits strong growth potential, certain factors could influence its pace. High initial investment costs for advanced digital power supply technologies and the availability of cost-effective analog alternatives in specific low-end applications may pose some restraints. However, the long-term benefits of improved efficiency, reduced energy consumption, and enhanced system performance offered by digital solutions are expected to outweigh these concerns. The competitive landscape features prominent players like TDK, Keysight Technologies, and Ametek, who are actively engaged in research and development to introduce innovative products and expand their market reach across diverse geographical regions.

Digital Power Supply Company Market Share
Digital Power Supply Market Report: Comprehensive Analysis and Future Outlook (2019-2033)
This in-depth report provides a comprehensive analysis of the global Digital Power Supply market, covering market dynamics, growth trends, regional dominance, product landscape, key drivers, challenges, emerging opportunities, and a detailed outlook for the forecast period of 2025-2033. With a focus on high-traffic keywords and detailed quantitative and qualitative insights, this report is an essential resource for industry professionals, investors, and decision-makers. The study encompasses the historical period from 2019-2024, with the base year and estimated year set for 2025. We analyze parent and child market segments, providing a holistic view of the industry's evolution and future trajectory.
Digital Power Supply Market Dynamics & Structure
The digital power supply market is characterized by a moderately concentrated structure, with key players like TDK, Keysight Technologies, and Ametek holding significant market share. Technological innovation remains a primary driver, fueled by the increasing demand for higher efficiency, miniaturization, and intelligent control in power management systems. Regulatory frameworks, particularly those focusing on energy efficiency standards and safety certifications, significantly influence product development and market entry. Competitive product substitutes, such as advanced analog power supplies, are present but are increasingly being outpaced by the superior performance and flexibility of digital solutions. End-user demographics are shifting towards sophisticated applications in computing, communications, and medical devices, demanding more specialized and reliable power solutions. Mergers and acquisitions (M&A) trends, while not pervasive, indicate strategic consolidation to acquire specific technologies or expand market reach. For instance, recent M&A activity has seen integration of advanced control software with hardware components, aiming to create more comprehensive intelligent power solutions.
- Market Concentration: Moderately concentrated with top 5 players holding approximately 55% of the global market share in 2025.
- Technological Innovation: Driven by AI-powered diagnostics, adaptive voltage scaling, and advanced thermal management.
- Regulatory Frameworks: Increased stringency in energy efficiency standards (e.g., Energy Star 3.0) impacting product design and adoption.
- Competitive Substitutes: Advanced analog power supplies are facing pressure from digital counterparts in high-performance applications.
- End-User Demographics: Growing demand from data centers, 5G infrastructure, and sophisticated medical equipment.
- M&A Trends: Focus on acquiring companies with expertise in embedded software and IoT integration for smart power management.
Digital Power Supply Growth Trends & Insights
The global digital power supply market is poised for robust growth, driven by the escalating demand for energy-efficient and intelligent power solutions across diverse industries. Market size evolution is projected to witness a significant upswing, with an estimated market size of $8,500 million units in 2025, expanding at a Compound Annual Growth Rate (CAGR) of approximately 7.8% from 2025 to 2033. Adoption rates for digital power supplies are accelerating, particularly in sectors where precise power control, real-time monitoring, and remote management are critical. Technological disruptions, such as the integration of artificial intelligence (AI) and machine learning (ML) for predictive maintenance and optimization of power delivery, are further enhancing the value proposition of digital power supplies. Consumer behavior shifts are also playing a crucial role, with a growing preference for smart, connected, and sustainable electronic devices that rely on advanced power management. The increasing prevalence of IoT devices, the expansion of cloud computing infrastructure, and the growing need for reliable power in critical medical applications are major contributors to this upward trend. Furthermore, the continuous evolution of semiconductor technology enables the development of more compact, efficient, and cost-effective digital power supply units, making them accessible for a wider range of applications. The push towards Industry 4.0 and smart manufacturing also necessitates advanced control systems, where digital power supplies are instrumental in ensuring operational stability and efficiency. The transition from traditional power supplies to digitally controlled ones offers benefits such as improved power factor, reduced electromagnetic interference (EMI), and enhanced system reliability. This shift is further propelled by government initiatives and global efforts aimed at reducing energy consumption and carbon footprints, making energy-efficient power solutions a top priority for manufacturers and consumers alike.
Dominant Regions, Countries, or Segments in Digital Power Supply
The Application: Computer Equipment segment is identified as the dominant force driving market growth in the digital power supply industry. This dominance stems from the insatiable demand for higher performance, energy efficiency, and miniaturization in computing devices, ranging from high-performance servers and data centers to portable laptops and mobile devices. The proliferation of cloud computing, artificial intelligence (AI) workloads, and big data analytics necessitates robust and intelligent power solutions capable of delivering stable and efficient power under varying loads. Consequently, manufacturers are investing heavily in developing advanced digital power supplies that can meet these stringent requirements. The Types: Single-Phase digital power supplies are particularly prevalent within this segment due to their widespread use in personal computers, laptops, and various consumer electronics.
Key drivers contributing to the dominance of computer equipment include:
- Exponential Growth in Data Centers: The ever-increasing demand for data storage, processing, and cloud services fuels the expansion of hyperscale data centers, requiring a massive number of reliable and efficient single-phase digital power supplies.
- Advancements in Processors and GPUs: The continuous innovation in CPUs and GPUs for faster computing and AI processing demands sophisticated power delivery systems to maintain optimal performance and prevent thermal throttling.
- Miniaturization and Portability Trends: The ongoing trend towards thinner, lighter, and more powerful laptops and mobile devices necessitates compact and highly efficient single-phase digital power supplies.
- Energy Efficiency Mandates: Stringent energy efficiency regulations for IT equipment, driven by environmental concerns and operational cost reduction, push the adoption of advanced digital power solutions.
- Adoption of AI and Machine Learning: The computational intensity of AI and ML applications requires highly efficient and dynamically adjustable power supplies, a hallmark of digital power technology.
The Asia-Pacific region, with its significant manufacturing base for electronics and a rapidly growing IT infrastructure, plays a pivotal role in the demand for digital power supplies within the computer equipment segment. Countries like China, South Korea, and Taiwan are at the forefront of both manufacturing and consumption, further solidifying this segment's dominance. The market share for computer equipment applications is estimated to be around 35% in 2025, with a projected CAGR of 8.2% during the forecast period.
Digital Power Supply Product Landscape
The digital power supply product landscape is characterized by rapid innovation, focusing on enhanced efficiency, intelligent control, and compact form factors. Key product developments include GaN (Gallium Nitride) and SiC (Silicon Carbide) based power supplies, offering higher switching frequencies, reduced energy loss, and improved thermal performance compared to traditional silicon-based solutions. Applications are expanding beyond traditional computing and communication equipment to encompass advanced medical devices, renewable energy systems, and electric vehicle charging infrastructure. Performance metrics such as power density, efficiency at various load conditions, and dynamic response time are continuously being improved. Unique selling propositions often revolve around integrated digital control ICs that enable sophisticated features like remote monitoring, diagnostics, and adaptive power management, setting them apart from their analog counterparts.
Key Drivers, Barriers & Challenges in Digital Power Supply
Key Drivers:
- Increasing Demand for Energy Efficiency: Global initiatives and regulations are pushing for reduced energy consumption, making digital power supplies with their superior efficiency a preferred choice.
- Advancements in Digital Control Technologies: Innovations in microcontrollers, digital signal processors (DSPs), and embedded software are enabling more sophisticated power management features.
- Growth of High-Performance Computing & Data Centers: The exponential rise in data generation and processing necessitates highly reliable and efficient power solutions.
- Miniaturization and Power Density Requirements: The trend towards smaller and more powerful electronic devices drives the need for compact digital power supplies.
Barriers & Challenges:
- Higher Initial Cost: Digital power supplies can sometimes have a higher upfront cost compared to their analog counterparts, posing a barrier for cost-sensitive applications.
- Complexity of Design and Implementation: The sophisticated control algorithms and software integration can increase the design complexity for some manufacturers.
- Supply Chain Disruptions: Global semiconductor shortages and logistical challenges can impact the availability and cost of critical components, affecting production timelines and pricing.
- Technological Obsolescence: The rapid pace of technological advancement requires continuous investment in R&D to stay competitive, risking rapid product obsolescence.
- Interoperability and Standardization: Ensuring seamless integration with existing systems and adherence to evolving industry standards can be a challenge.
Emerging Opportunities in Digital Power Supply
Emerging opportunities in the digital power supply market lie in the rapidly growing sectors of renewable energy integration, smart grid technologies, and advanced electric vehicle (EV) charging solutions. The increasing adoption of solar and wind power necessitates advanced inverters and power management systems that can efficiently convert and distribute energy, where digital control offers significant advantages. Smart grids, with their emphasis on real-time monitoring and control of electricity distribution, present a substantial opportunity for intelligent digital power supplies that can facilitate grid stability and optimize energy flow. Furthermore, the exponential growth in the EV market is creating a massive demand for efficient and fast charging solutions, driving innovation in high-power digital power supplies for charging stations and onboard chargers. The development of wireless power transfer technology also presents a niche but growing opportunity for specialized digital power solutions.
Growth Accelerators in the Digital Power Supply Industry
Long-term growth in the digital power supply industry will be significantly accelerated by technological breakthroughs in wide-bandgap semiconductors like Gallium Nitride (GaN) and Silicon Carbide (SiC), which enable higher power densities, improved efficiency, and reduced form factors. Strategic partnerships between power supply manufacturers and semiconductor developers will foster co-innovation and accelerate the adoption of next-generation technologies. Market expansion into emerging economies, driven by increasing industrialization and adoption of advanced electronics, will also be a key growth catalyst. Furthermore, the ongoing trend towards digitalization across all industries, including manufacturing, healthcare, and transportation, will continue to create sustained demand for intelligent and efficient power management solutions.
Key Players Shaping the Digital Power Supply Market
- TDK
- Kikusui
- Renesas
- ACT
- PeakTech
- Korad
- Yi Hua
- Ametek
- Keysight Technologies
- B&K Precision
- GW Instek
- Kepco Inc
Notable Milestones in Digital Power Supply Sector
- 2021: Introduction of advanced GaN-based digital power supplies offering significantly higher power density and efficiency.
- 2022: Key players invest heavily in AI-driven predictive maintenance for power supplies in industrial automation.
- 2023: Significant product launches focusing on ultra-low standby power consumption to meet stricter energy regulations.
- 2023: Increased M&A activity targeting companies with expertise in software-defined power management.
- 2024: Launch of highly integrated digital power solutions for 5G base stations, enabling enhanced performance and reliability.
In-Depth Digital Power Supply Market Outlook
The future market outlook for digital power supplies remains exceptionally strong, driven by an unyielding demand for energy efficiency, intelligent control, and miniaturization across a broad spectrum of industries. The continued advancements in semiconductor technology, particularly wide-bandgap materials, will unlock new levels of performance and cost-effectiveness. Strategic collaborations and aggressive R&D investments by key players will further propel innovation. Emerging applications in the IoT, electric mobility, and advanced medical devices will create significant growth opportunities. As governments worldwide continue to prioritize sustainability and energy conservation, the adoption of digital power supplies is set to accelerate, solidifying their position as an indispensable component of modern electronic systems. The market is expected to witness sustained growth, with opportunities arising from both established and nascent technological frontiers.
Digital Power Supply Segmentation
-
1. Application
- 1.1. Computer Equipment
- 1.2. Communication Equipment
- 1.3. Medical Equipment
- 1.4. Control and Measurement Equipment
- 1.5. Others
-
2. Types
- 2.1. 3-Phase
- 2.2. Single-Phase
Digital Power Supply Segmentation By Geography
-
1. North America
- 1.1. United States
- 1.2. Canada
- 1.3. Mexico
-
2. South America
- 2.1. Brazil
- 2.2. Argentina
- 2.3. Rest of South America
-
3. Europe
- 3.1. United Kingdom
- 3.2. Germany
- 3.3. France
- 3.4. Italy
- 3.5. Spain
- 3.6. Russia
- 3.7. Benelux
- 3.8. Nordics
- 3.9. Rest of Europe
-
4. Middle East & Africa
- 4.1. Turkey
- 4.2. Israel
- 4.3. GCC
- 4.4. North Africa
- 4.5. South Africa
- 4.6. Rest of Middle East & Africa
-
5. Asia Pacific
- 5.1. China
- 5.2. India
- 5.3. Japan
- 5.4. South Korea
- 5.5. ASEAN
- 5.6. Oceania
- 5.7. Rest of Asia Pacific
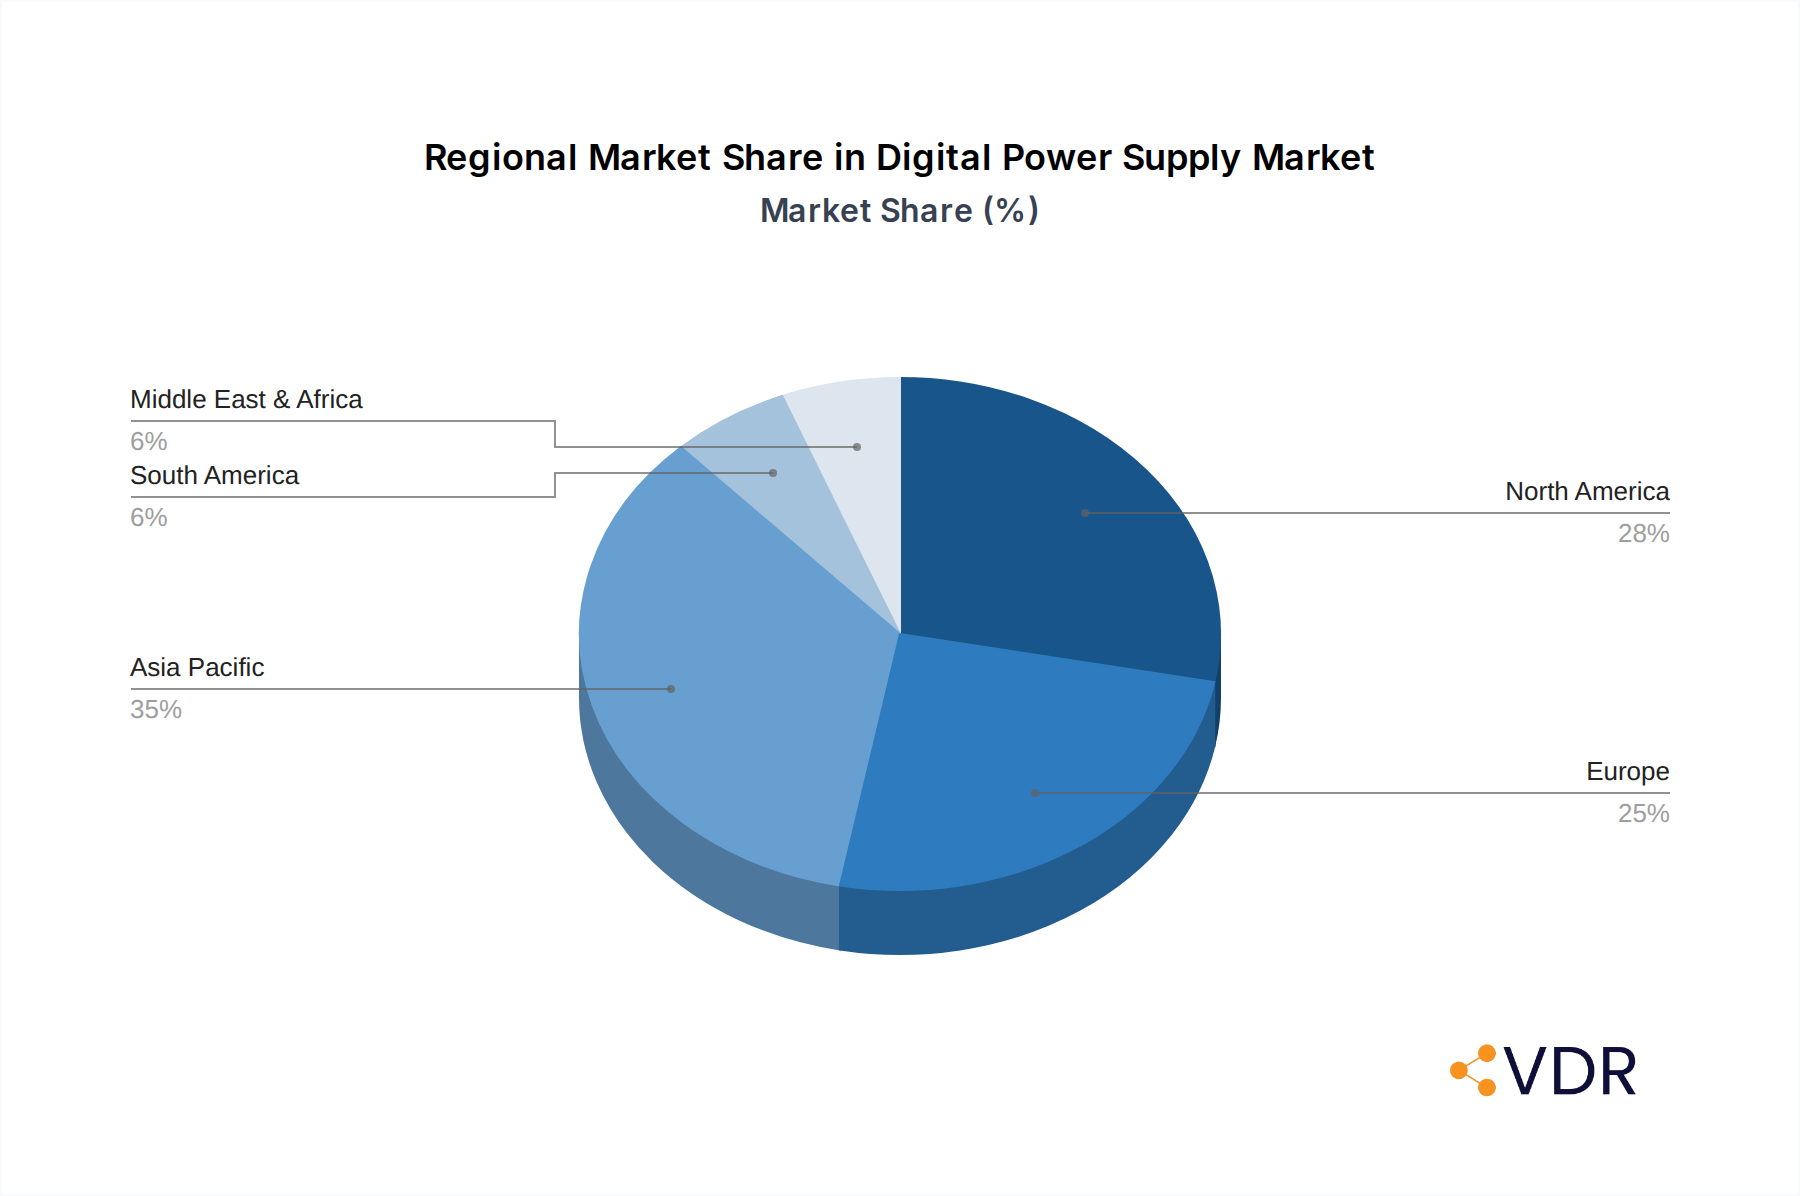
Digital Power Supply Regional Market Share
Geographic Coverage of Digital Power Supply
Digital Power Supply REPORT HIGHLIGHTS
| Aspects | Details |
|---|---|
| Study Period | 2020-2034 |
| Base Year | 2025 |
| Estimated Year | 2026 |
| Forecast Period | 2026-2034 |
| Historical Period | 2020-2025 |
| Growth Rate | CAGR of 5.2% from 2020-2034 |
| Segmentation |
|
Table of Contents
- 1. Introduction
- 1.1. Research Scope
- 1.2. Market Segmentation
- 1.3. Research Objective
- 1.4. Definitions and Assumptions
- 2. Executive Summary
- 2.1. Market Snapshot
- 3. Market Dynamics
- 3.1. Market Drivers
- 3.2. Market Restrains
- 3.3. Market Trends
- 3.4. Market Opportunities
- 4. Market Factor Analysis
- 4.1. Porters Five Forces
- 4.1.1. Bargaining Power of Suppliers
- 4.1.2. Bargaining Power of Buyers
- 4.1.3. Threat of New Entrants
- 4.1.4. Threat of Substitutes
- 4.1.5. Competitive Rivalry
- 4.2. PESTEL analysis
- 4.3. BCG Analysis
- 4.3.1. Stars (High Growth, High Market Share)
- 4.3.2. Cash Cows (Low Growth, High Market Share)
- 4.3.3. Question Mark (High Growth, Low Market Share)
- 4.3.4. Dogs (Low Growth, Low Market Share)
- 4.4. Ansoff Matrix Analysis
- 4.5. Supply Chain Analysis
- 4.6. Regulatory Landscape
- 4.7. Current Market Potential and Opportunity Assessment (TAM–SAM–SOM Framework)
- 4.8. VDR Analyst Note
- 4.1. Porters Five Forces
- 5. Market Analysis, Insights and Forecast 2021-2033
- 5.1. Market Analysis, Insights and Forecast - by Application
- 5.1.1. Computer Equipment
- 5.1.2. Communication Equipment
- 5.1.3. Medical Equipment
- 5.1.4. Control and Measurement Equipment
- 5.1.5. Others
- 5.2. Market Analysis, Insights and Forecast - by Types
- 5.2.1. 3-Phase
- 5.2.2. Single-Phase
- 5.3. Market Analysis, Insights and Forecast - by Region
- 5.3.1. North America
- 5.3.2. South America
- 5.3.3. Europe
- 5.3.4. Middle East & Africa
- 5.3.5. Asia Pacific
- 5.1. Market Analysis, Insights and Forecast - by Application
- 6. Global Digital Power Supply Analysis, Insights and Forecast, 2021-2033
- 6.1. Market Analysis, Insights and Forecast - by Application
- 6.1.1. Computer Equipment
- 6.1.2. Communication Equipment
- 6.1.3. Medical Equipment
- 6.1.4. Control and Measurement Equipment
- 6.1.5. Others
- 6.2. Market Analysis, Insights and Forecast - by Types
- 6.2.1. 3-Phase
- 6.2.2. Single-Phase
- 6.1. Market Analysis, Insights and Forecast - by Application
- 7. North America Digital Power Supply Analysis, Insights and Forecast, 2021-2033
- 7.1. Market Analysis, Insights and Forecast - by Application
- 7.1.1. Computer Equipment
- 7.1.2. Communication Equipment
- 7.1.3. Medical Equipment
- 7.1.4. Control and Measurement Equipment
- 7.1.5. Others
- 7.2. Market Analysis, Insights and Forecast - by Types
- 7.2.1. 3-Phase
- 7.2.2. Single-Phase
- 7.1. Market Analysis, Insights and Forecast - by Application
- 8. South America Digital Power Supply Analysis, Insights and Forecast, 2021-2033
- 8.1. Market Analysis, Insights and Forecast - by Application
- 8.1.1. Computer Equipment
- 8.1.2. Communication Equipment
- 8.1.3. Medical Equipment
- 8.1.4. Control and Measurement Equipment
- 8.1.5. Others
- 8.2. Market Analysis, Insights and Forecast - by Types
- 8.2.1. 3-Phase
- 8.2.2. Single-Phase
- 8.1. Market Analysis, Insights and Forecast - by Application
- 9. Europe Digital Power Supply Analysis, Insights and Forecast, 2021-2033
- 9.1. Market Analysis, Insights and Forecast - by Application
- 9.1.1. Computer Equipment
- 9.1.2. Communication Equipment
- 9.1.3. Medical Equipment
- 9.1.4. Control and Measurement Equipment
- 9.1.5. Others
- 9.2. Market Analysis, Insights and Forecast - by Types
- 9.2.1. 3-Phase
- 9.2.2. Single-Phase
- 9.1. Market Analysis, Insights and Forecast - by Application
- 10. Middle East & Africa Digital Power Supply Analysis, Insights and Forecast, 2021-2033
- 10.1. Market Analysis, Insights and Forecast - by Application
- 10.1.1. Computer Equipment
- 10.1.2. Communication Equipment
- 10.1.3. Medical Equipment
- 10.1.4. Control and Measurement Equipment
- 10.1.5. Others
- 10.2. Market Analysis, Insights and Forecast - by Types
- 10.2.1. 3-Phase
- 10.2.2. Single-Phase
- 10.1. Market Analysis, Insights and Forecast - by Application
- 11. Asia Pacific Digital Power Supply Analysis, Insights and Forecast, 2021-2033
- 11.1. Market Analysis, Insights and Forecast - by Application
- 11.1.1. Computer Equipment
- 11.1.2. Communication Equipment
- 11.1.3. Medical Equipment
- 11.1.4. Control and Measurement Equipment
- 11.1.5. Others
- 11.2. Market Analysis, Insights and Forecast - by Types
- 11.2.1. 3-Phase
- 11.2.2. Single-Phase
- 11.1. Market Analysis, Insights and Forecast - by Application
- 12. Competitive Analysis
- 12.1. Company Profiles
- 12.1.1 TDK
- 12.1.1.1. Company Overview
- 12.1.1.2. Products
- 12.1.1.3. Company Financials
- 12.1.1.4. SWOT Analysis
- 12.1.2 Kikusui
- 12.1.2.1. Company Overview
- 12.1.2.2. Products
- 12.1.2.3. Company Financials
- 12.1.2.4. SWOT Analysis
- 12.1.3 Renesas
- 12.1.3.1. Company Overview
- 12.1.3.2. Products
- 12.1.3.3. Company Financials
- 12.1.3.4. SWOT Analysis
- 12.1.4 ACT
- 12.1.4.1. Company Overview
- 12.1.4.2. Products
- 12.1.4.3. Company Financials
- 12.1.4.4. SWOT Analysis
- 12.1.5 PeakTech
- 12.1.5.1. Company Overview
- 12.1.5.2. Products
- 12.1.5.3. Company Financials
- 12.1.5.4. SWOT Analysis
- 12.1.6 Korad
- 12.1.6.1. Company Overview
- 12.1.6.2. Products
- 12.1.6.3. Company Financials
- 12.1.6.4. SWOT Analysis
- 12.1.7 Yi Hua
- 12.1.7.1. Company Overview
- 12.1.7.2. Products
- 12.1.7.3. Company Financials
- 12.1.7.4. SWOT Analysis
- 12.1.8 Ametek
- 12.1.8.1. Company Overview
- 12.1.8.2. Products
- 12.1.8.3. Company Financials
- 12.1.8.4. SWOT Analysis
- 12.1.9 Keysight Technologies
- 12.1.9.1. Company Overview
- 12.1.9.2. Products
- 12.1.9.3. Company Financials
- 12.1.9.4. SWOT Analysis
- 12.1.10 B&K Precision
- 12.1.10.1. Company Overview
- 12.1.10.2. Products
- 12.1.10.3. Company Financials
- 12.1.10.4. SWOT Analysis
- 12.1.11 GW Instek
- 12.1.11.1. Company Overview
- 12.1.11.2. Products
- 12.1.11.3. Company Financials
- 12.1.11.4. SWOT Analysis
- 12.1.12 Kepco Inc
- 12.1.12.1. Company Overview
- 12.1.12.2. Products
- 12.1.12.3. Company Financials
- 12.1.12.4. SWOT Analysis
- 12.1.1 TDK
- 12.2. Market Entropy
- 12.2.1 Company's Key Areas Served
- 12.2.2 Recent Developments
- 12.3. Company Market Share Analysis 2025
- 12.3.1 Top 5 Companies Market Share Analysis
- 12.3.2 Top 3 Companies Market Share Analysis
- 12.4. List of Potential Customers
- 13. Research Methodology
List of Figures
- Figure 1: Global Digital Power Supply Revenue Breakdown (million, %) by Region 2025 & 2033
- Figure 2: North America Digital Power Supply Revenue (million), by Application 2025 & 2033
- Figure 3: North America Digital Power Supply Revenue Share (%), by Application 2025 & 2033
- Figure 4: North America Digital Power Supply Revenue (million), by Types 2025 & 2033
- Figure 5: North America Digital Power Supply Revenue Share (%), by Types 2025 & 2033
- Figure 6: North America Digital Power Supply Revenue (million), by Country 2025 & 2033
- Figure 7: North America Digital Power Supply Revenue Share (%), by Country 2025 & 2033
- Figure 8: South America Digital Power Supply Revenue (million), by Application 2025 & 2033
- Figure 9: South America Digital Power Supply Revenue Share (%), by Application 2025 & 2033
- Figure 10: South America Digital Power Supply Revenue (million), by Types 2025 & 2033
- Figure 11: South America Digital Power Supply Revenue Share (%), by Types 2025 & 2033
- Figure 12: South America Digital Power Supply Revenue (million), by Country 2025 & 2033
- Figure 13: South America Digital Power Supply Revenue Share (%), by Country 2025 & 2033
- Figure 14: Europe Digital Power Supply Revenue (million), by Application 2025 & 2033
- Figure 15: Europe Digital Power Supply Revenue Share (%), by Application 2025 & 2033
- Figure 16: Europe Digital Power Supply Revenue (million), by Types 2025 & 2033
- Figure 17: Europe Digital Power Supply Revenue Share (%), by Types 2025 & 2033
- Figure 18: Europe Digital Power Supply Revenue (million), by Country 2025 & 2033
- Figure 19: Europe Digital Power Supply Revenue Share (%), by Country 2025 & 2033
- Figure 20: Middle East & Africa Digital Power Supply Revenue (million), by Application 2025 & 2033
- Figure 21: Middle East & Africa Digital Power Supply Revenue Share (%), by Application 2025 & 2033
- Figure 22: Middle East & Africa Digital Power Supply Revenue (million), by Types 2025 & 2033
- Figure 23: Middle East & Africa Digital Power Supply Revenue Share (%), by Types 2025 & 2033
- Figure 24: Middle East & Africa Digital Power Supply Revenue (million), by Country 2025 & 2033
- Figure 25: Middle East & Africa Digital Power Supply Revenue Share (%), by Country 2025 & 2033
- Figure 26: Asia Pacific Digital Power Supply Revenue (million), by Application 2025 & 2033
- Figure 27: Asia Pacific Digital Power Supply Revenue Share (%), by Application 2025 & 2033
- Figure 28: Asia Pacific Digital Power Supply Revenue (million), by Types 2025 & 2033
- Figure 29: Asia Pacific Digital Power Supply Revenue Share (%), by Types 2025 & 2033
- Figure 30: Asia Pacific Digital Power Supply Revenue (million), by Country 2025 & 2033
- Figure 31: Asia Pacific Digital Power Supply Revenue Share (%), by Country 2025 & 2033
List of Tables
- Table 1: Global Digital Power Supply Revenue million Forecast, by Application 2020 & 2033
- Table 2: Global Digital Power Supply Revenue million Forecast, by Types 2020 & 2033
- Table 3: Global Digital Power Supply Revenue million Forecast, by Region 2020 & 2033
- Table 4: Global Digital Power Supply Revenue million Forecast, by Application 2020 & 2033
- Table 5: Global Digital Power Supply Revenue million Forecast, by Types 2020 & 2033
- Table 6: Global Digital Power Supply Revenue million Forecast, by Country 2020 & 2033
- Table 7: United States Digital Power Supply Revenue (million) Forecast, by Application 2020 & 2033
- Table 8: Canada Digital Power Supply Revenue (million) Forecast, by Application 2020 & 2033
- Table 9: Mexico Digital Power Supply Revenue (million) Forecast, by Application 2020 & 2033
- Table 10: Global Digital Power Supply Revenue million Forecast, by Application 2020 & 2033
- Table 11: Global Digital Power Supply Revenue million Forecast, by Types 2020 & 2033
- Table 12: Global Digital Power Supply Revenue million Forecast, by Country 2020 & 2033
- Table 13: Brazil Digital Power Supply Revenue (million) Forecast, by Application 2020 & 2033
- Table 14: Argentina Digital Power Supply Revenue (million) Forecast, by Application 2020 & 2033
- Table 15: Rest of South America Digital Power Supply Revenue (million) Forecast, by Application 2020 & 2033
- Table 16: Global Digital Power Supply Revenue million Forecast, by Application 2020 & 2033
- Table 17: Global Digital Power Supply Revenue million Forecast, by Types 2020 & 2033
- Table 18: Global Digital Power Supply Revenue million Forecast, by Country 2020 & 2033
- Table 19: United Kingdom Digital Power Supply Revenue (million) Forecast, by Application 2020 & 2033
- Table 20: Germany Digital Power Supply Revenue (million) Forecast, by Application 2020 & 2033
- Table 21: France Digital Power Supply Revenue (million) Forecast, by Application 2020 & 2033
- Table 22: Italy Digital Power Supply Revenue (million) Forecast, by Application 2020 & 2033
- Table 23: Spain Digital Power Supply Revenue (million) Forecast, by Application 2020 & 2033
- Table 24: Russia Digital Power Supply Revenue (million) Forecast, by Application 2020 & 2033
- Table 25: Benelux Digital Power Supply Revenue (million) Forecast, by Application 2020 & 2033
- Table 26: Nordics Digital Power Supply Revenue (million) Forecast, by Application 2020 & 2033
- Table 27: Rest of Europe Digital Power Supply Revenue (million) Forecast, by Application 2020 & 2033
- Table 28: Global Digital Power Supply Revenue million Forecast, by Application 2020 & 2033
- Table 29: Global Digital Power Supply Revenue million Forecast, by Types 2020 & 2033
- Table 30: Global Digital Power Supply Revenue million Forecast, by Country 2020 & 2033
- Table 31: Turkey Digital Power Supply Revenue (million) Forecast, by Application 2020 & 2033
- Table 32: Israel Digital Power Supply Revenue (million) Forecast, by Application 2020 & 2033
- Table 33: GCC Digital Power Supply Revenue (million) Forecast, by Application 2020 & 2033
- Table 34: North Africa Digital Power Supply Revenue (million) Forecast, by Application 2020 & 2033
- Table 35: South Africa Digital Power Supply Revenue (million) Forecast, by Application 2020 & 2033
- Table 36: Rest of Middle East & Africa Digital Power Supply Revenue (million) Forecast, by Application 2020 & 2033
- Table 37: Global Digital Power Supply Revenue million Forecast, by Application 2020 & 2033
- Table 38: Global Digital Power Supply Revenue million Forecast, by Types 2020 & 2033
- Table 39: Global Digital Power Supply Revenue million Forecast, by Country 2020 & 2033
- Table 40: China Digital Power Supply Revenue (million) Forecast, by Application 2020 & 2033
- Table 41: India Digital Power Supply Revenue (million) Forecast, by Application 2020 & 2033
- Table 42: Japan Digital Power Supply Revenue (million) Forecast, by Application 2020 & 2033
- Table 43: South Korea Digital Power Supply Revenue (million) Forecast, by Application 2020 & 2033
- Table 44: ASEAN Digital Power Supply Revenue (million) Forecast, by Application 2020 & 2033
- Table 45: Oceania Digital Power Supply Revenue (million) Forecast, by Application 2020 & 2033
- Table 46: Rest of Asia Pacific Digital Power Supply Revenue (million) Forecast, by Application 2020 & 2033
Frequently Asked Questions
1. What is the projected Compound Annual Growth Rate (CAGR) of the Digital Power Supply?
The projected CAGR is approximately 5.2%.
2. Which companies are prominent players in the Digital Power Supply?
Key companies in the market include TDK, Kikusui, Renesas, ACT, PeakTech, Korad, Yi Hua, Ametek, Keysight Technologies, B&K Precision, GW Instek, Kepco Inc.
3. What are the main segments of the Digital Power Supply?
The market segments include Application, Types.
4. Can you provide details about the market size?
The market size is estimated to be USD 431 million as of 2022.
5. What are some drivers contributing to market growth?
N/A
6. What are the notable trends driving market growth?
N/A
7. Are there any restraints impacting market growth?
N/A
8. Can you provide examples of recent developments in the market?
N/A
9. What pricing options are available for accessing the report?
Pricing options include single-user, multi-user, and enterprise licenses priced at USD 2900.00, USD 4350.00, and USD 5800.00 respectively.
10. Is the market size provided in terms of value or volume?
The market size is provided in terms of value, measured in million.
11. Are there any specific market keywords associated with the report?
Yes, the market keyword associated with the report is "Digital Power Supply," which aids in identifying and referencing the specific market segment covered.
12. How do I determine which pricing option suits my needs best?
The pricing options vary based on user requirements and access needs. Individual users may opt for single-user licenses, while businesses requiring broader access may choose multi-user or enterprise licenses for cost-effective access to the report.
13. Are there any additional resources or data provided in the Digital Power Supply report?
While the report offers comprehensive insights, it's advisable to review the specific contents or supplementary materials provided to ascertain if additional resources or data are available.
14. How can I stay updated on further developments or reports in the Digital Power Supply?
To stay informed about further developments, trends, and reports in the Digital Power Supply, consider subscribing to industry newsletters, following relevant companies and organizations, or regularly checking reputable industry news sources and publications.
Methodology
Step 1 - Identification of Relevant Samples Size from Population Database


Step 2 - Approaches for Defining Global Market Size (Value, Volume* & Price*)

Note*: In applicable scenarios
Step 3 - Data Sources
Primary Research
- Web Analytics
- Survey Reports
- Research Institute
- Latest Research Reports
- Opinion Leaders
Secondary Research
- Annual Reports
- White Paper
- Latest Press Release
- Industry Association
- Paid Database
- Investor Presentations

Step 4 - Data Triangulation
Involves using different sources of information in order to increase the validity of a study
These sources are likely to be stakeholders in a program - participants, other researchers, program staff, other community members, and so on.
Then we put all data in single framework & apply various statistical tools to find out the dynamic on the market.
During the analysis stage, feedback from the stakeholder groups would be compared to determine areas of agreement as well as areas of divergence