
Key Insights
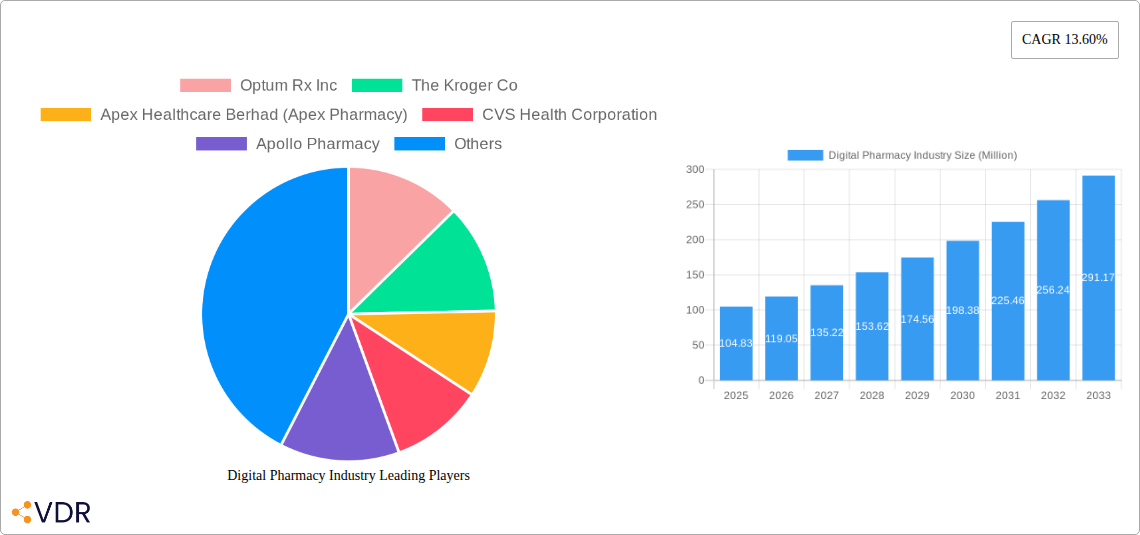
The digital pharmacy industry is experiencing robust growth, projected to reach a market size of $104.83 million in 2025 and exhibiting a Compound Annual Growth Rate (CAGR) of 13.60%. This expansion is fueled by several key factors. Increasing internet and smartphone penetration globally, coupled with rising consumer preference for convenient and contactless healthcare services, are driving significant adoption. Furthermore, the industry benefits from the integration of telemedicine, allowing for remote consultations and prescription fulfillment, enhancing accessibility particularly in underserved areas. The convenience offered by digital platforms, including online ordering, home delivery, and automated prescription refills, is a significant attractor for consumers. Competition is intense, with established players like CVS Health, Walgreens Boots Alliance, and OptumRx competing against emerging digital-first companies like Pharmeasy and Amazon. This competitive landscape encourages innovation and fosters a wider array of services, including personalized medication management tools and medication adherence programs. However, challenges remain, including concerns around data security and patient privacy, regulatory hurdles related to online prescription dispensing in various jurisdictions, and the need to overcome potential skepticism from consumers unfamiliar with online pharmacy services. The industry's segmentation reveals a diverse product portfolio, encompassing prescription drugs, over-the-counter medications, skincare, dental care products, cold and flu remedies, vitamins, weight-loss supplements, and other health-related items. This diversity indicates significant opportunities for future growth and specialization within the market.
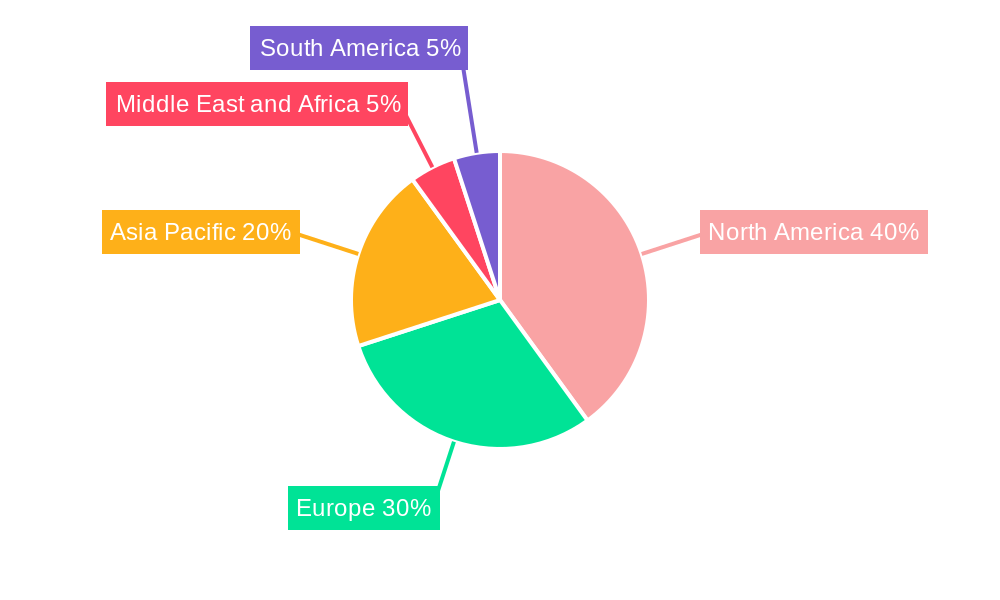
The geographical distribution of the market reveals significant regional variations. North America and Europe currently hold substantial market shares, driven by high technological adoption and established healthcare infrastructure. However, the Asia-Pacific region, particularly India and China, presents a substantial growth opportunity due to a rapidly expanding middle class and increased internet penetration. Future growth will be influenced by factors like government regulations concerning online pharmaceutical sales, technological advancements in areas such as AI-driven drug discovery and personalized medicine, and the continued evolution of telemedicine integration. Companies will need to focus on enhancing customer trust through robust security measures, user-friendly platforms, and proactive customer service to capitalize on this expansive market potential. Investment in advanced logistics and delivery networks will also be critical for ensuring timely and reliable service across geographical areas.
Digital Pharmacy Industry Market Report: 2019-2033
This comprehensive report provides a detailed analysis of the Digital Pharmacy Industry, encompassing market dynamics, growth trends, dominant segments, key players, and future outlook. The report covers the historical period (2019-2024), base year (2025), and forecasts until 2033, offering invaluable insights for industry professionals, investors, and strategic decision-makers. The study delves into both parent and child markets, providing a granular understanding of the digital transformation within the pharmacy sector. Expected market size is expressed in Million units.
Digital Pharmacy Industry Market Dynamics & Structure
The digital pharmacy market is experiencing rapid growth fueled by technological advancements, changing consumer preferences, and regulatory shifts. Market concentration is moderate, with several large players dominating, alongside numerous smaller, specialized players. Technological innovation, including telehealth integration, AI-driven drug discovery, and improved delivery logistics, are key drivers. However, regulatory hurdles regarding data privacy, prescription fulfillment, and cross-border sales pose significant challenges. The competitive landscape includes both pure-play digital pharmacies and traditional pharmacies expanding their online presence. Mergers and acquisitions (M&A) activity has been significant, with larger companies acquiring smaller players to expand their market share and product offerings.
- Market Concentration: Moderate, with a few dominant players and many smaller niche players.
- Technological Innovation: AI, telehealth integration, drone delivery, personalized medicine driving market growth.
- Regulatory Framework: Stringent regulations regarding data privacy, prescription fulfillment, and online sales are key considerations.
- Competitive Substitutes: Traditional brick-and-mortar pharmacies, mail-order pharmacies.
- End-User Demographics: Growing segment of tech-savvy consumers, increasing aging population driving demand.
- M&A Trends: Consolidation expected, with larger players acquiring smaller companies to expand reach and capabilities. Estimated M&A deal volume in 2024: xx Million units.
Digital Pharmacy Industry Growth Trends & Insights
The digital pharmacy market is experiencing robust growth, driven by increasing internet penetration, smartphone adoption, and changing consumer preferences for convenience and accessibility. The market size grew from xx Million units in 2019 to xx Million units in 2024, exhibiting a CAGR of xx%. Technological disruptions, including the rise of telehealth and mobile health applications, are significantly impacting adoption rates. Consumer behavior is shifting towards online platforms for prescription refills, OTC purchases, and medication management. This trend is expected to continue throughout the forecast period, leading to increased market penetration and further expansion of the digital pharmacy sector. Furthermore, the global pandemic accelerated the digital transformation in the healthcare industry.
Dominant Regions, Countries, or Segments in Digital Pharmacy Industry
North America (particularly the US) and Western Europe currently dominate the digital pharmacy market, driven by factors such as high internet and smartphone penetration, well-established healthcare infrastructure, and favorable regulatory environments. The Prescription Drugs segment accounts for the largest share, followed by Over-the-Counter (OTC) Drugs. Within product types, Skin Care, Vitamins, and Cold & Flu remedies demonstrate robust growth potential.
- Key Drivers: High internet penetration, favorable regulatory landscape, well-developed healthcare infrastructure, aging population.
- Dominant Regions: North America (US), Western Europe.
- Dominant Segments: Prescription Drugs, Over-the-Counter (OTC) Drugs; Skin Care, Vitamins, Cold & Flu (by product type).
- Growth Potential: Emerging markets in Asia and Latin America present significant untapped potential.
Digital Pharmacy Industry Product Landscape
The digital pharmacy landscape is characterized by innovative products and services, such as mobile apps for medication management, telehealth consultations, AI-powered virtual assistants, and automated prescription refills. These solutions offer enhanced convenience, personalized care, and improved patient adherence. Unique selling propositions include features like medication reminders, prescription tracking, and seamless integration with electronic health records (EHRs). Ongoing technological advancements focus on improving user experience, enhancing security, and expanding product offerings.
Key Drivers, Barriers & Challenges in Digital Pharmacy Industry
Key Drivers:
- Technological advancements: AI, telehealth, mobile apps enhance efficiency and convenience.
- Consumer demand: Increased preference for online services, convenience, and accessibility.
- Government initiatives: Incentivizing digital health solutions and telehealth adoption.
Key Challenges:
- Regulatory hurdles: Data privacy concerns, prescription fulfillment regulations, and cross-border sales restrictions.
- Supply chain complexities: Efficient and reliable delivery logistics are crucial.
- Cybersecurity risks: Protecting sensitive patient data from cyber threats.
- Competitive pressure: Intense competition among established players and new entrants. Estimated market share loss due to competition in 2024: xx Million units.
Emerging Opportunities in Digital Pharmacy Industry
- Expansion into underserved markets: Reaching rural areas and developing economies with limited access to healthcare.
- Personalized medicine: Tailoring treatments based on individual genetic profiles and health data.
- Integration with wearables and IoT devices: Monitoring patient health parameters remotely.
- Artificial intelligence for drug discovery: Accelerating the development of new medications.
Growth Accelerators in the Digital Pharmacy Industry
Technological innovation, strategic partnerships between digital pharmacies and healthcare providers, and expansion into new geographic markets are key growth accelerators. The integration of AI and machine learning will further enhance efficiency and personalization. Strategic acquisitions of smaller players will strengthen the market position of larger companies. Increased investment in research and development will lead to new product innovations and improved services.
Key Players Shaping the Digital Pharmacy Industry Market
- Optum Rx Inc
- The Kroger Co
- Apex Healthcare Berhad (Apex Pharmacy)
- CVS Health Corporation
- Apollo Pharmacy
- Axelia Solutions (Pharmeasy)
- DocMorris (Zur Rose Group AG)
- Walgreen Boots Alliance (Walgreen Co)
- Amazon com Inc
- Netmeds com
- Cigna Corporation (Express Scripts Holdings)
- Giant Eagle Inc
*List Not Exhaustive
Notable Milestones in Digital Pharmacy Industry Sector
- September 2022: Amazon announces plans to sell prescription medications online in Japan, partnering with small and medium-sized pharmacies.
- September 2022: Walmart Canada and Canada Health Infoway partner to expand electronic prescribing services in Walmart pharmacies across Canada.
In-Depth Digital Pharmacy Industry Market Outlook
The digital pharmacy market is poised for significant growth over the next decade. Technological advancements, coupled with increasing consumer adoption and favorable regulatory environments in key markets, will fuel market expansion. Strategic partnerships and M&A activities will further consolidate the market, leading to increased efficiency and improved services. Companies that successfully leverage AI, telehealth, and personalized medicine will be best positioned to capture market share and drive long-term growth. The market is expected to reach xx Million units by 2033, driven by factors outlined previously.
Digital Pharmacy Industry Segmentation
-
1. Drug Type
- 1.1. Prescription Drugs
- 1.2. Over-the-Counter (OTC) Drugs
-
2. Product Type
- 2.1. Skin Care
- 2.2. Dental
- 2.3. Cold and Flu
- 2.4. Vitamins
- 2.5. Weight Loss
- 2.6. Other Product Types
Digital Pharmacy Industry Segmentation By Geography
-
1. North America
- 1.1. United States
- 1.2. Canada
- 1.3. Mexico
-
2. Europe
- 2.1. Germany
- 2.2. United Kingdom
- 2.3. France
- 2.4. Italy
- 2.5. Spain
- 2.6. Rest of Europe
-
3. Asia Pacific
- 3.1. China
- 3.2. Japan
- 3.3. India
- 3.4. Australia
- 3.5. South Korea
- 3.6. Rest of Asia Pacific
-
4. Middle East and Africa
- 4.1. GCC
- 4.2. South Africa
- 4.3. Rest of Middle East and Africa
-
5. South America
- 5.1. Brazil
- 5.2. Argentina
- 5.3. Rest of South America
Digital Pharmacy Industry REPORT HIGHLIGHTS
| Aspects | Details |
|---|---|
| Study Period | 2019-2033 |
| Base Year | 2024 |
| Estimated Year | 2025 |
| Forecast Period | 2025-2033 |
| Historical Period | 2019-2024 |
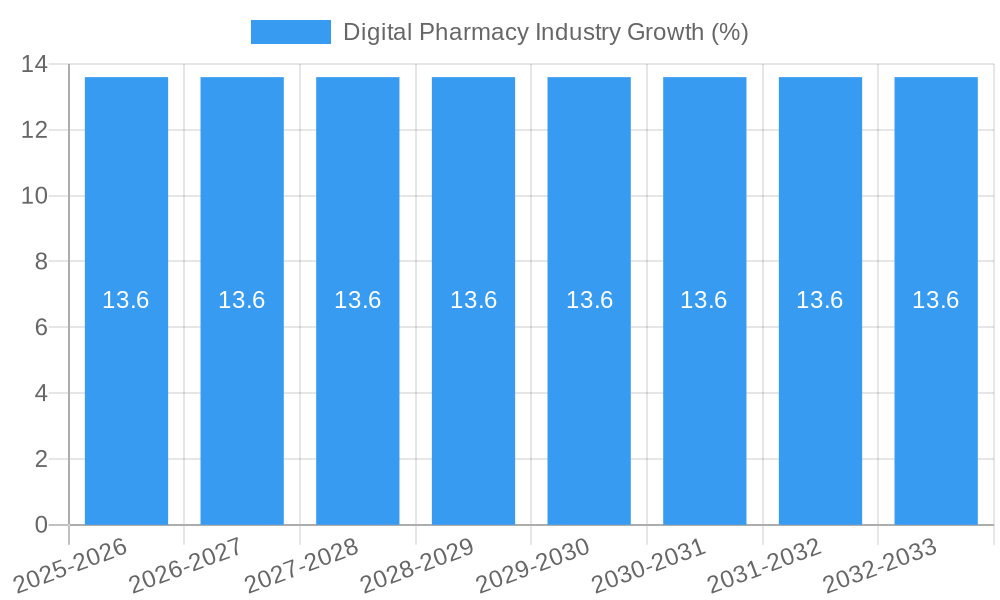
| Growth Rate | CAGR of 13.60% from 2019-2033 |
| Segmentation |
|
Table of Contents
- 1. Introduction
- 1.1. Research Scope
- 1.2. Market Segmentation
- 1.3. Research Methodology
- 1.4. Definitions and Assumptions
- 2. Executive Summary
- 2.1. Introduction
- 3. Market Dynamics
- 3.1. Introduction
- 3.2. Market Drivers
- 3.2.1. Increased Access to Web-based and Online Services; Rising Implementation of E-prescriptions in Hospitals and Other Healthcare Services
- 3.3. Market Restrains
- 3.3.1. Increasing Number of Illegal Online Pharmacies; Low Penetration in Rural Areas in Developing Countries
- 3.4. Market Trends
- 3.4.1 The Over-the-Counter Drugs Segment
- 3.4.2 under Drug Type
- 3.4.3 is Expected to Grow at the Fastest Rate during the Forecast Period
- 4. Market Factor Analysis
- 4.1. Porters Five Forces
- 4.2. Supply/Value Chain
- 4.3. PESTEL analysis
- 4.4. Market Entropy
- 4.5. Patent/Trademark Analysis
- 5. Global Digital Pharmacy Industry Analysis, Insights and Forecast, 2019-2031
- 5.1. Market Analysis, Insights and Forecast - by Drug Type
- 5.1.1. Prescription Drugs
- 5.1.2. Over-the-Counter (OTC) Drugs
- 5.2. Market Analysis, Insights and Forecast - by Product Type
- 5.2.1. Skin Care
- 5.2.2. Dental
- 5.2.3. Cold and Flu
- 5.2.4. Vitamins
- 5.2.5. Weight Loss
- 5.2.6. Other Product Types
- 5.3. Market Analysis, Insights and Forecast - by Region
- 5.3.1. North America
- 5.3.2. Europe
- 5.3.3. Asia Pacific
- 5.3.4. Middle East and Africa
- 5.3.5. South America
- 5.1. Market Analysis, Insights and Forecast - by Drug Type
- 6. North America Digital Pharmacy Industry Analysis, Insights and Forecast, 2019-2031
- 6.1. Market Analysis, Insights and Forecast - by Drug Type
- 6.1.1. Prescription Drugs
- 6.1.2. Over-the-Counter (OTC) Drugs
- 6.2. Market Analysis, Insights and Forecast - by Product Type
- 6.2.1. Skin Care
- 6.2.2. Dental
- 6.2.3. Cold and Flu
- 6.2.4. Vitamins
- 6.2.5. Weight Loss
- 6.2.6. Other Product Types
- 6.1. Market Analysis, Insights and Forecast - by Drug Type
- 7. Europe Digital Pharmacy Industry Analysis, Insights and Forecast, 2019-2031
- 7.1. Market Analysis, Insights and Forecast - by Drug Type
- 7.1.1. Prescription Drugs
- 7.1.2. Over-the-Counter (OTC) Drugs
- 7.2. Market Analysis, Insights and Forecast - by Product Type
- 7.2.1. Skin Care
- 7.2.2. Dental
- 7.2.3. Cold and Flu
- 7.2.4. Vitamins
- 7.2.5. Weight Loss
- 7.2.6. Other Product Types
- 7.1. Market Analysis, Insights and Forecast - by Drug Type
- 8. Asia Pacific Digital Pharmacy Industry Analysis, Insights and Forecast, 2019-2031
- 8.1. Market Analysis, Insights and Forecast - by Drug Type
- 8.1.1. Prescription Drugs
- 8.1.2. Over-the-Counter (OTC) Drugs
- 8.2. Market Analysis, Insights and Forecast - by Product Type
- 8.2.1. Skin Care
- 8.2.2. Dental
- 8.2.3. Cold and Flu
- 8.2.4. Vitamins
- 8.2.5. Weight Loss
- 8.2.6. Other Product Types
- 8.1. Market Analysis, Insights and Forecast - by Drug Type
- 9. Middle East and Africa Digital Pharmacy Industry Analysis, Insights and Forecast, 2019-2031
- 9.1. Market Analysis, Insights and Forecast - by Drug Type
- 9.1.1. Prescription Drugs
- 9.1.2. Over-the-Counter (OTC) Drugs
- 9.2. Market Analysis, Insights and Forecast - by Product Type
- 9.2.1. Skin Care
- 9.2.2. Dental
- 9.2.3. Cold and Flu
- 9.2.4. Vitamins
- 9.2.5. Weight Loss
- 9.2.6. Other Product Types
- 9.1. Market Analysis, Insights and Forecast - by Drug Type
- 10. South America Digital Pharmacy Industry Analysis, Insights and Forecast, 2019-2031
- 10.1. Market Analysis, Insights and Forecast - by Drug Type
- 10.1.1. Prescription Drugs
- 10.1.2. Over-the-Counter (OTC) Drugs
- 10.2. Market Analysis, Insights and Forecast - by Product Type
- 10.2.1. Skin Care
- 10.2.2. Dental
- 10.2.3. Cold and Flu
- 10.2.4. Vitamins
- 10.2.5. Weight Loss
- 10.2.6. Other Product Types
- 10.1. Market Analysis, Insights and Forecast - by Drug Type
- 11. North America Digital Pharmacy Industry Analysis, Insights and Forecast, 2019-2031
- 11.1. Market Analysis, Insights and Forecast - By Country/Sub-region
- 11.1.1 United States
- 11.1.2 Canada
- 11.1.3 Mexico
- 12. Europe Digital Pharmacy Industry Analysis, Insights and Forecast, 2019-2031
- 12.1. Market Analysis, Insights and Forecast - By Country/Sub-region
- 12.1.1 Germany
- 12.1.2 United Kingdom
- 12.1.3 France
- 12.1.4 Italy
- 12.1.5 Spain
- 12.1.6 Rest of Europe
- 13. Asia Pacific Digital Pharmacy Industry Analysis, Insights and Forecast, 2019-2031
- 13.1. Market Analysis, Insights and Forecast - By Country/Sub-region
- 13.1.1 China
- 13.1.2 Japan
- 13.1.3 India
- 13.1.4 Australia
- 13.1.5 South Korea
- 13.1.6 Rest of Asia Pacific
- 14. Middle East and Africa Digital Pharmacy Industry Analysis, Insights and Forecast, 2019-2031
- 14.1. Market Analysis, Insights and Forecast - By Country/Sub-region
- 14.1.1 GCC
- 14.1.2 South Africa
- 14.1.3 Rest of Middle East and Africa
- 15. South America Digital Pharmacy Industry Analysis, Insights and Forecast, 2019-2031
- 15.1. Market Analysis, Insights and Forecast - By Country/Sub-region
- 15.1.1 Brazil
- 15.1.2 Argentina
- 15.1.3 Rest of South America
- 16. Competitive Analysis
- 16.1. Global Market Share Analysis 2024
- 16.2. Company Profiles
- 16.2.1 Optum Rx Inc
- 16.2.1.1. Overview
- 16.2.1.2. Products
- 16.2.1.3. SWOT Analysis
- 16.2.1.4. Recent Developments
- 16.2.1.5. Financials (Based on Availability)
- 16.2.2 The Kroger Co
- 16.2.2.1. Overview
- 16.2.2.2. Products
- 16.2.2.3. SWOT Analysis
- 16.2.2.4. Recent Developments
- 16.2.2.5. Financials (Based on Availability)
- 16.2.3 Apex Healthcare Berhad (Apex Pharmacy)
- 16.2.3.1. Overview
- 16.2.3.2. Products
- 16.2.3.3. SWOT Analysis
- 16.2.3.4. Recent Developments
- 16.2.3.5. Financials (Based on Availability)
- 16.2.4 CVS Health Corporation
- 16.2.4.1. Overview
- 16.2.4.2. Products
- 16.2.4.3. SWOT Analysis
- 16.2.4.4. Recent Developments
- 16.2.4.5. Financials (Based on Availability)
- 16.2.5 Apollo Pharmacy
- 16.2.5.1. Overview
- 16.2.5.2. Products
- 16.2.5.3. SWOT Analysis
- 16.2.5.4. Recent Developments
- 16.2.5.5. Financials (Based on Availability)
- 16.2.6 Axelia Solutions (Pharmeasy)
- 16.2.6.1. Overview
- 16.2.6.2. Products
- 16.2.6.3. SWOT Analysis
- 16.2.6.4. Recent Developments
- 16.2.6.5. Financials (Based on Availability)
- 16.2.7 DocMorris (Zur Rose Group AG)
- 16.2.7.1. Overview
- 16.2.7.2. Products
- 16.2.7.3. SWOT Analysis
- 16.2.7.4. Recent Developments
- 16.2.7.5. Financials (Based on Availability)
- 16.2.8 Walgreen Boots Alliance (Walgreen Co )
- 16.2.8.1. Overview
- 16.2.8.2. Products
- 16.2.8.3. SWOT Analysis
- 16.2.8.4. Recent Developments
- 16.2.8.5. Financials (Based on Availability)
- 16.2.9 Amazon com Inc
- 16.2.9.1. Overview
- 16.2.9.2. Products
- 16.2.9.3. SWOT Analysis
- 16.2.9.4. Recent Developments
- 16.2.9.5. Financials (Based on Availability)
- 16.2.10 Netmeds com*List Not Exhaustive
- 16.2.10.1. Overview
- 16.2.10.2. Products
- 16.2.10.3. SWOT Analysis
- 16.2.10.4. Recent Developments
- 16.2.10.5. Financials (Based on Availability)
- 16.2.11 Cigna Corporation (Express Scripts Holdings)
- 16.2.11.1. Overview
- 16.2.11.2. Products
- 16.2.11.3. SWOT Analysis
- 16.2.11.4. Recent Developments
- 16.2.11.5. Financials (Based on Availability)
- 16.2.12 Giant Eagle Inc
- 16.2.12.1. Overview
- 16.2.12.2. Products
- 16.2.12.3. SWOT Analysis
- 16.2.12.4. Recent Developments
- 16.2.12.5. Financials (Based on Availability)
- 16.2.1 Optum Rx Inc
List of Figures
- Figure 1: Global Digital Pharmacy Industry Revenue Breakdown (Million, %) by Region 2024 & 2032
- Figure 2: North America Digital Pharmacy Industry Revenue (Million), by Country 2024 & 2032
- Figure 3: North America Digital Pharmacy Industry Revenue Share (%), by Country 2024 & 2032
- Figure 4: Europe Digital Pharmacy Industry Revenue (Million), by Country 2024 & 2032
- Figure 5: Europe Digital Pharmacy Industry Revenue Share (%), by Country 2024 & 2032
- Figure 6: Asia Pacific Digital Pharmacy Industry Revenue (Million), by Country 2024 & 2032
- Figure 7: Asia Pacific Digital Pharmacy Industry Revenue Share (%), by Country 2024 & 2032
- Figure 8: Middle East and Africa Digital Pharmacy Industry Revenue (Million), by Country 2024 & 2032
- Figure 9: Middle East and Africa Digital Pharmacy Industry Revenue Share (%), by Country 2024 & 2032
- Figure 10: South America Digital Pharmacy Industry Revenue (Million), by Country 2024 & 2032
- Figure 11: South America Digital Pharmacy Industry Revenue Share (%), by Country 2024 & 2032
- Figure 12: North America Digital Pharmacy Industry Revenue (Million), by Drug Type 2024 & 2032
- Figure 13: North America Digital Pharmacy Industry Revenue Share (%), by Drug Type 2024 & 2032
- Figure 14: North America Digital Pharmacy Industry Revenue (Million), by Product Type 2024 & 2032
- Figure 15: North America Digital Pharmacy Industry Revenue Share (%), by Product Type 2024 & 2032
- Figure 16: North America Digital Pharmacy Industry Revenue (Million), by Country 2024 & 2032
- Figure 17: North America Digital Pharmacy Industry Revenue Share (%), by Country 2024 & 2032
- Figure 18: Europe Digital Pharmacy Industry Revenue (Million), by Drug Type 2024 & 2032
- Figure 19: Europe Digital Pharmacy Industry Revenue Share (%), by Drug Type 2024 & 2032
- Figure 20: Europe Digital Pharmacy Industry Revenue (Million), by Product Type 2024 & 2032
- Figure 21: Europe Digital Pharmacy Industry Revenue Share (%), by Product Type 2024 & 2032
- Figure 22: Europe Digital Pharmacy Industry Revenue (Million), by Country 2024 & 2032
- Figure 23: Europe Digital Pharmacy Industry Revenue Share (%), by Country 2024 & 2032
- Figure 24: Asia Pacific Digital Pharmacy Industry Revenue (Million), by Drug Type 2024 & 2032
- Figure 25: Asia Pacific Digital Pharmacy Industry Revenue Share (%), by Drug Type 2024 & 2032
- Figure 26: Asia Pacific Digital Pharmacy Industry Revenue (Million), by Product Type 2024 & 2032
- Figure 27: Asia Pacific Digital Pharmacy Industry Revenue Share (%), by Product Type 2024 & 2032
- Figure 28: Asia Pacific Digital Pharmacy Industry Revenue (Million), by Country 2024 & 2032
- Figure 29: Asia Pacific Digital Pharmacy Industry Revenue Share (%), by Country 2024 & 2032
- Figure 30: Middle East and Africa Digital Pharmacy Industry Revenue (Million), by Drug Type 2024 & 2032
- Figure 31: Middle East and Africa Digital Pharmacy Industry Revenue Share (%), by Drug Type 2024 & 2032
- Figure 32: Middle East and Africa Digital Pharmacy Industry Revenue (Million), by Product Type 2024 & 2032
- Figure 33: Middle East and Africa Digital Pharmacy Industry Revenue Share (%), by Product Type 2024 & 2032
- Figure 34: Middle East and Africa Digital Pharmacy Industry Revenue (Million), by Country 2024 & 2032
- Figure 35: Middle East and Africa Digital Pharmacy Industry Revenue Share (%), by Country 2024 & 2032
- Figure 36: South America Digital Pharmacy Industry Revenue (Million), by Drug Type 2024 & 2032
- Figure 37: South America Digital Pharmacy Industry Revenue Share (%), by Drug Type 2024 & 2032
- Figure 38: South America Digital Pharmacy Industry Revenue (Million), by Product Type 2024 & 2032
- Figure 39: South America Digital Pharmacy Industry Revenue Share (%), by Product Type 2024 & 2032
- Figure 40: South America Digital Pharmacy Industry Revenue (Million), by Country 2024 & 2032
- Figure 41: South America Digital Pharmacy Industry Revenue Share (%), by Country 2024 & 2032
List of Tables
- Table 1: Global Digital Pharmacy Industry Revenue Million Forecast, by Region 2019 & 2032
- Table 2: Global Digital Pharmacy Industry Revenue Million Forecast, by Drug Type 2019 & 2032
- Table 3: Global Digital Pharmacy Industry Revenue Million Forecast, by Product Type 2019 & 2032
- Table 4: Global Digital Pharmacy Industry Revenue Million Forecast, by Region 2019 & 2032
- Table 5: Global Digital Pharmacy Industry Revenue Million Forecast, by Country 2019 & 2032
- Table 6: United States Digital Pharmacy Industry Revenue (Million) Forecast, by Application 2019 & 2032
- Table 7: Canada Digital Pharmacy Industry Revenue (Million) Forecast, by Application 2019 & 2032
- Table 8: Mexico Digital Pharmacy Industry Revenue (Million) Forecast, by Application 2019 & 2032
- Table 9: Global Digital Pharmacy Industry Revenue Million Forecast, by Country 2019 & 2032
- Table 10: Germany Digital Pharmacy Industry Revenue (Million) Forecast, by Application 2019 & 2032
- Table 11: United Kingdom Digital Pharmacy Industry Revenue (Million) Forecast, by Application 2019 & 2032
- Table 12: France Digital Pharmacy Industry Revenue (Million) Forecast, by Application 2019 & 2032
- Table 13: Italy Digital Pharmacy Industry Revenue (Million) Forecast, by Application 2019 & 2032
- Table 14: Spain Digital Pharmacy Industry Revenue (Million) Forecast, by Application 2019 & 2032
- Table 15: Rest of Europe Digital Pharmacy Industry Revenue (Million) Forecast, by Application 2019 & 2032
- Table 16: Global Digital Pharmacy Industry Revenue Million Forecast, by Country 2019 & 2032
- Table 17: China Digital Pharmacy Industry Revenue (Million) Forecast, by Application 2019 & 2032
- Table 18: Japan Digital Pharmacy Industry Revenue (Million) Forecast, by Application 2019 & 2032
- Table 19: India Digital Pharmacy Industry Revenue (Million) Forecast, by Application 2019 & 2032
- Table 20: Australia Digital Pharmacy Industry Revenue (Million) Forecast, by Application 2019 & 2032
- Table 21: South Korea Digital Pharmacy Industry Revenue (Million) Forecast, by Application 2019 & 2032
- Table 22: Rest of Asia Pacific Digital Pharmacy Industry Revenue (Million) Forecast, by Application 2019 & 2032
- Table 23: Global Digital Pharmacy Industry Revenue Million Forecast, by Country 2019 & 2032
- Table 24: GCC Digital Pharmacy Industry Revenue (Million) Forecast, by Application 2019 & 2032
- Table 25: South Africa Digital Pharmacy Industry Revenue (Million) Forecast, by Application 2019 & 2032
- Table 26: Rest of Middle East and Africa Digital Pharmacy Industry Revenue (Million) Forecast, by Application 2019 & 2032
- Table 27: Global Digital Pharmacy Industry Revenue Million Forecast, by Country 2019 & 2032
- Table 28: Brazil Digital Pharmacy Industry Revenue (Million) Forecast, by Application 2019 & 2032
- Table 29: Argentina Digital Pharmacy Industry Revenue (Million) Forecast, by Application 2019 & 2032
- Table 30: Rest of South America Digital Pharmacy Industry Revenue (Million) Forecast, by Application 2019 & 2032
- Table 31: Global Digital Pharmacy Industry Revenue Million Forecast, by Drug Type 2019 & 2032
- Table 32: Global Digital Pharmacy Industry Revenue Million Forecast, by Product Type 2019 & 2032
- Table 33: Global Digital Pharmacy Industry Revenue Million Forecast, by Country 2019 & 2032
- Table 34: United States Digital Pharmacy Industry Revenue (Million) Forecast, by Application 2019 & 2032
- Table 35: Canada Digital Pharmacy Industry Revenue (Million) Forecast, by Application 2019 & 2032
- Table 36: Mexico Digital Pharmacy Industry Revenue (Million) Forecast, by Application 2019 & 2032
- Table 37: Global Digital Pharmacy Industry Revenue Million Forecast, by Drug Type 2019 & 2032
- Table 38: Global Digital Pharmacy Industry Revenue Million Forecast, by Product Type 2019 & 2032
- Table 39: Global Digital Pharmacy Industry Revenue Million Forecast, by Country 2019 & 2032
- Table 40: Germany Digital Pharmacy Industry Revenue (Million) Forecast, by Application 2019 & 2032
- Table 41: United Kingdom Digital Pharmacy Industry Revenue (Million) Forecast, by Application 2019 & 2032
- Table 42: France Digital Pharmacy Industry Revenue (Million) Forecast, by Application 2019 & 2032
- Table 43: Italy Digital Pharmacy Industry Revenue (Million) Forecast, by Application 2019 & 2032
- Table 44: Spain Digital Pharmacy Industry Revenue (Million) Forecast, by Application 2019 & 2032
- Table 45: Rest of Europe Digital Pharmacy Industry Revenue (Million) Forecast, by Application 2019 & 2032
- Table 46: Global Digital Pharmacy Industry Revenue Million Forecast, by Drug Type 2019 & 2032
- Table 47: Global Digital Pharmacy Industry Revenue Million Forecast, by Product Type 2019 & 2032
- Table 48: Global Digital Pharmacy Industry Revenue Million Forecast, by Country 2019 & 2032
- Table 49: China Digital Pharmacy Industry Revenue (Million) Forecast, by Application 2019 & 2032
- Table 50: Japan Digital Pharmacy Industry Revenue (Million) Forecast, by Application 2019 & 2032
- Table 51: India Digital Pharmacy Industry Revenue (Million) Forecast, by Application 2019 & 2032
- Table 52: Australia Digital Pharmacy Industry Revenue (Million) Forecast, by Application 2019 & 2032
- Table 53: South Korea Digital Pharmacy Industry Revenue (Million) Forecast, by Application 2019 & 2032
- Table 54: Rest of Asia Pacific Digital Pharmacy Industry Revenue (Million) Forecast, by Application 2019 & 2032
- Table 55: Global Digital Pharmacy Industry Revenue Million Forecast, by Drug Type 2019 & 2032
- Table 56: Global Digital Pharmacy Industry Revenue Million Forecast, by Product Type 2019 & 2032
- Table 57: Global Digital Pharmacy Industry Revenue Million Forecast, by Country 2019 & 2032
- Table 58: GCC Digital Pharmacy Industry Revenue (Million) Forecast, by Application 2019 & 2032
- Table 59: South Africa Digital Pharmacy Industry Revenue (Million) Forecast, by Application 2019 & 2032
- Table 60: Rest of Middle East and Africa Digital Pharmacy Industry Revenue (Million) Forecast, by Application 2019 & 2032
- Table 61: Global Digital Pharmacy Industry Revenue Million Forecast, by Drug Type 2019 & 2032
- Table 62: Global Digital Pharmacy Industry Revenue Million Forecast, by Product Type 2019 & 2032
- Table 63: Global Digital Pharmacy Industry Revenue Million Forecast, by Country 2019 & 2032
- Table 64: Brazil Digital Pharmacy Industry Revenue (Million) Forecast, by Application 2019 & 2032
- Table 65: Argentina Digital Pharmacy Industry Revenue (Million) Forecast, by Application 2019 & 2032
- Table 66: Rest of South America Digital Pharmacy Industry Revenue (Million) Forecast, by Application 2019 & 2032
Frequently Asked Questions
1. What is the projected Compound Annual Growth Rate (CAGR) of the Digital Pharmacy Industry?
The projected CAGR is approximately 13.60%.
2. Which companies are prominent players in the Digital Pharmacy Industry?
Key companies in the market include Optum Rx Inc, The Kroger Co, Apex Healthcare Berhad (Apex Pharmacy), CVS Health Corporation, Apollo Pharmacy, Axelia Solutions (Pharmeasy), DocMorris (Zur Rose Group AG), Walgreen Boots Alliance (Walgreen Co ), Amazon com Inc, Netmeds com*List Not Exhaustive, Cigna Corporation (Express Scripts Holdings), Giant Eagle Inc.
3. What are the main segments of the Digital Pharmacy Industry?
The market segments include Drug Type, Product Type.
4. Can you provide details about the market size?
The market size is estimated to be USD 104.83 Million as of 2022.
5. What are some drivers contributing to market growth?
Increased Access to Web-based and Online Services; Rising Implementation of E-prescriptions in Hospitals and Other Healthcare Services.
6. What are the notable trends driving market growth?
The Over-the-Counter Drugs Segment. under Drug Type. is Expected to Grow at the Fastest Rate during the Forecast Period.
7. Are there any restraints impacting market growth?
Increasing Number of Illegal Online Pharmacies; Low Penetration in Rural Areas in Developing Countries.
8. Can you provide examples of recent developments in the market?
In September 2022, Amazon stated that it was planning to sell prescription medications online in Japan. To build a platform where patients can get online instructions on taking medications, it aims to collaborate with small and medium-sized pharmacies. Without visiting a pharmacy, customers could have their drugs delivered to their homes.
9. What pricing options are available for accessing the report?
Pricing options include single-user, multi-user, and enterprise licenses priced at USD 4750, USD 5250, and USD 8750 respectively.
10. Is the market size provided in terms of value or volume?
The market size is provided in terms of value, measured in Million.
11. Are there any specific market keywords associated with the report?
Yes, the market keyword associated with the report is "Digital Pharmacy Industry," which aids in identifying and referencing the specific market segment covered.
12. How do I determine which pricing option suits my needs best?
The pricing options vary based on user requirements and access needs. Individual users may opt for single-user licenses, while businesses requiring broader access may choose multi-user or enterprise licenses for cost-effective access to the report.
13. Are there any additional resources or data provided in the Digital Pharmacy Industry report?
While the report offers comprehensive insights, it's advisable to review the specific contents or supplementary materials provided to ascertain if additional resources or data are available.
14. How can I stay updated on further developments or reports in the Digital Pharmacy Industry?
To stay informed about further developments, trends, and reports in the Digital Pharmacy Industry, consider subscribing to industry newsletters, following relevant companies and organizations, or regularly checking reputable industry news sources and publications.
Methodology
Step 1 - Identification of Relevant Samples Size from Population Database


Step 2 - Approaches for Defining Global Market Size (Value, Volume* & Price*)

Note*: In applicable scenarios
Step 3 - Data Sources
Primary Research
- Web Analytics
- Survey Reports
- Research Institute
- Latest Research Reports
- Opinion Leaders
Secondary Research
- Annual Reports
- White Paper
- Latest Press Release
- Industry Association
- Paid Database
- Investor Presentations

Step 4 - Data Triangulation
Involves using different sources of information in order to increase the validity of a study
These sources are likely to be stakeholders in a program - participants, other researchers, program staff, other community members, and so on.
Then we put all data in single framework & apply various statistical tools to find out the dynamic on the market.
During the analysis stage, feedback from the stakeholder groups would be compared to determine areas of agreement as well as areas of divergence


