

Key Insights
The digital pathology market is experiencing significant expansion, driven by the widespread adoption of digital imaging in pathology departments and healthcare facilities. This technological shift from traditional microscopy to digital solutions offers enhanced efficiency, superior diagnostic accuracy, and improved collaboration among pathologists. Key growth catalysts include the increasing incidence of chronic diseases, the escalating demand for remote pathology services facilitated by telehealth, and the critical need for standardized diagnostic protocols. The market is segmented by technology, including whole slide imaging and image analysis software; by application, such as oncology and neurology; and by end-user, encompassing hospitals, diagnostic laboratories, and research institutions. Leading companies are investing heavily in research and development, fueling innovation and competition in this dynamic sector. While initial capital investment may present a challenge for smaller organizations, the long-term advantages of optimized workflows, reduced operational costs, and advanced diagnostic capabilities are prompting widespread adoption of digital pathology solutions. Continued market growth is anticipated, with notable expansion expected in emerging economies as technology becomes more accessible and cost-effective. The integration of artificial intelligence and machine learning into digital pathology platforms represents a significant trend, poised to further elevate diagnostic precision and expedite the diagnostic process.
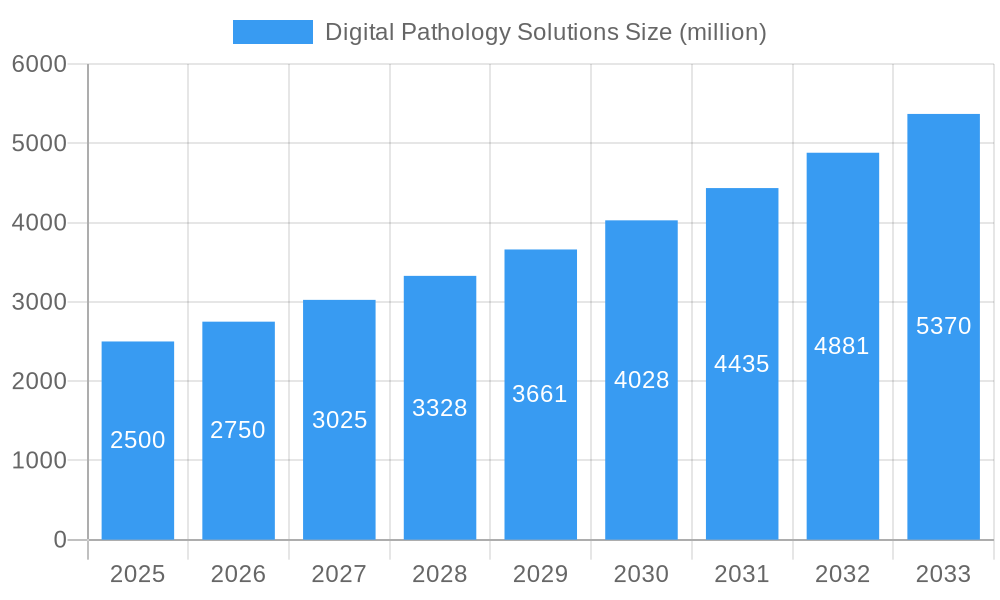
Digital Pathology Solutions Market Size (In Billion)
The forecast period, 2025-2033, is expected to witness sustained market growth, propelled by ongoing technological advancements and the expansion of global healthcare infrastructure. The competitive landscape features a blend of established market leaders and agile, innovative entrants. Strategic alliances and mergers and acquisitions are likely to influence market consolidation in the coming years. North America and Europe currently dominate the market, but substantial growth potential lies within the Asia-Pacific region and other developing economies as healthcare infrastructure matures and awareness of digital pathology's benefits increases. Regulatory approvals and reimbursement policies will significantly influence the pace of market expansion across different geographical areas. The persistent focus on improving patient outcomes, reducing healthcare expenditures, and enhancing diagnostic process efficiency will continue to drive the growth of the digital pathology solutions market.
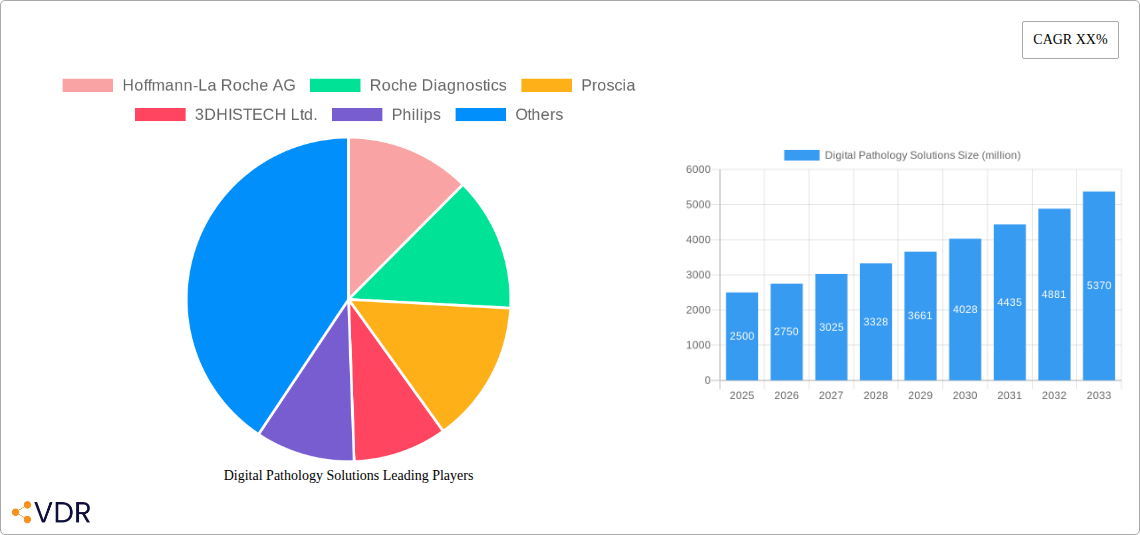
Digital Pathology Solutions Company Market Share
This report offers a comprehensive analysis of the Digital Pathology Solutions market, detailing market dynamics, growth trajectories, regional leadership, product offerings, key stakeholders, and future projections. The study period covers 2019-2033, with 2025 designated as the base and estimated year. The forecast period extends from 2025-2033, with the historical period spanning 2019-2024. This research is essential for industry professionals, investors, and stakeholders aiming to understand and leverage opportunities within this rapidly evolving market. The estimated market size in 2025 is $1.53 billion, with a projected growth to $8.6 billion by 2033, exhibiting a compound annual growth rate (CAGR) of 8.6%.
Digital Pathology Solutions Market Dynamics & Structure
The digital pathology market is characterized by moderate concentration, with key players like Roche Diagnostics, Hoffmann-La Roche AG, and Proscia holding significant market share. However, the market is witnessing increased competition from smaller, specialized firms. Technological innovation, particularly in AI-powered image analysis and cloud-based solutions, is a major driver. Regulatory frameworks, including those related to data privacy and diagnostic accuracy, are constantly evolving and impact market growth. The market also faces competition from traditional pathology methods.
- Market Concentration: Moderately concentrated, with top 5 players holding approximately xx% market share in 2025.
- Technological Innovation: AI-powered image analysis, cloud-based platforms, and whole slide imaging are key drivers.
- Regulatory Landscape: Stringent regulatory approvals and data privacy regulations influence market entry and adoption.
- Competitive Substitutes: Traditional microscopy and manual pathology methods.
- End-User Demographics: Hospitals, diagnostic labs, pharmaceutical companies, and research institutions are primary end-users.
- M&A Activity: The past five years saw approximately xx M&A deals, indicating a consolidating market landscape.
Digital Pathology Solutions Growth Trends & Insights
The digital pathology market experienced significant growth during the historical period (2019-2024), driven by increasing adoption of digital imaging technologies and the benefits of remote diagnostics. The market is projected to maintain a robust CAGR of xx% during the forecast period (2025-2033), reaching an estimated xx million by 2033. This growth is fueled by technological advancements, rising demand for improved diagnostic accuracy, and increasing healthcare spending globally. Market penetration in developed regions is relatively higher compared to emerging markets, but emerging markets present significant growth opportunities. Changing consumer behavior, with increasing preference for remote healthcare services, further supports market expansion.
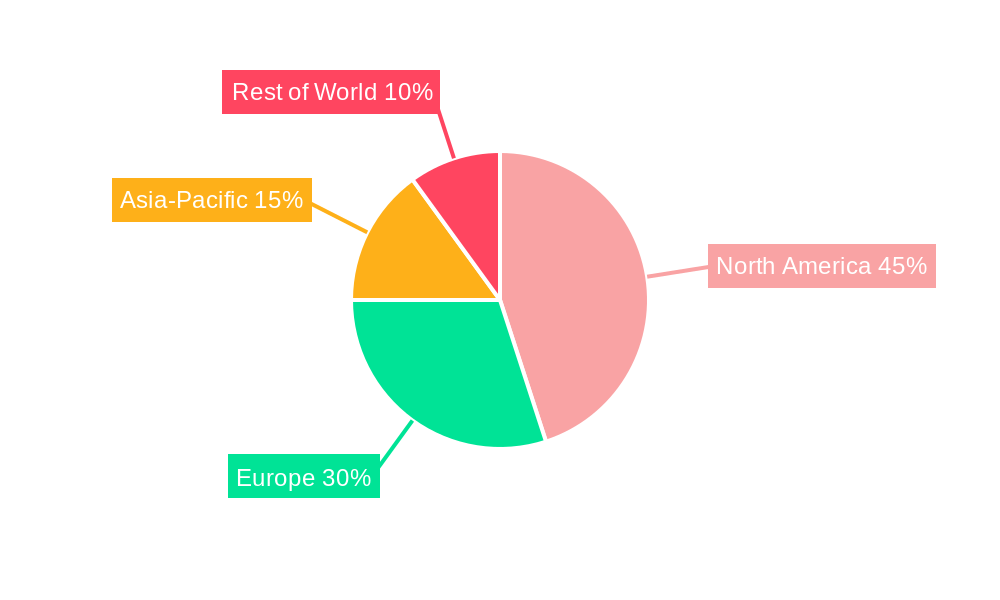
Dominant Regions, Countries, or Segments in Digital Pathology Solutions
North America currently holds the largest market share in digital pathology, driven by high adoption rates, robust healthcare infrastructure, and significant investments in R&D. Europe follows closely, with strong government support for digital health initiatives and a well-established healthcare system. However, the Asia-Pacific region is projected to exhibit the fastest growth, fueled by increasing healthcare spending, rising prevalence of chronic diseases, and growing awareness of the benefits of digital pathology.
- North America: High adoption rates, robust healthcare infrastructure, and significant R&D investments drive market dominance.
- Europe: Strong government support for digital health and a well-established healthcare system contribute to high growth.
- Asia-Pacific: Fastest-growing region due to rising healthcare spending, increasing disease prevalence, and growing awareness.
Digital Pathology Solutions Product Landscape
The digital pathology product landscape encompasses whole slide scanners, image management systems, AI-powered diagnostic tools, and related software and services. Key product innovations include improved image resolution, faster scanning speeds, and more sophisticated AI algorithms for automated analysis. Unique selling propositions revolve around enhanced diagnostic accuracy, streamlined workflows, improved collaboration among pathologists, and reduced operational costs. Technological advancements, such as deep learning and cloud computing, are constantly enhancing product capabilities and performance.
Key Drivers, Barriers & Challenges in Digital Pathology Solutions
Key Drivers:
- Increasing demand for improved diagnostic accuracy and efficiency.
- Rising healthcare spending and investments in digital health technologies.
- Growing adoption of telehealth and remote diagnostics.
- Technological advancements in AI and image analysis.
Key Challenges:
- High initial investment costs associated with implementing digital pathology systems.
- Concerns regarding data security and privacy.
- Regulatory hurdles and standardization challenges.
- Lack of skilled professionals trained in digital pathology techniques. This translates to an estimated xx million shortfall in trained personnel by 2030.
Emerging Opportunities in Digital Pathology Solutions
- Expanding applications in areas such as oncology, neurology, and infectious disease diagnostics.
- Growing demand for AI-powered solutions for disease prediction and personalized medicine.
- Increased adoption of cloud-based platforms for remote collaboration and data sharing.
- Penetration into untapped markets in developing economies.
Growth Accelerators in the Digital Pathology Solutions Industry
Strategic partnerships between technology providers and healthcare institutions, coupled with advancements in AI and machine learning algorithms, are crucial growth catalysts. Government initiatives promoting digital health and funding for R&D further accelerate market expansion. The continuous development of user-friendly, scalable, and cost-effective solutions is driving wider adoption and market growth.
Key Players Shaping the Digital Pathology Solutions Market
- Roche Diagnostics
- Hoffmann-La Roche AG
- Proscia
- 3DHISTECH Ltd.
- Philips
- Siemens
- Q2 Solutions
- TriStar Technology Group
- Iron Mountain
- Smart In Media AG
- HealthTrust Europe
- Dedalus
- Tribun Health
- Qube scientific
- Leica Biosystems
Notable Milestones in Digital Pathology Solutions Sector
- 2020: FDA approval of several AI-powered diagnostic tools for digital pathology.
- 2021: Launch of several cloud-based digital pathology platforms.
- 2022: Significant increase in M&A activity amongst digital pathology companies.
- 2023: Development of novel algorithms for improved image analysis and diagnostic accuracy.
In-Depth Digital Pathology Solutions Market Outlook
The digital pathology market is poised for continued strong growth, driven by ongoing technological advancements, expanding applications, and increasing demand for improved healthcare solutions. Strategic partnerships, investments in R&D, and government support will further fuel market expansion. Focus on developing cost-effective, user-friendly solutions, and addressing regulatory challenges will be key to unlocking the full potential of this market. The focus on AI-driven diagnostics and remote pathology will be key factors driving this expansion.
Digital Pathology Solutions Segmentation
-
1. Application
- 1.1. Pathological Diagnosis
- 1.2. Clinical Laboratory
- 1.3. Drug Discovery
- 1.4. Others
-
2. Types
- 2.1. Cytopathology
- 2.2. Histopathology
Digital Pathology Solutions Segmentation By Geography
-
1. North America
- 1.1. United States
- 1.2. Canada
- 1.3. Mexico
-
2. South America
- 2.1. Brazil
- 2.2. Argentina
- 2.3. Rest of South America
-
3. Europe
- 3.1. United Kingdom
- 3.2. Germany
- 3.3. France
- 3.4. Italy
- 3.5. Spain
- 3.6. Russia
- 3.7. Benelux
- 3.8. Nordics
- 3.9. Rest of Europe
-
4. Middle East & Africa
- 4.1. Turkey
- 4.2. Israel
- 4.3. GCC
- 4.4. North Africa
- 4.5. South Africa
- 4.6. Rest of Middle East & Africa
-
5. Asia Pacific
- 5.1. China
- 5.2. India
- 5.3. Japan
- 5.4. South Korea
- 5.5. ASEAN
- 5.6. Oceania
- 5.7. Rest of Asia Pacific
Digital Pathology Solutions Regional Market Share
Geographic Coverage of Digital Pathology Solutions
Digital Pathology Solutions REPORT HIGHLIGHTS
| Aspects | Details |
|---|---|
| Study Period | 2020-2034 |
| Base Year | 2025 |
| Estimated Year | 2026 |
| Forecast Period | 2026-2034 |
| Historical Period | 2020-2025 |
| Growth Rate | CAGR of 8.6% from 2020-2034 |
| Segmentation |
|
Table of Contents
- 1. Introduction
- 1.1. Research Scope
- 1.2. Market Segmentation
- 1.3. Research Objective
- 1.4. Definitions and Assumptions
- 2. Executive Summary
- 2.1. Market Snapshot
- 3. Market Dynamics
- 3.1. Market Drivers
- 3.2. Market Restrains
- 3.3. Market Trends
- 3.4. Market Opportunities
- 4. Market Factor Analysis
- 4.1. Porters Five Forces
- 4.1.1. Bargaining Power of Suppliers
- 4.1.2. Bargaining Power of Buyers
- 4.1.3. Threat of New Entrants
- 4.1.4. Threat of Substitutes
- 4.1.5. Competitive Rivalry
- 4.2. PESTEL analysis
- 4.3. BCG Analysis
- 4.3.1. Stars (High Growth, High Market Share)
- 4.3.2. Cash Cows (Low Growth, High Market Share)
- 4.3.3. Question Mark (High Growth, Low Market Share)
- 4.3.4. Dogs (Low Growth, Low Market Share)
- 4.4. Ansoff Matrix Analysis
- 4.5. Supply Chain Analysis
- 4.6. Regulatory Landscape
- 4.7. Current Market Potential and Opportunity Assessment (TAM–SAM–SOM Framework)
- 4.8. VDR Analyst Note
- 4.1. Porters Five Forces
- 5. Market Analysis, Insights and Forecast 2021-2033
- 5.1. Market Analysis, Insights and Forecast - by Application
- 5.1.1. Pathological Diagnosis
- 5.1.2. Clinical Laboratory
- 5.1.3. Drug Discovery
- 5.1.4. Others
- 5.2. Market Analysis, Insights and Forecast - by Types
- 5.2.1. Cytopathology
- 5.2.2. Histopathology
- 5.3. Market Analysis, Insights and Forecast - by Region
- 5.3.1. North America
- 5.3.2. South America
- 5.3.3. Europe
- 5.3.4. Middle East & Africa
- 5.3.5. Asia Pacific
- 5.1. Market Analysis, Insights and Forecast - by Application
- 6. Global Digital Pathology Solutions Analysis, Insights and Forecast, 2021-2033
- 6.1. Market Analysis, Insights and Forecast - by Application
- 6.1.1. Pathological Diagnosis
- 6.1.2. Clinical Laboratory
- 6.1.3. Drug Discovery
- 6.1.4. Others
- 6.2. Market Analysis, Insights and Forecast - by Types
- 6.2.1. Cytopathology
- 6.2.2. Histopathology
- 6.1. Market Analysis, Insights and Forecast - by Application
- 7. North America Digital Pathology Solutions Analysis, Insights and Forecast, 2021-2033
- 7.1. Market Analysis, Insights and Forecast - by Application
- 7.1.1. Pathological Diagnosis
- 7.1.2. Clinical Laboratory
- 7.1.3. Drug Discovery
- 7.1.4. Others
- 7.2. Market Analysis, Insights and Forecast - by Types
- 7.2.1. Cytopathology
- 7.2.2. Histopathology
- 7.1. Market Analysis, Insights and Forecast - by Application
- 8. South America Digital Pathology Solutions Analysis, Insights and Forecast, 2021-2033
- 8.1. Market Analysis, Insights and Forecast - by Application
- 8.1.1. Pathological Diagnosis
- 8.1.2. Clinical Laboratory
- 8.1.3. Drug Discovery
- 8.1.4. Others
- 8.2. Market Analysis, Insights and Forecast - by Types
- 8.2.1. Cytopathology
- 8.2.2. Histopathology
- 8.1. Market Analysis, Insights and Forecast - by Application
- 9. Europe Digital Pathology Solutions Analysis, Insights and Forecast, 2021-2033
- 9.1. Market Analysis, Insights and Forecast - by Application
- 9.1.1. Pathological Diagnosis
- 9.1.2. Clinical Laboratory
- 9.1.3. Drug Discovery
- 9.1.4. Others
- 9.2. Market Analysis, Insights and Forecast - by Types
- 9.2.1. Cytopathology
- 9.2.2. Histopathology
- 9.1. Market Analysis, Insights and Forecast - by Application
- 10. Middle East & Africa Digital Pathology Solutions Analysis, Insights and Forecast, 2021-2033
- 10.1. Market Analysis, Insights and Forecast - by Application
- 10.1.1. Pathological Diagnosis
- 10.1.2. Clinical Laboratory
- 10.1.3. Drug Discovery
- 10.1.4. Others
- 10.2. Market Analysis, Insights and Forecast - by Types
- 10.2.1. Cytopathology
- 10.2.2. Histopathology
- 10.1. Market Analysis, Insights and Forecast - by Application
- 11. Asia Pacific Digital Pathology Solutions Analysis, Insights and Forecast, 2021-2033
- 11.1. Market Analysis, Insights and Forecast - by Application
- 11.1.1. Pathological Diagnosis
- 11.1.2. Clinical Laboratory
- 11.1.3. Drug Discovery
- 11.1.4. Others
- 11.2. Market Analysis, Insights and Forecast - by Types
- 11.2.1. Cytopathology
- 11.2.2. Histopathology
- 11.1. Market Analysis, Insights and Forecast - by Application
- 12. Competitive Analysis
- 12.1. Company Profiles
- 12.1.1 Hoffmann-La Roche AG
- 12.1.1.1. Company Overview
- 12.1.1.2. Products
- 12.1.1.3. Company Financials
- 12.1.1.4. SWOT Analysis
- 12.1.2 Roche Diagnostics
- 12.1.2.1. Company Overview
- 12.1.2.2. Products
- 12.1.2.3. Company Financials
- 12.1.2.4. SWOT Analysis
- 12.1.3 Proscia
- 12.1.3.1. Company Overview
- 12.1.3.2. Products
- 12.1.3.3. Company Financials
- 12.1.3.4. SWOT Analysis
- 12.1.4 3DHISTECH Ltd.
- 12.1.4.1. Company Overview
- 12.1.4.2. Products
- 12.1.4.3. Company Financials
- 12.1.4.4. SWOT Analysis
- 12.1.5 Philips
- 12.1.5.1. Company Overview
- 12.1.5.2. Products
- 12.1.5.3. Company Financials
- 12.1.5.4. SWOT Analysis
- 12.1.6 Siemens
- 12.1.6.1. Company Overview
- 12.1.6.2. Products
- 12.1.6.3. Company Financials
- 12.1.6.4. SWOT Analysis
- 12.1.7 Q2 Solutions
- 12.1.7.1. Company Overview
- 12.1.7.2. Products
- 12.1.7.3. Company Financials
- 12.1.7.4. SWOT Analysis
- 12.1.8 TriStar Technology Group
- 12.1.8.1. Company Overview
- 12.1.8.2. Products
- 12.1.8.3. Company Financials
- 12.1.8.4. SWOT Analysis
- 12.1.9 Iron Mountain
- 12.1.9.1. Company Overview
- 12.1.9.2. Products
- 12.1.9.3. Company Financials
- 12.1.9.4. SWOT Analysis
- 12.1.10 Smart In Media AG
- 12.1.10.1. Company Overview
- 12.1.10.2. Products
- 12.1.10.3. Company Financials
- 12.1.10.4. SWOT Analysis
- 12.1.11 HealthTrust Europe
- 12.1.11.1. Company Overview
- 12.1.11.2. Products
- 12.1.11.3. Company Financials
- 12.1.11.4. SWOT Analysis
- 12.1.12 Dedalus
- 12.1.12.1. Company Overview
- 12.1.12.2. Products
- 12.1.12.3. Company Financials
- 12.1.12.4. SWOT Analysis
- 12.1.13 Tribun Health
- 12.1.13.1. Company Overview
- 12.1.13.2. Products
- 12.1.13.3. Company Financials
- 12.1.13.4. SWOT Analysis
- 12.1.14 Qube scientific
- 12.1.14.1. Company Overview
- 12.1.14.2. Products
- 12.1.14.3. Company Financials
- 12.1.14.4. SWOT Analysis
- 12.1.15 Leica Biosystems
- 12.1.15.1. Company Overview
- 12.1.15.2. Products
- 12.1.15.3. Company Financials
- 12.1.15.4. SWOT Analysis
- 12.1.1 Hoffmann-La Roche AG
- 12.2. Market Entropy
- 12.2.1 Company's Key Areas Served
- 12.2.2 Recent Developments
- 12.3. Company Market Share Analysis 2025
- 12.3.1 Top 5 Companies Market Share Analysis
- 12.3.2 Top 3 Companies Market Share Analysis
- 12.4. List of Potential Customers
- 13. Research Methodology
List of Figures
- Figure 1: Global Digital Pathology Solutions Revenue Breakdown (billion, %) by Region 2025 & 2033
- Figure 2: North America Digital Pathology Solutions Revenue (billion), by Application 2025 & 2033
- Figure 3: North America Digital Pathology Solutions Revenue Share (%), by Application 2025 & 2033
- Figure 4: North America Digital Pathology Solutions Revenue (billion), by Types 2025 & 2033
- Figure 5: North America Digital Pathology Solutions Revenue Share (%), by Types 2025 & 2033
- Figure 6: North America Digital Pathology Solutions Revenue (billion), by Country 2025 & 2033
- Figure 7: North America Digital Pathology Solutions Revenue Share (%), by Country 2025 & 2033
- Figure 8: South America Digital Pathology Solutions Revenue (billion), by Application 2025 & 2033
- Figure 9: South America Digital Pathology Solutions Revenue Share (%), by Application 2025 & 2033
- Figure 10: South America Digital Pathology Solutions Revenue (billion), by Types 2025 & 2033
- Figure 11: South America Digital Pathology Solutions Revenue Share (%), by Types 2025 & 2033
- Figure 12: South America Digital Pathology Solutions Revenue (billion), by Country 2025 & 2033
- Figure 13: South America Digital Pathology Solutions Revenue Share (%), by Country 2025 & 2033
- Figure 14: Europe Digital Pathology Solutions Revenue (billion), by Application 2025 & 2033
- Figure 15: Europe Digital Pathology Solutions Revenue Share (%), by Application 2025 & 2033
- Figure 16: Europe Digital Pathology Solutions Revenue (billion), by Types 2025 & 2033
- Figure 17: Europe Digital Pathology Solutions Revenue Share (%), by Types 2025 & 2033
- Figure 18: Europe Digital Pathology Solutions Revenue (billion), by Country 2025 & 2033
- Figure 19: Europe Digital Pathology Solutions Revenue Share (%), by Country 2025 & 2033
- Figure 20: Middle East & Africa Digital Pathology Solutions Revenue (billion), by Application 2025 & 2033
- Figure 21: Middle East & Africa Digital Pathology Solutions Revenue Share (%), by Application 2025 & 2033
- Figure 22: Middle East & Africa Digital Pathology Solutions Revenue (billion), by Types 2025 & 2033
- Figure 23: Middle East & Africa Digital Pathology Solutions Revenue Share (%), by Types 2025 & 2033
- Figure 24: Middle East & Africa Digital Pathology Solutions Revenue (billion), by Country 2025 & 2033
- Figure 25: Middle East & Africa Digital Pathology Solutions Revenue Share (%), by Country 2025 & 2033
- Figure 26: Asia Pacific Digital Pathology Solutions Revenue (billion), by Application 2025 & 2033
- Figure 27: Asia Pacific Digital Pathology Solutions Revenue Share (%), by Application 2025 & 2033
- Figure 28: Asia Pacific Digital Pathology Solutions Revenue (billion), by Types 2025 & 2033
- Figure 29: Asia Pacific Digital Pathology Solutions Revenue Share (%), by Types 2025 & 2033
- Figure 30: Asia Pacific Digital Pathology Solutions Revenue (billion), by Country 2025 & 2033
- Figure 31: Asia Pacific Digital Pathology Solutions Revenue Share (%), by Country 2025 & 2033
List of Tables
- Table 1: Global Digital Pathology Solutions Revenue billion Forecast, by Application 2020 & 2033
- Table 2: Global Digital Pathology Solutions Revenue billion Forecast, by Types 2020 & 2033
- Table 3: Global Digital Pathology Solutions Revenue billion Forecast, by Region 2020 & 2033
- Table 4: Global Digital Pathology Solutions Revenue billion Forecast, by Application 2020 & 2033
- Table 5: Global Digital Pathology Solutions Revenue billion Forecast, by Types 2020 & 2033
- Table 6: Global Digital Pathology Solutions Revenue billion Forecast, by Country 2020 & 2033
- Table 7: United States Digital Pathology Solutions Revenue (billion) Forecast, by Application 2020 & 2033
- Table 8: Canada Digital Pathology Solutions Revenue (billion) Forecast, by Application 2020 & 2033
- Table 9: Mexico Digital Pathology Solutions Revenue (billion) Forecast, by Application 2020 & 2033
- Table 10: Global Digital Pathology Solutions Revenue billion Forecast, by Application 2020 & 2033
- Table 11: Global Digital Pathology Solutions Revenue billion Forecast, by Types 2020 & 2033
- Table 12: Global Digital Pathology Solutions Revenue billion Forecast, by Country 2020 & 2033
- Table 13: Brazil Digital Pathology Solutions Revenue (billion) Forecast, by Application 2020 & 2033
- Table 14: Argentina Digital Pathology Solutions Revenue (billion) Forecast, by Application 2020 & 2033
- Table 15: Rest of South America Digital Pathology Solutions Revenue (billion) Forecast, by Application 2020 & 2033
- Table 16: Global Digital Pathology Solutions Revenue billion Forecast, by Application 2020 & 2033
- Table 17: Global Digital Pathology Solutions Revenue billion Forecast, by Types 2020 & 2033
- Table 18: Global Digital Pathology Solutions Revenue billion Forecast, by Country 2020 & 2033
- Table 19: United Kingdom Digital Pathology Solutions Revenue (billion) Forecast, by Application 2020 & 2033
- Table 20: Germany Digital Pathology Solutions Revenue (billion) Forecast, by Application 2020 & 2033
- Table 21: France Digital Pathology Solutions Revenue (billion) Forecast, by Application 2020 & 2033
- Table 22: Italy Digital Pathology Solutions Revenue (billion) Forecast, by Application 2020 & 2033
- Table 23: Spain Digital Pathology Solutions Revenue (billion) Forecast, by Application 2020 & 2033
- Table 24: Russia Digital Pathology Solutions Revenue (billion) Forecast, by Application 2020 & 2033
- Table 25: Benelux Digital Pathology Solutions Revenue (billion) Forecast, by Application 2020 & 2033
- Table 26: Nordics Digital Pathology Solutions Revenue (billion) Forecast, by Application 2020 & 2033
- Table 27: Rest of Europe Digital Pathology Solutions Revenue (billion) Forecast, by Application 2020 & 2033
- Table 28: Global Digital Pathology Solutions Revenue billion Forecast, by Application 2020 & 2033
- Table 29: Global Digital Pathology Solutions Revenue billion Forecast, by Types 2020 & 2033
- Table 30: Global Digital Pathology Solutions Revenue billion Forecast, by Country 2020 & 2033
- Table 31: Turkey Digital Pathology Solutions Revenue (billion) Forecast, by Application 2020 & 2033
- Table 32: Israel Digital Pathology Solutions Revenue (billion) Forecast, by Application 2020 & 2033
- Table 33: GCC Digital Pathology Solutions Revenue (billion) Forecast, by Application 2020 & 2033
- Table 34: North Africa Digital Pathology Solutions Revenue (billion) Forecast, by Application 2020 & 2033
- Table 35: South Africa Digital Pathology Solutions Revenue (billion) Forecast, by Application 2020 & 2033
- Table 36: Rest of Middle East & Africa Digital Pathology Solutions Revenue (billion) Forecast, by Application 2020 & 2033
- Table 37: Global Digital Pathology Solutions Revenue billion Forecast, by Application 2020 & 2033
- Table 38: Global Digital Pathology Solutions Revenue billion Forecast, by Types 2020 & 2033
- Table 39: Global Digital Pathology Solutions Revenue billion Forecast, by Country 2020 & 2033
- Table 40: China Digital Pathology Solutions Revenue (billion) Forecast, by Application 2020 & 2033
- Table 41: India Digital Pathology Solutions Revenue (billion) Forecast, by Application 2020 & 2033
- Table 42: Japan Digital Pathology Solutions Revenue (billion) Forecast, by Application 2020 & 2033
- Table 43: South Korea Digital Pathology Solutions Revenue (billion) Forecast, by Application 2020 & 2033
- Table 44: ASEAN Digital Pathology Solutions Revenue (billion) Forecast, by Application 2020 & 2033
- Table 45: Oceania Digital Pathology Solutions Revenue (billion) Forecast, by Application 2020 & 2033
- Table 46: Rest of Asia Pacific Digital Pathology Solutions Revenue (billion) Forecast, by Application 2020 & 2033
Frequently Asked Questions
1. What is the projected Compound Annual Growth Rate (CAGR) of the Digital Pathology Solutions?
The projected CAGR is approximately 8.6%.
2. Which companies are prominent players in the Digital Pathology Solutions?
Key companies in the market include Hoffmann-La Roche AG, Roche Diagnostics, Proscia, 3DHISTECH Ltd., Philips, Siemens, Q2 Solutions, TriStar Technology Group, Iron Mountain, Smart In Media AG, HealthTrust Europe, Dedalus, Tribun Health, Qube scientific, Leica Biosystems.
3. What are the main segments of the Digital Pathology Solutions?
The market segments include Application, Types.
4. Can you provide details about the market size?
The market size is estimated to be USD 1.53 billion as of 2022.
5. What are some drivers contributing to market growth?
N/A
6. What are the notable trends driving market growth?
N/A
7. Are there any restraints impacting market growth?
N/A
8. Can you provide examples of recent developments in the market?
N/A
9. What pricing options are available for accessing the report?
Pricing options include single-user, multi-user, and enterprise licenses priced at USD 4350.00, USD 6525.00, and USD 8700.00 respectively.
10. Is the market size provided in terms of value or volume?
The market size is provided in terms of value, measured in billion.
11. Are there any specific market keywords associated with the report?
Yes, the market keyword associated with the report is "Digital Pathology Solutions," which aids in identifying and referencing the specific market segment covered.
12. How do I determine which pricing option suits my needs best?
The pricing options vary based on user requirements and access needs. Individual users may opt for single-user licenses, while businesses requiring broader access may choose multi-user or enterprise licenses for cost-effective access to the report.
13. Are there any additional resources or data provided in the Digital Pathology Solutions report?
While the report offers comprehensive insights, it's advisable to review the specific contents or supplementary materials provided to ascertain if additional resources or data are available.
14. How can I stay updated on further developments or reports in the Digital Pathology Solutions?
To stay informed about further developments, trends, and reports in the Digital Pathology Solutions, consider subscribing to industry newsletters, following relevant companies and organizations, or regularly checking reputable industry news sources and publications.
Methodology
Step 1 - Identification of Relevant Samples Size from Population Database


Step 2 - Approaches for Defining Global Market Size (Value, Volume* & Price*)

Note*: In applicable scenarios
Step 3 - Data Sources
Primary Research
- Web Analytics
- Survey Reports
- Research Institute
- Latest Research Reports
- Opinion Leaders
Secondary Research
- Annual Reports
- White Paper
- Latest Press Release
- Industry Association
- Paid Database
- Investor Presentations

Step 4 - Data Triangulation
Involves using different sources of information in order to increase the validity of a study
These sources are likely to be stakeholders in a program - participants, other researchers, program staff, other community members, and so on.
Then we put all data in single framework & apply various statistical tools to find out the dynamic on the market.
During the analysis stage, feedback from the stakeholder groups would be compared to determine areas of agreement as well as areas of divergence