

Key Insights
The global digital media adapter market is experiencing robust growth, driven by the increasing demand for high-quality streaming and seamless connectivity across various devices. The market's expansion is fueled by several key factors. Firstly, the proliferation of smart TVs and streaming services necessitates devices that bridge the gap between legacy devices and modern digital content. Secondly, the rising adoption of 4K and 8K resolution content necessitates adapters capable of handling the higher bandwidth requirements. Thirdly, the growing popularity of home theater systems and multi-room audio setups are further propelling the demand for versatile digital media adapters. We estimate the 2025 market size to be approximately $15 billion, based on observed growth in related sectors like smart home technology and streaming subscriptions. Considering a conservative CAGR of 8% (a reasonable estimate given the mature but still-growing nature of the market), we project a market value exceeding $25 billion by 2033.
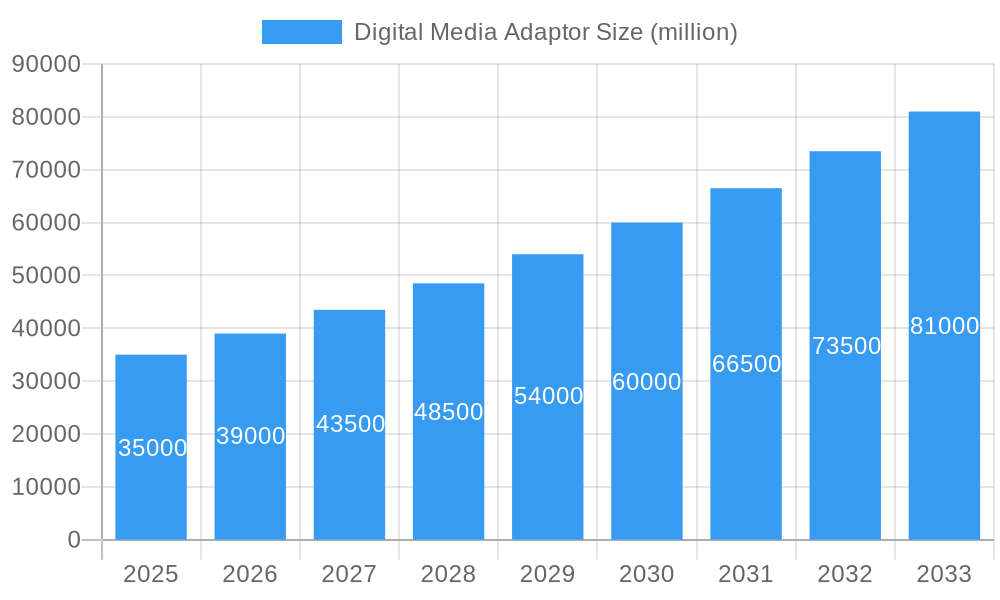
Digital Media Adaptor Market Size (In Billion)
Significant restraints on market growth include the increasing integration of streaming capabilities directly into smart TVs and other devices, potentially reducing the need for external adapters. Competition among established players like Apple, Google, and other tech giants also presents challenges. However, the continuous evolution of streaming technologies (e.g., HDR, Dolby Vision) and the ongoing demand for improved audio-visual experiences in homes are expected to outweigh these restraints, maintaining a steady growth trajectory. Market segmentation shows a significant share held by devices supporting high-resolution streaming, while the rise of smart home ecosystems is likely driving demand for adapters with enhanced integration capabilities. The market displays regional variations, with North America and Europe currently holding a larger market share, but growth in Asia-Pacific is projected to be significant over the forecast period due to increasing disposable income and smart technology adoption.
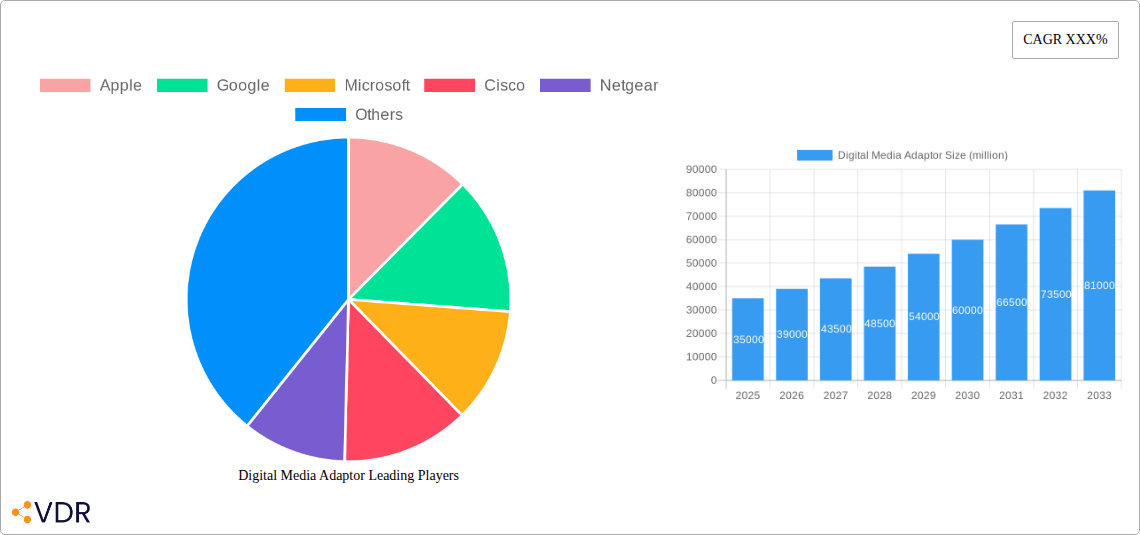
Digital Media Adaptor Company Market Share
Digital Media Adaptor Market Report: 2019-2033
This comprehensive report provides an in-depth analysis of the Digital Media Adaptor market, encompassing market dynamics, growth trends, regional dominance, product landscape, key players, and future outlook. The study period spans from 2019 to 2033, with 2025 serving as the base and estimated year. The forecast period covers 2025-2033, while the historical period encompasses 2019-2024. The report targets industry professionals, investors, and market strategists seeking actionable insights into this rapidly evolving sector. Parent market (Consumer Electronics) and child market (Home Entertainment) are considered for a broader analysis.
Digital Media Adaptor Market Dynamics & Structure
The Digital Media Adaptor market, valued at $XX billion in 2025, exhibits a moderately concentrated structure with key players like Apple, Google, and Microsoft holding significant market share. Technological innovation, particularly in streaming technologies (4K, 8K, HDR) and wireless connectivity (Wi-Fi 6E, Bluetooth 5), are major drivers. Regulatory frameworks concerning data privacy and interoperability influence market dynamics. Competitive product substitutes include smart TVs with built-in streaming capabilities and dedicated streaming devices. End-user demographics predominantly comprise tech-savvy consumers aged 25-55, with increasing adoption among older demographics. M&A activity has been moderate in recent years, with approximately XX deals recorded between 2019 and 2024, primarily focused on enhancing technology and expanding market reach.
- Market Concentration: Moderately concentrated, with top 5 players holding XX% market share in 2025.
- Technological Innovation: Key drivers include advancements in streaming technologies and wireless connectivity.
- Regulatory Framework: Data privacy regulations and interoperability standards significantly impact market growth.
- Competitive Substitutes: Smart TVs and dedicated streaming devices pose competitive challenges.
- End-User Demographics: Primarily tech-savvy consumers aged 25-55, with growing adoption across age groups.
- M&A Activity: Approximately XX merger & acquisition deals from 2019-2024.
Digital Media Adaptor Growth Trends & Insights
The Digital Media Adaptor market demonstrates robust growth, exhibiting a CAGR of XX% during the forecast period (2025-2033). Market size is projected to reach $XX billion by 2033. This growth is fueled by increasing penetration of streaming services, rising demand for high-definition content, and the proliferation of smart home devices. Technological disruptions, such as the shift towards cloud-based streaming and the adoption of AI-powered features, are reshaping consumer preferences. Consumers are increasingly prioritizing seamless user experiences, advanced features, and versatile connectivity options. Market penetration is expected to reach XX% by 2033, driven by factors including affordability, improved user interfaces, and expanding internet access globally.
Dominant Regions, Countries, or Segments in Digital Media Adaptor
North America currently dominates the Digital Media Adaptor market, holding a XX% market share in 2025. This dominance is attributed to factors such as high internet penetration, strong consumer spending power, and the presence of major technology companies. Europe and Asia-Pacific are expected to witness significant growth during the forecast period, driven by increasing internet and smartphone adoption, growing middle-class populations, and favorable government policies promoting digital transformation.
- North America: High internet penetration, strong consumer spending, and presence of major technology companies fuel its dominance.
- Europe: Growing internet and smartphone adoption are driving market expansion.
- Asia-Pacific: Rapid economic growth and expanding middle-class contribute to strong growth potential.
- Market Share (2025): North America (XX%), Europe (XX%), Asia-Pacific (XX%), Rest of World (XX%).
Digital Media Adaptor Product Landscape
Digital Media Adapters are evolving to integrate advanced features like 8K resolution support, high dynamic range (HDR), and improved Wi-Fi capabilities. They cater to various applications including streaming movies and TV shows, gaming, and accessing online content. Key performance indicators include data transfer speeds, latency, and compatibility with various devices and platforms. Unique selling propositions focus on ease of use, seamless integration with existing ecosystems, and support for the latest audio-visual technologies. Advancements in chipsets are improving processing power and energy efficiency.
Key Drivers, Barriers & Challenges in Digital Media Adaptor
Key Drivers:
- Growing adoption of streaming services.
- Increasing demand for high-resolution content (4K, 8K).
- Proliferation of smart home devices and connected ecosystems.
- Advancements in wireless technologies (Wi-Fi 6E, Bluetooth 5).
Challenges & Restraints:
- Competition from integrated smart TVs and streaming sticks.
- Potential supply chain disruptions impacting component availability.
- Regulatory hurdles and data privacy concerns.
- Price sensitivity in emerging markets.
Emerging Opportunities in Digital Media Adaptor
Emerging opportunities lie in expanding into untapped markets with limited internet infrastructure, developing compact and energy-efficient adapters, and integrating advanced features like AI-powered content recommendations and personalized user experiences. Focus on developing adapters catering to niche markets, like VR/AR integration and professional audio-visual applications, also presents significant growth potential.
Growth Accelerators in the Digital Media Adaptor Industry
Long-term growth will be accelerated by continued technological innovation in streaming technologies, strategic partnerships between content providers and device manufacturers, and expansion into new geographical markets. The development of cost-effective adapters for emerging markets will also play a crucial role.
Notable Milestones in Digital Media Adaptor Sector
- 2020: Introduction of Wi-Fi 6E enabled adapters by several key players.
- 2021: Launch of the first 8K resolution supporting digital media adapters.
- 2022: Significant increase in M&A activity within the sector, consolidating market share.
- 2023: Several key players introduced AI-powered content recommendation features.
- 2024: Increased focus on energy efficiency and sustainable manufacturing practices.
In-Depth Digital Media Adaptor Market Outlook
The Digital Media Adaptor market is poised for sustained growth driven by ongoing technological advancements, increased consumer demand for high-quality content, and expanding internet accessibility. Strategic opportunities exist in developing innovative product features, forming strategic partnerships, and penetrating emerging markets. The focus on creating user-friendly and energy-efficient products will remain crucial for market success. The market presents a positive outlook with considerable growth potential in the coming years.
Digital Media Adaptor Segmentation
-
1. Application
- 1.1. TV
- 1.2. Computer
- 1.3. Phone
- 1.4. Media Player
-
2. Types
- 2.1. Wired Connection
- 2.2. Wireless Connection
Digital Media Adaptor Segmentation By Geography
-
1. North America
- 1.1. United States
- 1.2. Canada
- 1.3. Mexico
-
2. South America
- 2.1. Brazil
- 2.2. Argentina
- 2.3. Rest of South America
-
3. Europe
- 3.1. United Kingdom
- 3.2. Germany
- 3.3. France
- 3.4. Italy
- 3.5. Spain
- 3.6. Russia
- 3.7. Benelux
- 3.8. Nordics
- 3.9. Rest of Europe
-
4. Middle East & Africa
- 4.1. Turkey
- 4.2. Israel
- 4.3. GCC
- 4.4. North Africa
- 4.5. South Africa
- 4.6. Rest of Middle East & Africa
-
5. Asia Pacific
- 5.1. China
- 5.2. India
- 5.3. Japan
- 5.4. South Korea
- 5.5. ASEAN
- 5.6. Oceania
- 5.7. Rest of Asia Pacific
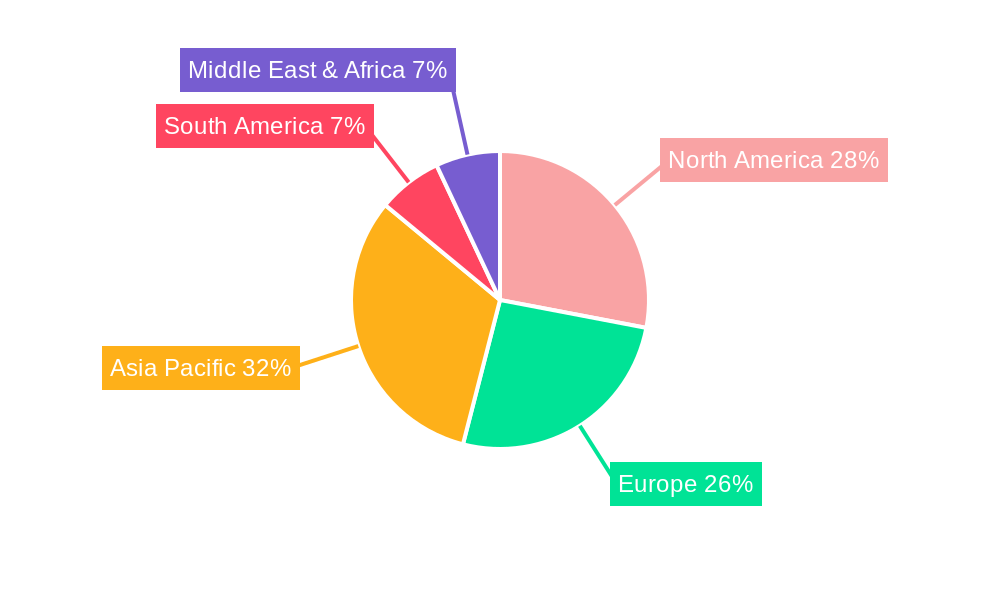
Digital Media Adaptor Regional Market Share
Geographic Coverage of Digital Media Adaptor
Digital Media Adaptor REPORT HIGHLIGHTS
| Aspects | Details |
|---|---|
| Study Period | 2020-2034 |
| Base Year | 2025 |
| Estimated Year | 2026 |
| Forecast Period | 2026-2034 |
| Historical Period | 2020-2025 |
| Growth Rate | CAGR of XX% from 2020-2034 |
| Segmentation |
|
Table of Contents
- 1. Introduction
- 1.1. Research Scope
- 1.2. Market Segmentation
- 1.3. Research Objective
- 1.4. Definitions and Assumptions
- 2. Executive Summary
- 2.1. Market Snapshot
- 3. Market Dynamics
- 3.1. Market Drivers
- 3.2. Market Restrains
- 3.3. Market Trends
- 3.4. Market Opportunities
- 4. Market Factor Analysis
- 4.1. Porters Five Forces
- 4.1.1. Bargaining Power of Suppliers
- 4.1.2. Bargaining Power of Buyers
- 4.1.3. Threat of New Entrants
- 4.1.4. Threat of Substitutes
- 4.1.5. Competitive Rivalry
- 4.2. PESTEL analysis
- 4.3. BCG Analysis
- 4.3.1. Stars (High Growth, High Market Share)
- 4.3.2. Cash Cows (Low Growth, High Market Share)
- 4.3.3. Question Mark (High Growth, Low Market Share)
- 4.3.4. Dogs (Low Growth, Low Market Share)
- 4.4. Ansoff Matrix Analysis
- 4.5. Supply Chain Analysis
- 4.6. Regulatory Landscape
- 4.7. Current Market Potential and Opportunity Assessment (TAM–SAM–SOM Framework)
- 4.8. VDR Analyst Note
- 4.1. Porters Five Forces
- 5. Market Analysis, Insights and Forecast 2021-2033
- 5.1. Market Analysis, Insights and Forecast - by Application
- 5.1.1. TV
- 5.1.2. Computer
- 5.1.3. Phone
- 5.1.4. Media Player
- 5.2. Market Analysis, Insights and Forecast - by Types
- 5.2.1. Wired Connection
- 5.2.2. Wireless Connection
- 5.3. Market Analysis, Insights and Forecast - by Region
- 5.3.1. North America
- 5.3.2. South America
- 5.3.3. Europe
- 5.3.4. Middle East & Africa
- 5.3.5. Asia Pacific
- 5.1. Market Analysis, Insights and Forecast - by Application
- 6. Global Digital Media Adaptor Analysis, Insights and Forecast, 2021-2033
- 6.1. Market Analysis, Insights and Forecast - by Application
- 6.1.1. TV
- 6.1.2. Computer
- 6.1.3. Phone
- 6.1.4. Media Player
- 6.2. Market Analysis, Insights and Forecast - by Types
- 6.2.1. Wired Connection
- 6.2.2. Wireless Connection
- 6.1. Market Analysis, Insights and Forecast - by Application
- 7. North America Digital Media Adaptor Analysis, Insights and Forecast, 2021-2033
- 7.1. Market Analysis, Insights and Forecast - by Application
- 7.1.1. TV
- 7.1.2. Computer
- 7.1.3. Phone
- 7.1.4. Media Player
- 7.2. Market Analysis, Insights and Forecast - by Types
- 7.2.1. Wired Connection
- 7.2.2. Wireless Connection
- 7.1. Market Analysis, Insights and Forecast - by Application
- 8. South America Digital Media Adaptor Analysis, Insights and Forecast, 2021-2033
- 8.1. Market Analysis, Insights and Forecast - by Application
- 8.1.1. TV
- 8.1.2. Computer
- 8.1.3. Phone
- 8.1.4. Media Player
- 8.2. Market Analysis, Insights and Forecast - by Types
- 8.2.1. Wired Connection
- 8.2.2. Wireless Connection
- 8.1. Market Analysis, Insights and Forecast - by Application
- 9. Europe Digital Media Adaptor Analysis, Insights and Forecast, 2021-2033
- 9.1. Market Analysis, Insights and Forecast - by Application
- 9.1.1. TV
- 9.1.2. Computer
- 9.1.3. Phone
- 9.1.4. Media Player
- 9.2. Market Analysis, Insights and Forecast - by Types
- 9.2.1. Wired Connection
- 9.2.2. Wireless Connection
- 9.1. Market Analysis, Insights and Forecast - by Application
- 10. Middle East & Africa Digital Media Adaptor Analysis, Insights and Forecast, 2021-2033
- 10.1. Market Analysis, Insights and Forecast - by Application
- 10.1.1. TV
- 10.1.2. Computer
- 10.1.3. Phone
- 10.1.4. Media Player
- 10.2. Market Analysis, Insights and Forecast - by Types
- 10.2.1. Wired Connection
- 10.2.2. Wireless Connection
- 10.1. Market Analysis, Insights and Forecast - by Application
- 11. Asia Pacific Digital Media Adaptor Analysis, Insights and Forecast, 2021-2033
- 11.1. Market Analysis, Insights and Forecast - by Application
- 11.1.1. TV
- 11.1.2. Computer
- 11.1.3. Phone
- 11.1.4. Media Player
- 11.2. Market Analysis, Insights and Forecast - by Types
- 11.2.1. Wired Connection
- 11.2.2. Wireless Connection
- 11.1. Market Analysis, Insights and Forecast - by Application
- 12. Competitive Analysis
- 12.1. Company Profiles
- 12.1.1 Apple
- 12.1.1.1. Company Overview
- 12.1.1.2. Products
- 12.1.1.3. Company Financials
- 12.1.1.4. SWOT Analysis
- 12.1.2 Google
- 12.1.2.1. Company Overview
- 12.1.2.2. Products
- 12.1.2.3. Company Financials
- 12.1.2.4. SWOT Analysis
- 12.1.3 Microsoft
- 12.1.3.1. Company Overview
- 12.1.3.2. Products
- 12.1.3.3. Company Financials
- 12.1.3.4. SWOT Analysis
- 12.1.4 Cisco
- 12.1.4.1. Company Overview
- 12.1.4.2. Products
- 12.1.4.3. Company Financials
- 12.1.4.4. SWOT Analysis
- 12.1.5 Netgear
- 12.1.5.1. Company Overview
- 12.1.5.2. Products
- 12.1.5.3. Company Financials
- 12.1.5.4. SWOT Analysis
- 12.1.6 Seagate
- 12.1.6.1. Company Overview
- 12.1.6.2. Products
- 12.1.6.3. Company Financials
- 12.1.6.4. SWOT Analysis
- 12.1.7 Western Digital
- 12.1.7.1. Company Overview
- 12.1.7.2. Products
- 12.1.7.3. Company Financials
- 12.1.7.4. SWOT Analysis
- 12.1.8 Sony
- 12.1.8.1. Company Overview
- 12.1.8.2. Products
- 12.1.8.3. Company Financials
- 12.1.8.4. SWOT Analysis
- 12.1.9 Samsung
- 12.1.9.1. Company Overview
- 12.1.9.2. Products
- 12.1.9.3. Company Financials
- 12.1.9.4. SWOT Analysis
- 12.1.10 Archos
- 12.1.10.1. Company Overview
- 12.1.10.2. Products
- 12.1.10.3. Company Financials
- 12.1.10.4. SWOT Analysis
- 12.1.11 Roku
- 12.1.11.1. Company Overview
- 12.1.11.2. Products
- 12.1.11.3. Company Financials
- 12.1.11.4. SWOT Analysis
- 12.1.12 ZyXEL Communications
- 12.1.12.1. Company Overview
- 12.1.12.2. Products
- 12.1.12.3. Company Financials
- 12.1.12.4. SWOT Analysis
- 12.1.13 Dolby
- 12.1.13.1. Company Overview
- 12.1.13.2. Products
- 12.1.13.3. Company Financials
- 12.1.13.4. SWOT Analysis
- 12.1.1 Apple
- 12.2. Market Entropy
- 12.2.1 Company's Key Areas Served
- 12.2.2 Recent Developments
- 12.3. Company Market Share Analysis 2025
- 12.3.1 Top 5 Companies Market Share Analysis
- 12.3.2 Top 3 Companies Market Share Analysis
- 12.4. List of Potential Customers
- 13. Research Methodology
List of Figures
- Figure 1: Global Digital Media Adaptor Revenue Breakdown (million, %) by Region 2025 & 2033
- Figure 2: North America Digital Media Adaptor Revenue (million), by Application 2025 & 2033
- Figure 3: North America Digital Media Adaptor Revenue Share (%), by Application 2025 & 2033
- Figure 4: North America Digital Media Adaptor Revenue (million), by Types 2025 & 2033
- Figure 5: North America Digital Media Adaptor Revenue Share (%), by Types 2025 & 2033
- Figure 6: North America Digital Media Adaptor Revenue (million), by Country 2025 & 2033
- Figure 7: North America Digital Media Adaptor Revenue Share (%), by Country 2025 & 2033
- Figure 8: South America Digital Media Adaptor Revenue (million), by Application 2025 & 2033
- Figure 9: South America Digital Media Adaptor Revenue Share (%), by Application 2025 & 2033
- Figure 10: South America Digital Media Adaptor Revenue (million), by Types 2025 & 2033
- Figure 11: South America Digital Media Adaptor Revenue Share (%), by Types 2025 & 2033
- Figure 12: South America Digital Media Adaptor Revenue (million), by Country 2025 & 2033
- Figure 13: South America Digital Media Adaptor Revenue Share (%), by Country 2025 & 2033
- Figure 14: Europe Digital Media Adaptor Revenue (million), by Application 2025 & 2033
- Figure 15: Europe Digital Media Adaptor Revenue Share (%), by Application 2025 & 2033
- Figure 16: Europe Digital Media Adaptor Revenue (million), by Types 2025 & 2033
- Figure 17: Europe Digital Media Adaptor Revenue Share (%), by Types 2025 & 2033
- Figure 18: Europe Digital Media Adaptor Revenue (million), by Country 2025 & 2033
- Figure 19: Europe Digital Media Adaptor Revenue Share (%), by Country 2025 & 2033
- Figure 20: Middle East & Africa Digital Media Adaptor Revenue (million), by Application 2025 & 2033
- Figure 21: Middle East & Africa Digital Media Adaptor Revenue Share (%), by Application 2025 & 2033
- Figure 22: Middle East & Africa Digital Media Adaptor Revenue (million), by Types 2025 & 2033
- Figure 23: Middle East & Africa Digital Media Adaptor Revenue Share (%), by Types 2025 & 2033
- Figure 24: Middle East & Africa Digital Media Adaptor Revenue (million), by Country 2025 & 2033
- Figure 25: Middle East & Africa Digital Media Adaptor Revenue Share (%), by Country 2025 & 2033
- Figure 26: Asia Pacific Digital Media Adaptor Revenue (million), by Application 2025 & 2033
- Figure 27: Asia Pacific Digital Media Adaptor Revenue Share (%), by Application 2025 & 2033
- Figure 28: Asia Pacific Digital Media Adaptor Revenue (million), by Types 2025 & 2033
- Figure 29: Asia Pacific Digital Media Adaptor Revenue Share (%), by Types 2025 & 2033
- Figure 30: Asia Pacific Digital Media Adaptor Revenue (million), by Country 2025 & 2033
- Figure 31: Asia Pacific Digital Media Adaptor Revenue Share (%), by Country 2025 & 2033
List of Tables
- Table 1: Global Digital Media Adaptor Revenue million Forecast, by Application 2020 & 2033
- Table 2: Global Digital Media Adaptor Revenue million Forecast, by Types 2020 & 2033
- Table 3: Global Digital Media Adaptor Revenue million Forecast, by Region 2020 & 2033
- Table 4: Global Digital Media Adaptor Revenue million Forecast, by Application 2020 & 2033
- Table 5: Global Digital Media Adaptor Revenue million Forecast, by Types 2020 & 2033
- Table 6: Global Digital Media Adaptor Revenue million Forecast, by Country 2020 & 2033
- Table 7: United States Digital Media Adaptor Revenue (million) Forecast, by Application 2020 & 2033
- Table 8: Canada Digital Media Adaptor Revenue (million) Forecast, by Application 2020 & 2033
- Table 9: Mexico Digital Media Adaptor Revenue (million) Forecast, by Application 2020 & 2033
- Table 10: Global Digital Media Adaptor Revenue million Forecast, by Application 2020 & 2033
- Table 11: Global Digital Media Adaptor Revenue million Forecast, by Types 2020 & 2033
- Table 12: Global Digital Media Adaptor Revenue million Forecast, by Country 2020 & 2033
- Table 13: Brazil Digital Media Adaptor Revenue (million) Forecast, by Application 2020 & 2033
- Table 14: Argentina Digital Media Adaptor Revenue (million) Forecast, by Application 2020 & 2033
- Table 15: Rest of South America Digital Media Adaptor Revenue (million) Forecast, by Application 2020 & 2033
- Table 16: Global Digital Media Adaptor Revenue million Forecast, by Application 2020 & 2033
- Table 17: Global Digital Media Adaptor Revenue million Forecast, by Types 2020 & 2033
- Table 18: Global Digital Media Adaptor Revenue million Forecast, by Country 2020 & 2033
- Table 19: United Kingdom Digital Media Adaptor Revenue (million) Forecast, by Application 2020 & 2033
- Table 20: Germany Digital Media Adaptor Revenue (million) Forecast, by Application 2020 & 2033
- Table 21: France Digital Media Adaptor Revenue (million) Forecast, by Application 2020 & 2033
- Table 22: Italy Digital Media Adaptor Revenue (million) Forecast, by Application 2020 & 2033
- Table 23: Spain Digital Media Adaptor Revenue (million) Forecast, by Application 2020 & 2033
- Table 24: Russia Digital Media Adaptor Revenue (million) Forecast, by Application 2020 & 2033
- Table 25: Benelux Digital Media Adaptor Revenue (million) Forecast, by Application 2020 & 2033
- Table 26: Nordics Digital Media Adaptor Revenue (million) Forecast, by Application 2020 & 2033
- Table 27: Rest of Europe Digital Media Adaptor Revenue (million) Forecast, by Application 2020 & 2033
- Table 28: Global Digital Media Adaptor Revenue million Forecast, by Application 2020 & 2033
- Table 29: Global Digital Media Adaptor Revenue million Forecast, by Types 2020 & 2033
- Table 30: Global Digital Media Adaptor Revenue million Forecast, by Country 2020 & 2033
- Table 31: Turkey Digital Media Adaptor Revenue (million) Forecast, by Application 2020 & 2033
- Table 32: Israel Digital Media Adaptor Revenue (million) Forecast, by Application 2020 & 2033
- Table 33: GCC Digital Media Adaptor Revenue (million) Forecast, by Application 2020 & 2033
- Table 34: North Africa Digital Media Adaptor Revenue (million) Forecast, by Application 2020 & 2033
- Table 35: South Africa Digital Media Adaptor Revenue (million) Forecast, by Application 2020 & 2033
- Table 36: Rest of Middle East & Africa Digital Media Adaptor Revenue (million) Forecast, by Application 2020 & 2033
- Table 37: Global Digital Media Adaptor Revenue million Forecast, by Application 2020 & 2033
- Table 38: Global Digital Media Adaptor Revenue million Forecast, by Types 2020 & 2033
- Table 39: Global Digital Media Adaptor Revenue million Forecast, by Country 2020 & 2033
- Table 40: China Digital Media Adaptor Revenue (million) Forecast, by Application 2020 & 2033
- Table 41: India Digital Media Adaptor Revenue (million) Forecast, by Application 2020 & 2033
- Table 42: Japan Digital Media Adaptor Revenue (million) Forecast, by Application 2020 & 2033
- Table 43: South Korea Digital Media Adaptor Revenue (million) Forecast, by Application 2020 & 2033
- Table 44: ASEAN Digital Media Adaptor Revenue (million) Forecast, by Application 2020 & 2033
- Table 45: Oceania Digital Media Adaptor Revenue (million) Forecast, by Application 2020 & 2033
- Table 46: Rest of Asia Pacific Digital Media Adaptor Revenue (million) Forecast, by Application 2020 & 2033
Frequently Asked Questions
1. What is the projected Compound Annual Growth Rate (CAGR) of the Digital Media Adaptor?
The projected CAGR is approximately XX%.
2. Which companies are prominent players in the Digital Media Adaptor?
Key companies in the market include Apple, Google, Microsoft, Cisco, Netgear, Seagate, Western Digital, Sony, Samsung, Archos, Roku, ZyXEL Communications, Dolby.
3. What are the main segments of the Digital Media Adaptor?
The market segments include Application, Types.
4. Can you provide details about the market size?
The market size is estimated to be USD XXX million as of 2022.
5. What are some drivers contributing to market growth?
N/A
6. What are the notable trends driving market growth?
N/A
7. Are there any restraints impacting market growth?
N/A
8. Can you provide examples of recent developments in the market?
N/A
9. What pricing options are available for accessing the report?
Pricing options include single-user, multi-user, and enterprise licenses priced at USD 4900.00, USD 7350.00, and USD 9800.00 respectively.
10. Is the market size provided in terms of value or volume?
The market size is provided in terms of value, measured in million.
11. Are there any specific market keywords associated with the report?
Yes, the market keyword associated with the report is "Digital Media Adaptor," which aids in identifying and referencing the specific market segment covered.
12. How do I determine which pricing option suits my needs best?
The pricing options vary based on user requirements and access needs. Individual users may opt for single-user licenses, while businesses requiring broader access may choose multi-user or enterprise licenses for cost-effective access to the report.
13. Are there any additional resources or data provided in the Digital Media Adaptor report?
While the report offers comprehensive insights, it's advisable to review the specific contents or supplementary materials provided to ascertain if additional resources or data are available.
14. How can I stay updated on further developments or reports in the Digital Media Adaptor?
To stay informed about further developments, trends, and reports in the Digital Media Adaptor, consider subscribing to industry newsletters, following relevant companies and organizations, or regularly checking reputable industry news sources and publications.
Methodology
Step 1 - Identification of Relevant Samples Size from Population Database


Step 2 - Approaches for Defining Global Market Size (Value, Volume* & Price*)

Note*: In applicable scenarios
Step 3 - Data Sources
Primary Research
- Web Analytics
- Survey Reports
- Research Institute
- Latest Research Reports
- Opinion Leaders
Secondary Research
- Annual Reports
- White Paper
- Latest Press Release
- Industry Association
- Paid Database
- Investor Presentations

Step 4 - Data Triangulation
Involves using different sources of information in order to increase the validity of a study
These sources are likely to be stakeholders in a program - participants, other researchers, program staff, other community members, and so on.
Then we put all data in single framework & apply various statistical tools to find out the dynamic on the market.
During the analysis stage, feedback from the stakeholder groups would be compared to determine areas of agreement as well as areas of divergence