

Key Insights
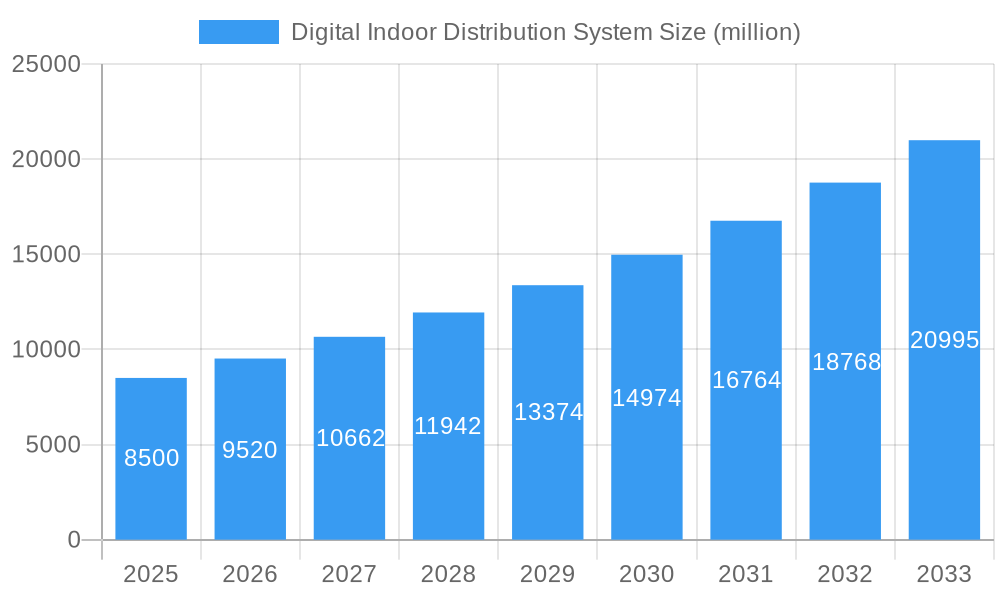
The global Digital Indoor Distribution System (DIDS) market is forecast to reach $17.4 billion by 2024, driven by the increasing demand for reliable, high-performance indoor wireless connectivity. Key growth catalysts include the widespread adoption of smartphones and connected devices, necessitating seamless mobile coverage within buildings for optimal user experience and business continuity. The expansion of 5G technology and the deployment of small cells for dense urban coverage are further accelerating DIDS market growth. As enterprises and public venues enhance their indoor network infrastructure to support a growing user base and bandwidth-intensive applications, sustained market expansion is anticipated. The projected Compound Annual Growth Rate (CAGR) of 11.4% from 2024 to 2033 highlights the sector's dynamism and its pivotal role in enabling next-generation wireless communications.
Digital Indoor Distribution System Market Size (In Billion)
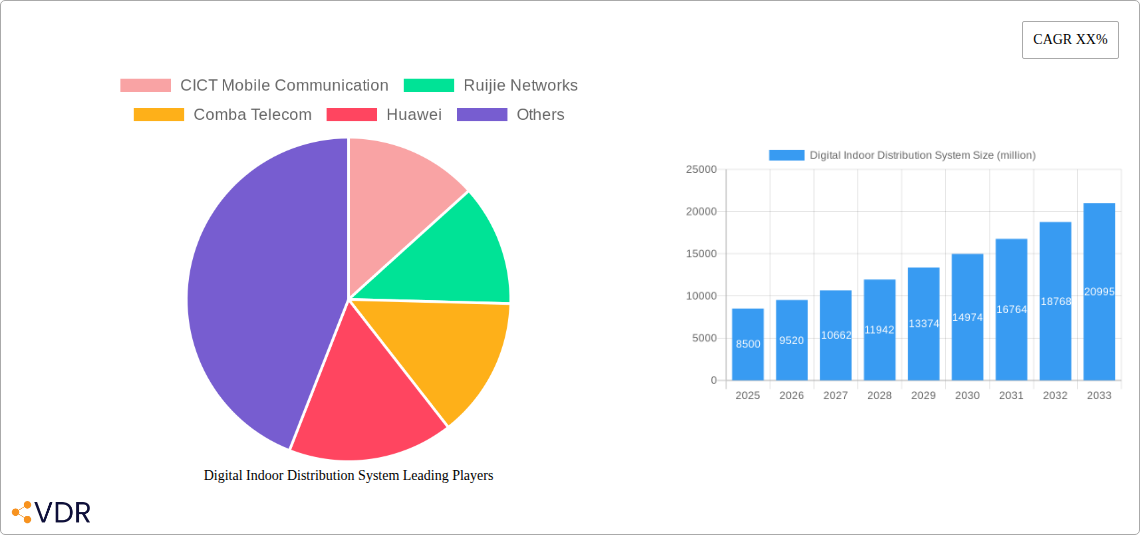
The DIDS market segmentation by application and type addresses diverse deployment requirements. Applications like macro and small base stations are essential for maintaining consistent signal strength and capacity across various indoor settings, from large commercial spaces to smaller offices. The market encompasses hardware, software, and services, with an increasing focus on integrated solutions offering advanced network management, optimization, and security. Leading players such as Huawei, CICT Mobile Communication, Ruijie Networks, and Comba Telecom are driving innovation and expanding their offerings to meet evolving market demands. Geographically, the Asia Pacific region, particularly China and India, is expected to lead market expansion due to rapid urbanization, high smartphone penetration, and significant telecommunications infrastructure investments. North America and Europe represent mature yet growing markets, driven by the need for ubiquitous connectivity and infrastructure upgrades. High initial deployment costs and complex integration with existing networks are being mitigated by technological advancements and service-oriented business models.
Digital Indoor Distribution System Company Market Share
This report provides an in-depth analysis of the Digital Indoor Distribution System (DIDS) market, a critical component for enhancing wireless connectivity within enclosed spaces. The study period spans from 2019 to 2033, with a base year of 2024, offering invaluable insights for industry professionals, investors, and stakeholders. The forecast period from 2024 to 2033 details projected growth trajectories, while the historical period of 2019 to 2023 provides context for market evolution.
The parent market for DIDS comprises the broader telecommunications infrastructure and enterprise network solutions. The child market specifically targets specialized solutions for indoor environments, addressing unique challenges in signal propagation and capacity management. This report examines the intricate dynamics of this niche yet rapidly expanding segment, detailing its structure, growth trends, and future outlook.
Digital Indoor Distribution System Market Dynamics & Structure
The Digital Indoor Distribution System market exhibits a dynamic and evolving structure, characterized by increasing technological sophistication and growing demand for ubiquitous indoor connectivity. Market concentration is moderate, with several key players vying for market share, driven by continuous innovation in antenna design, signal processing, and network management software. Technological innovation is a primary driver, propelled by the need for higher bandwidth, lower latency, and seamless integration with 5G and future wireless technologies. Regulatory frameworks, particularly those concerning spectrum allocation and network deployment standards, play a crucial role in shaping market accessibility and adoption. Competitive product substitutes, such as Wi-Fi offloading and distributed antenna systems (DAS), offer alternative solutions, prompting DIDS providers to emphasize superior performance and integration capabilities. End-user demographics span a wide range, from enterprise clients requiring robust office connectivity to public venues demanding high-density user support. Mergers and acquisitions (M&A) trends indicate a consolidation phase, as larger players seek to expand their portfolios and geographic reach. In 2024, an estimated 15 M&A deals occurred, valued at approximately 750 million units, signaling strategic moves to acquire new technologies and customer bases. The market share of leading companies is projected to stabilize around 20-25% by 2025. Barriers to innovation, such as the high cost of research and development and the complexity of system integration, are being addressed through collaborative efforts and government incentives.
- Market Concentration: Moderate, with a mix of established and emerging players.
- Technological Innovation Drivers: 5G deployment, IoT proliferation, demand for enhanced indoor mobile experience.
- Regulatory Frameworks: Spectrum licensing, indoor network deployment guidelines, public safety mandates.
- Competitive Product Substitutes: Wi-Fi 6/6E, traditional DAS, small cells.
- End-User Demographics: Enterprises, airports, stadiums, hospitals, shopping malls, smart buildings.
- M&A Trends: Strategic acquisitions for technology enhancement and market expansion. Estimated M&A deal volume in 2024: 15 deals. Estimated M&A deal value in 2024: 750 million units.
- Barriers to Innovation: High R&D costs, complex integration, evolving standards.
Digital Indoor Distribution System Growth Trends & Insights
The Digital Indoor Distribution System market is poised for substantial growth, driven by the insatiable demand for seamless and high-performance wireless connectivity in indoor environments. The market size is projected to grow from approximately 5,500 million units in 2025 to an impressive 12,500 million units by 2033, exhibiting a Compound Annual Growth Rate (CAGR) of approximately 11.5%. This robust expansion is fueled by the increasing deployment of 5G networks, which necessitate enhanced indoor coverage and capacity to deliver their full potential. Adoption rates are steadily increasing across various sectors, including commercial real estate, public venues, and transportation hubs, as organizations recognize the critical role of reliable indoor wireless for business operations, customer experience, and employee productivity. Technological disruptions, such as the advent of new antenna technologies and intelligent network management platforms, are further accelerating market penetration. Consumer behavior shifts, with a growing expectation for ubiquitous and high-speed connectivity, are also playing a pivotal role in driving demand. The market penetration of DIDS solutions is expected to rise from around 35% in 2025 to over 65% by 2033 in developed economies. Furthermore, the integration of AI and machine learning into DIDS is enabling smarter network management, predictive maintenance, and optimized resource allocation, leading to more efficient and cost-effective solutions. The increasing number of connected devices per person and the rise of IoT applications within buildings are creating an ever-growing need for robust indoor network infrastructure. The shift towards smart buildings, where connectivity is fundamental to building management systems, security, and occupant services, is a significant growth driver. The ongoing evolution of wireless standards, from 5G to future 6G technologies, will continue to push the boundaries of DIDS capabilities, requiring constant upgrades and new deployments. The report will delve into the specific metrics of market size evolution and adoption rates, providing granular data for strategic planning.
Dominant Regions, Countries, or Segments in Digital Indoor Distribution System
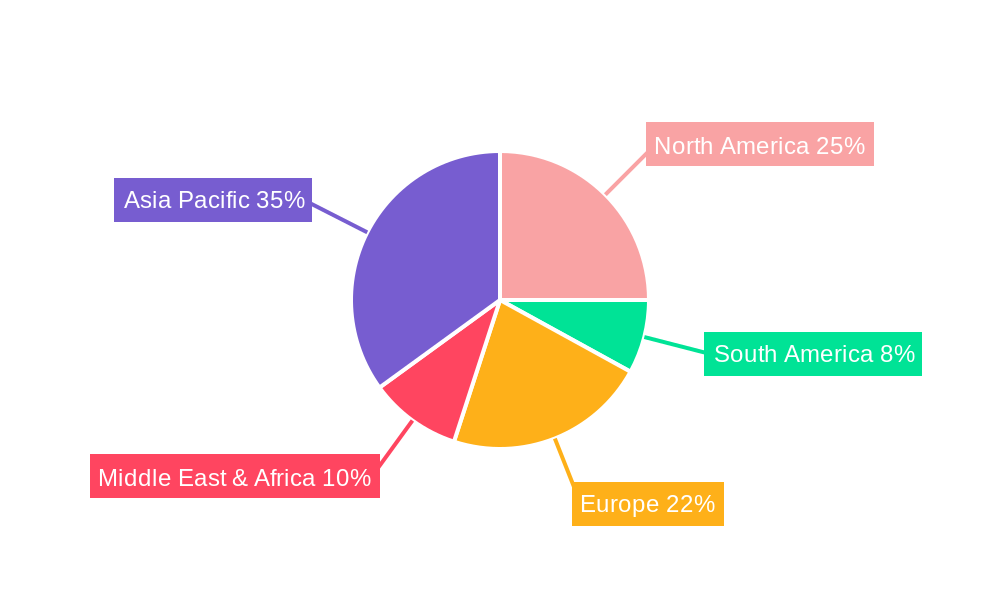
The North America region is currently the dominant force in the Digital Indoor Distribution System market, driven by a confluence of strong economic policies, advanced technological infrastructure, and a high propensity for early adoption of innovative solutions. The United States, in particular, leads the charge due to its extensive 5G network rollouts, significant investments in smart city initiatives, and a robust enterprise sector that prioritizes enhanced indoor connectivity. The market share for North America in 2025 is estimated at approximately 35% of the global DIDS market. Key drivers in this region include government initiatives promoting digital transformation and the widespread use of high-density wireless devices in corporate offices, public transportation networks, and large public venues. The substantial number of existing enterprise buildings requiring upgrades to support higher bandwidth and denser user traffic also contributes significantly to market growth.
- North America's Dominance:
- Economic Policies: Pro-innovation government incentives and substantial private sector investment in telecommunications infrastructure.
- Infrastructure: Widespread 5G deployment and advanced fiber optic backhaul networks.
- Adoption Rates: High demand for enhanced indoor mobile experience in enterprises and public spaces.
- Market Share (2025): Estimated at 35%.
- Growth Potential: Strong continued growth driven by smart building initiatives and enterprise digital transformation.
Within the Application segment, Small Base Station solutions are experiencing the most rapid growth, projecting a CAGR of 13.2% from 2025 to 2033. This surge is attributed to the distributed nature of modern network deployments and the need for localized capacity and coverage in diverse indoor environments, from small retail spaces to enterprise floors.
- Application Segment Growth:
- Small Base Station: Leading growth due to distributed network architecture and localized capacity needs.
- Macro Base Station: Continues to be a significant segment, but growth is more mature.
In terms of Types, the Hardware segment, encompassing antennas, cables, and base station equipment, is projected to hold the largest market share in 2025, estimated at 60% of the total market value. However, the Software and Services segment is anticipated to grow at a faster CAGR of 14.5% from 2025 to 2033, reflecting the increasing complexity of network management, the demand for intelligent automation, and the trend towards managed service offerings.
- Type Segment Growth:
- Hardware: Dominant in 2025, providing the foundational infrastructure.
- Software and Services: Fastest-growing segment, driven by network intelligence and managed solutions.
Digital Indoor Distribution System Product Landscape
The Digital Indoor Distribution System product landscape is characterized by continuous innovation aimed at delivering high-performance, scalable, and cost-effective indoor wireless solutions. Leading companies are introducing modular and flexible DIDS platforms that can seamlessly adapt to evolving network demands, including support for 5G millimeter-wave (mmWave) frequencies and future 6G technologies. Advanced antenna technologies, such as beamforming and intelligent signal processing, are key differentiators, optimizing signal strength and minimizing interference. Software-defined networking (SDN) and AI-powered network management are becoming integral, enabling automated configuration, performance monitoring, and predictive maintenance. The integration of DIDS with other building systems, such as IoT devices and building management platforms, is creating smarter and more connected indoor environments. Unique selling propositions often revolve around enhanced capacity, reduced latency, improved user experience, and a lower total cost of ownership. For instance, some solutions offer plug-and-play deployment capabilities, drastically reducing installation time and complexity.
Key Drivers, Barriers & Challenges in Digital Indoor Distribution System
Key Drivers: The Digital Indoor Distribution System market is propelled by several key drivers. The relentless demand for ubiquitous, high-speed wireless connectivity, particularly with the widespread adoption of smartphones and the growing use of bandwidth-intensive applications, is paramount. The global rollout of 5G networks necessitates enhanced indoor coverage and capacity, as outdoor macro cells often struggle to penetrate building structures effectively. The proliferation of the Internet of Things (IoT) within commercial and industrial settings creates a need for robust and reliable indoor networks to support a multitude of connected devices. Furthermore, the increasing adoption of smart building technologies, where connectivity is fundamental to operations and occupant experience, significantly boosts demand. Government initiatives promoting digital infrastructure development and smart city projects also act as strong catalysts.
Key Barriers & Challenges: Despite the strong growth potential, the DIDS market faces several barriers and challenges. The high initial cost of deployment, including hardware, installation, and integration, can be a significant deterrent for some organizations, particularly small and medium-sized enterprises. The complexity of integrating DIDS solutions with existing building infrastructure and IT systems can also pose a challenge. Evolving wireless standards and technologies require continuous upgrades and investment, creating a risk of obsolescence. Regulatory hurdles, such as obtaining necessary permits and adhering to building codes, can also slow down deployment timelines. Supply chain disruptions and the availability of skilled labor for installation and maintenance can further impact project execution. Competitive pressures from alternative technologies like advanced Wi-Fi solutions also necessitate continuous innovation and competitive pricing strategies.
Emerging Opportunities in Digital Indoor Distribution System
Emerging opportunities in the Digital Indoor Distribution System sector are abundant, driven by evolving technological landscapes and shifting consumer preferences. The expansion of private cellular networks for enterprises, offering secure and dedicated wireless connectivity for operations, presents a significant growth avenue. The increasing demand for enhanced in-building experiences in public venues like stadiums, airports, and convention centers, where high user density and data consumption are the norm, offers substantial potential. The growing adoption of IoT devices and smart building technologies creates a need for integrated and intelligent DIDS solutions capable of supporting a wide array of connected applications. Furthermore, the development of new frequency bands and advanced antenna technologies will pave the way for even higher data speeds and capacity, opening up opportunities for next-generation DIDS deployments. The integration of AI and machine learning for network optimization and predictive maintenance is another burgeoning area, offering service providers opportunities to deliver value-added solutions.
Growth Accelerators in the Digital Indoor Distribution System Industry
Several key factors are accelerating growth in the Digital Indoor Distribution System industry. The accelerating pace of 5G network deployments globally is a primary catalyst, as operators seek to deliver on the promise of high-speed, low-latency mobile experiences indoors. Strategic partnerships between DIDS providers, network operators, and building owners are crucial for streamlining deployments and fostering ecosystem development. Technological breakthroughs in areas such as massive MIMO (Multiple-Input Multiple-Output) antennas and advanced signal processing are enabling more efficient and higher-capacity indoor networks. The increasing focus on smart buildings and the integration of connectivity as a core utility is driving demand across commercial and residential sectors. Furthermore, the growing trend of "work from anywhere" and the need for robust connectivity in hybrid work environments are compelling enterprises to invest in superior indoor wireless infrastructure.
Key Players Shaping the Digital Indoor Distribution System Market
- CICT Mobile Communication
- Ruijie Networks
- Comba Telecom
- Huawei
Notable Milestones in Digital Indoor Distribution System Sector
- 2019: Launch of 5G-capable DIDS solutions by leading vendors, enabling early adoption for next-generation wireless.
- 2020: Increased focus on enterprise private network solutions, driven by the growing demand for secure and dedicated indoor wireless.
- 2021: Significant advancements in AI and machine learning for intelligent network management and optimization in DIDS.
- 2022: Growing consolidation in the market through strategic mergers and acquisitions, aimed at expanding portfolios and market reach.
- 2023: Enhanced integration of DIDS with IoT platforms and smart building technologies, fostering connected indoor environments.
- 2024: Introduction of more modular and scalable DIDS architectures to support diverse indoor deployment scenarios, including smaller venues.
In-Depth Digital Indoor Distribution System Market Outlook
The future outlook for the Digital Indoor Distribution System market is exceptionally bright, characterized by sustained high growth and continuous innovation. The ongoing global rollout of 5G networks will remain a primary growth accelerator, necessitating comprehensive indoor coverage and capacity solutions. Strategic partnerships, technology standardization, and the increasing adoption of smart building principles will further fuel market expansion. Emerging applications, such as augmented reality (AR) and virtual reality (VR) within indoor environments, will demand the ultra-low latency and high bandwidth that advanced DIDS can provide. The market is expected to witness further technological advancements, including the exploration of new frequency bands and the development of more intelligent and automated network management systems. Overall, the Digital Indoor Distribution System market is poised for a period of significant transformation and growth, offering substantial strategic opportunities for stakeholders.
Digital Indoor Distribution System Segmentation
-
1. Application
- 1.1. Macro Base Station
- 1.2. Small Base Station
-
2. Types
- 2.1. Hardware
- 2.2. Software and Services
Digital Indoor Distribution System Segmentation By Geography
-
1. North America
- 1.1. United States
- 1.2. Canada
- 1.3. Mexico
-
2. South America
- 2.1. Brazil
- 2.2. Argentina
- 2.3. Rest of South America
-
3. Europe
- 3.1. United Kingdom
- 3.2. Germany
- 3.3. France
- 3.4. Italy
- 3.5. Spain
- 3.6. Russia
- 3.7. Benelux
- 3.8. Nordics
- 3.9. Rest of Europe
-
4. Middle East & Africa
- 4.1. Turkey
- 4.2. Israel
- 4.3. GCC
- 4.4. North Africa
- 4.5. South Africa
- 4.6. Rest of Middle East & Africa
-
5. Asia Pacific
- 5.1. China
- 5.2. India
- 5.3. Japan
- 5.4. South Korea
- 5.5. ASEAN
- 5.6. Oceania
- 5.7. Rest of Asia Pacific
Digital Indoor Distribution System Regional Market Share
Geographic Coverage of Digital Indoor Distribution System
Digital Indoor Distribution System REPORT HIGHLIGHTS
| Aspects | Details |
|---|---|
| Study Period | 2020-2034 |
| Base Year | 2025 |
| Estimated Year | 2026 |
| Forecast Period | 2026-2034 |
| Historical Period | 2020-2025 |
| Growth Rate | CAGR of 11.4% from 2020-2034 |
| Segmentation |
|
Table of Contents
- 1. Introduction
- 1.1. Research Scope
- 1.2. Market Segmentation
- 1.3. Research Objective
- 1.4. Definitions and Assumptions
- 2. Executive Summary
- 2.1. Market Snapshot
- 3. Market Dynamics
- 3.1. Market Drivers
- 3.2. Market Restrains
- 3.3. Market Trends
- 3.4. Market Opportunities
- 4. Market Factor Analysis
- 4.1. Porters Five Forces
- 4.1.1. Bargaining Power of Suppliers
- 4.1.2. Bargaining Power of Buyers
- 4.1.3. Threat of New Entrants
- 4.1.4. Threat of Substitutes
- 4.1.5. Competitive Rivalry
- 4.2. PESTEL analysis
- 4.3. BCG Analysis
- 4.3.1. Stars (High Growth, High Market Share)
- 4.3.2. Cash Cows (Low Growth, High Market Share)
- 4.3.3. Question Mark (High Growth, Low Market Share)
- 4.3.4. Dogs (Low Growth, Low Market Share)
- 4.4. Ansoff Matrix Analysis
- 4.5. Supply Chain Analysis
- 4.6. Regulatory Landscape
- 4.7. Current Market Potential and Opportunity Assessment (TAM–SAM–SOM Framework)
- 4.8. VDR Analyst Note
- 4.1. Porters Five Forces
- 5. Market Analysis, Insights and Forecast 2021-2033
- 5.1. Market Analysis, Insights and Forecast - by Application
- 5.1.1. Macro Base Station
- 5.1.2. Small Base Station
- 5.2. Market Analysis, Insights and Forecast - by Types
- 5.2.1. Hardware
- 5.2.2. Software and Services
- 5.3. Market Analysis, Insights and Forecast - by Region
- 5.3.1. North America
- 5.3.2. South America
- 5.3.3. Europe
- 5.3.4. Middle East & Africa
- 5.3.5. Asia Pacific
- 5.1. Market Analysis, Insights and Forecast - by Application
- 6. Global Digital Indoor Distribution System Analysis, Insights and Forecast, 2021-2033
- 6.1. Market Analysis, Insights and Forecast - by Application
- 6.1.1. Macro Base Station
- 6.1.2. Small Base Station
- 6.2. Market Analysis, Insights and Forecast - by Types
- 6.2.1. Hardware
- 6.2.2. Software and Services
- 6.1. Market Analysis, Insights and Forecast - by Application
- 7. North America Digital Indoor Distribution System Analysis, Insights and Forecast, 2021-2033
- 7.1. Market Analysis, Insights and Forecast - by Application
- 7.1.1. Macro Base Station
- 7.1.2. Small Base Station
- 7.2. Market Analysis, Insights and Forecast - by Types
- 7.2.1. Hardware
- 7.2.2. Software and Services
- 7.1. Market Analysis, Insights and Forecast - by Application
- 8. South America Digital Indoor Distribution System Analysis, Insights and Forecast, 2021-2033
- 8.1. Market Analysis, Insights and Forecast - by Application
- 8.1.1. Macro Base Station
- 8.1.2. Small Base Station
- 8.2. Market Analysis, Insights and Forecast - by Types
- 8.2.1. Hardware
- 8.2.2. Software and Services
- 8.1. Market Analysis, Insights and Forecast - by Application
- 9. Europe Digital Indoor Distribution System Analysis, Insights and Forecast, 2021-2033
- 9.1. Market Analysis, Insights and Forecast - by Application
- 9.1.1. Macro Base Station
- 9.1.2. Small Base Station
- 9.2. Market Analysis, Insights and Forecast - by Types
- 9.2.1. Hardware
- 9.2.2. Software and Services
- 9.1. Market Analysis, Insights and Forecast - by Application
- 10. Middle East & Africa Digital Indoor Distribution System Analysis, Insights and Forecast, 2021-2033
- 10.1. Market Analysis, Insights and Forecast - by Application
- 10.1.1. Macro Base Station
- 10.1.2. Small Base Station
- 10.2. Market Analysis, Insights and Forecast - by Types
- 10.2.1. Hardware
- 10.2.2. Software and Services
- 10.1. Market Analysis, Insights and Forecast - by Application
- 11. Asia Pacific Digital Indoor Distribution System Analysis, Insights and Forecast, 2021-2033
- 11.1. Market Analysis, Insights and Forecast - by Application
- 11.1.1. Macro Base Station
- 11.1.2. Small Base Station
- 11.2. Market Analysis, Insights and Forecast - by Types
- 11.2.1. Hardware
- 11.2.2. Software and Services
- 11.1. Market Analysis, Insights and Forecast - by Application
- 12. Competitive Analysis
- 12.1. Company Profiles
- 12.1.1 CICT Mobile Communication
- 12.1.1.1. Company Overview
- 12.1.1.2. Products
- 12.1.1.3. Company Financials
- 12.1.1.4. SWOT Analysis
- 12.1.2 Ruijie Networks
- 12.1.2.1. Company Overview
- 12.1.2.2. Products
- 12.1.2.3. Company Financials
- 12.1.2.4. SWOT Analysis
- 12.1.3 Comba Telecom
- 12.1.3.1. Company Overview
- 12.1.3.2. Products
- 12.1.3.3. Company Financials
- 12.1.3.4. SWOT Analysis
- 12.1.4 Huawei
- 12.1.4.1. Company Overview
- 12.1.4.2. Products
- 12.1.4.3. Company Financials
- 12.1.4.4. SWOT Analysis
- 12.1.1 CICT Mobile Communication
- 12.2. Market Entropy
- 12.2.1 Company's Key Areas Served
- 12.2.2 Recent Developments
- 12.3. Company Market Share Analysis 2025
- 12.3.1 Top 5 Companies Market Share Analysis
- 12.3.2 Top 3 Companies Market Share Analysis
- 12.4. List of Potential Customers
- 13. Research Methodology
List of Figures
- Figure 1: Global Digital Indoor Distribution System Revenue Breakdown (billion, %) by Region 2025 & 2033
- Figure 2: North America Digital Indoor Distribution System Revenue (billion), by Application 2025 & 2033
- Figure 3: North America Digital Indoor Distribution System Revenue Share (%), by Application 2025 & 2033
- Figure 4: North America Digital Indoor Distribution System Revenue (billion), by Types 2025 & 2033
- Figure 5: North America Digital Indoor Distribution System Revenue Share (%), by Types 2025 & 2033
- Figure 6: North America Digital Indoor Distribution System Revenue (billion), by Country 2025 & 2033
- Figure 7: North America Digital Indoor Distribution System Revenue Share (%), by Country 2025 & 2033
- Figure 8: South America Digital Indoor Distribution System Revenue (billion), by Application 2025 & 2033
- Figure 9: South America Digital Indoor Distribution System Revenue Share (%), by Application 2025 & 2033
- Figure 10: South America Digital Indoor Distribution System Revenue (billion), by Types 2025 & 2033
- Figure 11: South America Digital Indoor Distribution System Revenue Share (%), by Types 2025 & 2033
- Figure 12: South America Digital Indoor Distribution System Revenue (billion), by Country 2025 & 2033
- Figure 13: South America Digital Indoor Distribution System Revenue Share (%), by Country 2025 & 2033
- Figure 14: Europe Digital Indoor Distribution System Revenue (billion), by Application 2025 & 2033
- Figure 15: Europe Digital Indoor Distribution System Revenue Share (%), by Application 2025 & 2033
- Figure 16: Europe Digital Indoor Distribution System Revenue (billion), by Types 2025 & 2033
- Figure 17: Europe Digital Indoor Distribution System Revenue Share (%), by Types 2025 & 2033
- Figure 18: Europe Digital Indoor Distribution System Revenue (billion), by Country 2025 & 2033
- Figure 19: Europe Digital Indoor Distribution System Revenue Share (%), by Country 2025 & 2033
- Figure 20: Middle East & Africa Digital Indoor Distribution System Revenue (billion), by Application 2025 & 2033
- Figure 21: Middle East & Africa Digital Indoor Distribution System Revenue Share (%), by Application 2025 & 2033
- Figure 22: Middle East & Africa Digital Indoor Distribution System Revenue (billion), by Types 2025 & 2033
- Figure 23: Middle East & Africa Digital Indoor Distribution System Revenue Share (%), by Types 2025 & 2033
- Figure 24: Middle East & Africa Digital Indoor Distribution System Revenue (billion), by Country 2025 & 2033
- Figure 25: Middle East & Africa Digital Indoor Distribution System Revenue Share (%), by Country 2025 & 2033
- Figure 26: Asia Pacific Digital Indoor Distribution System Revenue (billion), by Application 2025 & 2033
- Figure 27: Asia Pacific Digital Indoor Distribution System Revenue Share (%), by Application 2025 & 2033
- Figure 28: Asia Pacific Digital Indoor Distribution System Revenue (billion), by Types 2025 & 2033
- Figure 29: Asia Pacific Digital Indoor Distribution System Revenue Share (%), by Types 2025 & 2033
- Figure 30: Asia Pacific Digital Indoor Distribution System Revenue (billion), by Country 2025 & 2033
- Figure 31: Asia Pacific Digital Indoor Distribution System Revenue Share (%), by Country 2025 & 2033
List of Tables
- Table 1: Global Digital Indoor Distribution System Revenue billion Forecast, by Application 2020 & 2033
- Table 2: Global Digital Indoor Distribution System Revenue billion Forecast, by Types 2020 & 2033
- Table 3: Global Digital Indoor Distribution System Revenue billion Forecast, by Region 2020 & 2033
- Table 4: Global Digital Indoor Distribution System Revenue billion Forecast, by Application 2020 & 2033
- Table 5: Global Digital Indoor Distribution System Revenue billion Forecast, by Types 2020 & 2033
- Table 6: Global Digital Indoor Distribution System Revenue billion Forecast, by Country 2020 & 2033
- Table 7: United States Digital Indoor Distribution System Revenue (billion) Forecast, by Application 2020 & 2033
- Table 8: Canada Digital Indoor Distribution System Revenue (billion) Forecast, by Application 2020 & 2033
- Table 9: Mexico Digital Indoor Distribution System Revenue (billion) Forecast, by Application 2020 & 2033
- Table 10: Global Digital Indoor Distribution System Revenue billion Forecast, by Application 2020 & 2033
- Table 11: Global Digital Indoor Distribution System Revenue billion Forecast, by Types 2020 & 2033
- Table 12: Global Digital Indoor Distribution System Revenue billion Forecast, by Country 2020 & 2033
- Table 13: Brazil Digital Indoor Distribution System Revenue (billion) Forecast, by Application 2020 & 2033
- Table 14: Argentina Digital Indoor Distribution System Revenue (billion) Forecast, by Application 2020 & 2033
- Table 15: Rest of South America Digital Indoor Distribution System Revenue (billion) Forecast, by Application 2020 & 2033
- Table 16: Global Digital Indoor Distribution System Revenue billion Forecast, by Application 2020 & 2033
- Table 17: Global Digital Indoor Distribution System Revenue billion Forecast, by Types 2020 & 2033
- Table 18: Global Digital Indoor Distribution System Revenue billion Forecast, by Country 2020 & 2033
- Table 19: United Kingdom Digital Indoor Distribution System Revenue (billion) Forecast, by Application 2020 & 2033
- Table 20: Germany Digital Indoor Distribution System Revenue (billion) Forecast, by Application 2020 & 2033
- Table 21: France Digital Indoor Distribution System Revenue (billion) Forecast, by Application 2020 & 2033
- Table 22: Italy Digital Indoor Distribution System Revenue (billion) Forecast, by Application 2020 & 2033
- Table 23: Spain Digital Indoor Distribution System Revenue (billion) Forecast, by Application 2020 & 2033
- Table 24: Russia Digital Indoor Distribution System Revenue (billion) Forecast, by Application 2020 & 2033
- Table 25: Benelux Digital Indoor Distribution System Revenue (billion) Forecast, by Application 2020 & 2033
- Table 26: Nordics Digital Indoor Distribution System Revenue (billion) Forecast, by Application 2020 & 2033
- Table 27: Rest of Europe Digital Indoor Distribution System Revenue (billion) Forecast, by Application 2020 & 2033
- Table 28: Global Digital Indoor Distribution System Revenue billion Forecast, by Application 2020 & 2033
- Table 29: Global Digital Indoor Distribution System Revenue billion Forecast, by Types 2020 & 2033
- Table 30: Global Digital Indoor Distribution System Revenue billion Forecast, by Country 2020 & 2033
- Table 31: Turkey Digital Indoor Distribution System Revenue (billion) Forecast, by Application 2020 & 2033
- Table 32: Israel Digital Indoor Distribution System Revenue (billion) Forecast, by Application 2020 & 2033
- Table 33: GCC Digital Indoor Distribution System Revenue (billion) Forecast, by Application 2020 & 2033
- Table 34: North Africa Digital Indoor Distribution System Revenue (billion) Forecast, by Application 2020 & 2033
- Table 35: South Africa Digital Indoor Distribution System Revenue (billion) Forecast, by Application 2020 & 2033
- Table 36: Rest of Middle East & Africa Digital Indoor Distribution System Revenue (billion) Forecast, by Application 2020 & 2033
- Table 37: Global Digital Indoor Distribution System Revenue billion Forecast, by Application 2020 & 2033
- Table 38: Global Digital Indoor Distribution System Revenue billion Forecast, by Types 2020 & 2033
- Table 39: Global Digital Indoor Distribution System Revenue billion Forecast, by Country 2020 & 2033
- Table 40: China Digital Indoor Distribution System Revenue (billion) Forecast, by Application 2020 & 2033
- Table 41: India Digital Indoor Distribution System Revenue (billion) Forecast, by Application 2020 & 2033
- Table 42: Japan Digital Indoor Distribution System Revenue (billion) Forecast, by Application 2020 & 2033
- Table 43: South Korea Digital Indoor Distribution System Revenue (billion) Forecast, by Application 2020 & 2033
- Table 44: ASEAN Digital Indoor Distribution System Revenue (billion) Forecast, by Application 2020 & 2033
- Table 45: Oceania Digital Indoor Distribution System Revenue (billion) Forecast, by Application 2020 & 2033
- Table 46: Rest of Asia Pacific Digital Indoor Distribution System Revenue (billion) Forecast, by Application 2020 & 2033
Frequently Asked Questions
1. What is the projected Compound Annual Growth Rate (CAGR) of the Digital Indoor Distribution System?
The projected CAGR is approximately 11.4%.
2. Which companies are prominent players in the Digital Indoor Distribution System?
Key companies in the market include CICT Mobile Communication, Ruijie Networks, Comba Telecom, Huawei.
3. What are the main segments of the Digital Indoor Distribution System?
The market segments include Application, Types.
4. Can you provide details about the market size?
The market size is estimated to be USD 17.4 billion as of 2022.
5. What are some drivers contributing to market growth?
N/A
6. What are the notable trends driving market growth?
N/A
7. Are there any restraints impacting market growth?
N/A
8. Can you provide examples of recent developments in the market?
N/A
9. What pricing options are available for accessing the report?
Pricing options include single-user, multi-user, and enterprise licenses priced at USD 4900.00, USD 7350.00, and USD 9800.00 respectively.
10. Is the market size provided in terms of value or volume?
The market size is provided in terms of value, measured in billion.
11. Are there any specific market keywords associated with the report?
Yes, the market keyword associated with the report is "Digital Indoor Distribution System," which aids in identifying and referencing the specific market segment covered.
12. How do I determine which pricing option suits my needs best?
The pricing options vary based on user requirements and access needs. Individual users may opt for single-user licenses, while businesses requiring broader access may choose multi-user or enterprise licenses for cost-effective access to the report.
13. Are there any additional resources or data provided in the Digital Indoor Distribution System report?
While the report offers comprehensive insights, it's advisable to review the specific contents or supplementary materials provided to ascertain if additional resources or data are available.
14. How can I stay updated on further developments or reports in the Digital Indoor Distribution System?
To stay informed about further developments, trends, and reports in the Digital Indoor Distribution System, consider subscribing to industry newsletters, following relevant companies and organizations, or regularly checking reputable industry news sources and publications.
Methodology
Step 1 - Identification of Relevant Samples Size from Population Database


Step 2 - Approaches for Defining Global Market Size (Value, Volume* & Price*)

Note*: In applicable scenarios
Step 3 - Data Sources
Primary Research
- Web Analytics
- Survey Reports
- Research Institute
- Latest Research Reports
- Opinion Leaders
Secondary Research
- Annual Reports
- White Paper
- Latest Press Release
- Industry Association
- Paid Database
- Investor Presentations

Step 4 - Data Triangulation
Involves using different sources of information in order to increase the validity of a study
These sources are likely to be stakeholders in a program - participants, other researchers, program staff, other community members, and so on.
Then we put all data in single framework & apply various statistical tools to find out the dynamic on the market.
During the analysis stage, feedback from the stakeholder groups would be compared to determine areas of agreement as well as areas of divergence