Key Insights
The global digital converter box market is poised for significant expansion, projected to reach $8.53 billion by 2025, with a Compound Annual Growth Rate (CAGR) of 10.33% through 2033. This growth is propelled by the accelerating global transition to digital broadcasting, particularly in emerging economies, and the increasing affordability of converter box technology. Enhanced internet penetration and supportive government initiatives for digital television adoption further fuel market demand. Key market segments are expected to emerge based on device capabilities (HD/SD), connectivity standards (HDMI, coaxial), and distribution networks (online, brick-and-mortar retail). The competitive landscape features established players and emerging manufacturers, driving innovation in signal reception and user interface design.
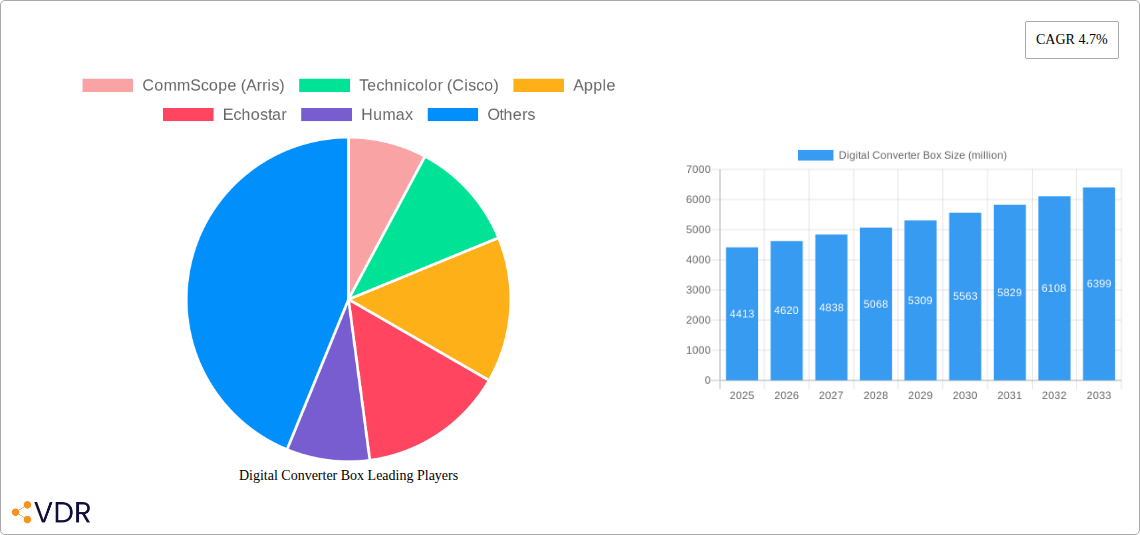
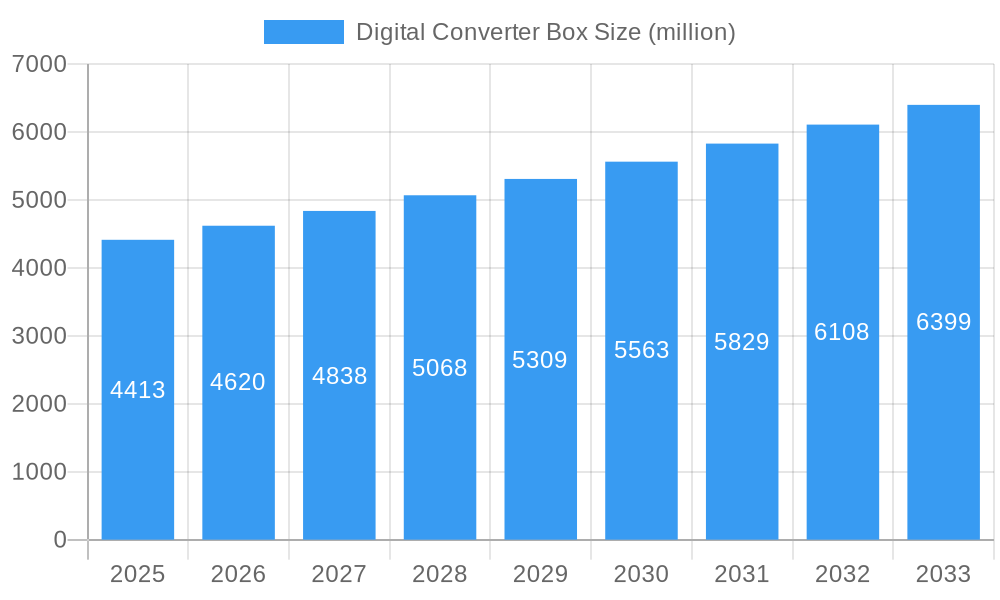
Digital Converter Box Market Size (In Billion)
Technological evolution, including the development of energy-efficient models, smart features integration (network connectivity, over-the-air streaming apps), and the adoption of 4K resolutions, will shape market segmentation and create opportunities for premium products. While the increasing popularity of streaming services presents a long-term challenge by potentially reducing the perceived necessity of converter boxes, manufacturers can mitigate this by focusing on innovation, competitive pricing, and strategic marketing. Geographic analysis indicates substantial growth potential in developing markets, contrasting with more saturated developed regions. A nuanced understanding of these dynamics is vital for effective strategic planning within the digital converter box industry.
Digital Converter Box Company Market Share
Digital Converter Box Market Report: 2019-2033
This comprehensive report provides a detailed analysis of the global Digital Converter Box market, encompassing historical data (2019-2024), current estimations (2025), and future projections (2025-2033). Targeting industry professionals and investors, it offers actionable insights into market dynamics, growth trends, key players, and emerging opportunities within the consumer electronics and broadcasting equipment sectors. The report examines the market across various segments and regions, providing a granular understanding of this evolving landscape. Market size is expressed in million units.
Digital Converter Box Market Dynamics & Structure
The global Digital Converter Box market exhibits a moderately fragmented structure, with several key players vying for market share. Technological innovation, driven by advancements in digital signal processing and compression technologies, plays a significant role. Regulatory frameworks, particularly those related to digital broadcasting transitions, influence market adoption rates. The market faces competition from alternative streaming technologies and smart TVs, presenting a challenge to growth. End-user demographics significantly influence market demand, with older demographics potentially demonstrating higher adoption rates compared to younger generations. Consolidation through mergers and acquisitions (M&A) has been moderate, with xx M&A deals recorded between 2019-2024, leading to xx% market share consolidation amongst the top 5 players.
- Market Concentration: Moderately fragmented, with top 5 players holding xx% market share in 2024.
- Technological Innovation: Advancements in HEVC, improved energy efficiency, and enhanced user interfaces are key drivers.
- Regulatory Landscape: Government mandates for digital TV transitions heavily influence market growth.
- Competitive Substitutes: Streaming services and smart TVs pose significant competition.
- End-User Demographics: Older consumers are a primary target demographic.
- M&A Activity: xx deals in 2019-2024 resulting in xx% market share consolidation.
Digital Converter Box Growth Trends & Insights
The Digital Converter Box market experienced a CAGR of xx% during the historical period (2019-2024), reaching xx million units in 2024. Adoption rates have been influenced by government initiatives promoting digital TV transitions and declining prices of converter boxes. Technological disruptions, such as the rise of streaming platforms and smart TV adoption, have presented challenges, impacting market growth. However, the continued need for digital TV access in underserved areas and the availability of affordable converter boxes contribute to sustained market demand. Market penetration in developed regions is nearing saturation, while emerging markets offer substantial growth opportunities. The estimated market size in 2025 is projected to be xx million units. The forecast period (2025-2033) anticipates a CAGR of xx%, with a projected market size of xx million units by 2033. This growth is projected to be driven by continued adoption in developing economies and the increasing need for legacy equipment upgrades.
Dominant Regions, Countries, or Segments in Digital Converter Box
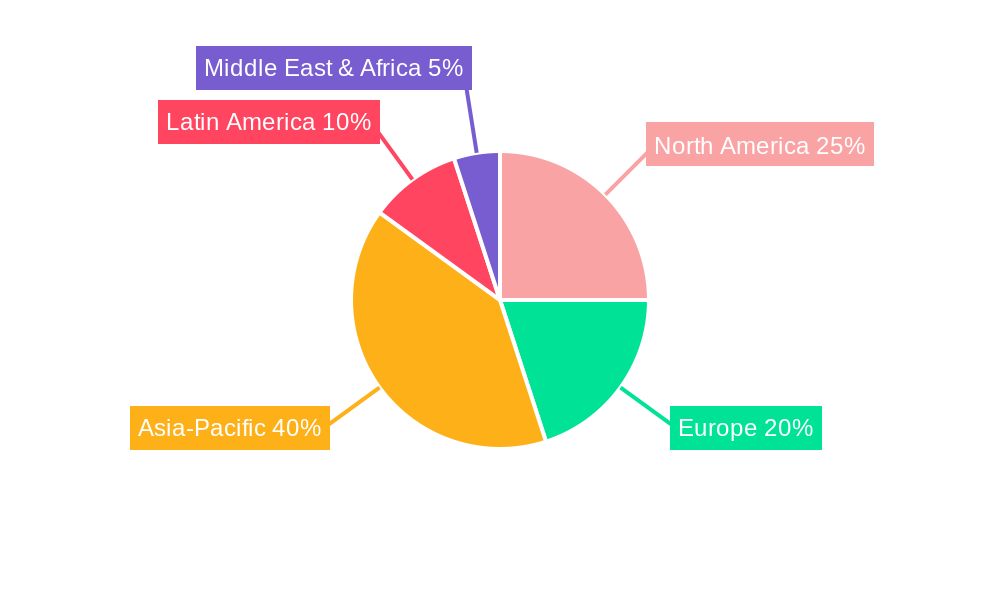
North America and Europe currently dominate the Digital Converter Box market, driven by early adoption of digital broadcasting technologies and well-established infrastructure. However, rapid growth is expected in Asia-Pacific and Latin America due to ongoing digitalization initiatives and a large base of analog TV households. Specific countries like India and Brazil are witnessing significant market expansion.
- Key Drivers:
- Government policies promoting digital TV transition.
- Expanding broadband infrastructure and internet penetration.
- Rising disposable incomes in developing economies.
- Dominance Factors:
- Early adoption of digital broadcasting in developed regions.
- Strong regulatory support for digital TV transition.
- Higher purchasing power in developed nations.
- Emerging markets offering high growth potential.
Digital Converter Box Product Landscape
Digital Converter boxes are available in a range of configurations and features, including varying levels of input and output capabilities, support for different broadcast standards, and integration with additional functionalities. Technological advancements are focused on improved signal processing, power efficiency, compact designs, and user-friendly interfaces. Many models offer additional features, such as USB ports for media playback and enhanced user interface options. Unique selling propositions focus on ease of use, compatibility, and price point.
Key Drivers, Barriers & Challenges in Digital Converter Box
Key Drivers:
- Government mandates for digital TV transitions.
- Growing affordability of converter boxes.
- Expanding internet penetration and digital media consumption.
Key Challenges & Restraints:
- Competition from smart TVs and streaming services.
- Technological obsolescence as streaming takes over.
- Supply chain disruptions impacting manufacturing costs and availability. This resulted in a xx% increase in prices during 2022-2023.
Emerging Opportunities in Digital Converter Box
- Penetration into underserved markets in developing nations.
- Development of converter boxes with integrated streaming capabilities.
- Focus on energy-efficient designs and eco-friendly manufacturing.
Growth Accelerators in the Digital Converter Box Industry
Technological advancements, including more efficient chipsets and improved user interfaces will continue to drive growth. Strategic partnerships between manufacturers and broadcast operators will help expand market reach. Expanding into emerging markets and providing customized solutions for regional needs will unlock significant potential.
Key Players Shaping the Digital Converter Box Market
- CommScope (Arris)
- Technicolor (Cisco)
- Apple
- Echostar
- Humax
- Sagemcom
- Samsung
- Roku
- Skyworth Digital Technology Co.,Ltd
- HUAWEI
- JEZETEC
- COSHIP
- SICHUAN CHANGHONG
- UNION MAN
- YINHE ELECTRONICS
- ZTE
- HISENSE
Notable Milestones in Digital Converter Box Sector
- 2020: Increased adoption rates in several Latin American countries following government-led digital TV transition initiatives.
- 2021: Launch of several energy-efficient converter box models by key players.
- 2022: Significant price increases due to supply chain disruptions.
- 2023: Several partnerships between manufacturers and telecommunication providers to bundle converter boxes with internet services.
In-Depth Digital Converter Box Market Outlook
The Digital Converter Box market is poised for continued growth, albeit at a slower pace than in previous years, driven by the need to upgrade legacy systems in emerging markets and niche applications requiring specialized converter boxes. Strategic partnerships, focus on energy-efficient models, and exploring untapped markets in developing economies offer significant opportunities for sustained growth and profitability in the long term. The focus will shift towards specialized models with integrated streaming capabilities and enhanced features, rather than simple analog-to-digital conversion boxes.
Digital Converter Box Segmentation
-
1. Application
- 1.1. Household
- 1.2. Commercial
-
2. Types
- 2.1. ASTC-NTSC
- 2.2. DVB-PAL
- 2.3. ISDBT-NTSC
Digital Converter Box Segmentation By Geography
-
1. North America
- 1.1. United States
- 1.2. Canada
- 1.3. Mexico
-
2. South America
- 2.1. Brazil
- 2.2. Argentina
- 2.3. Rest of South America
-
3. Europe
- 3.1. United Kingdom
- 3.2. Germany
- 3.3. France
- 3.4. Italy
- 3.5. Spain
- 3.6. Russia
- 3.7. Benelux
- 3.8. Nordics
- 3.9. Rest of Europe
-
4. Middle East & Africa
- 4.1. Turkey
- 4.2. Israel
- 4.3. GCC
- 4.4. North Africa
- 4.5. South Africa
- 4.6. Rest of Middle East & Africa
-
5. Asia Pacific
- 5.1. China
- 5.2. India
- 5.3. Japan
- 5.4. South Korea
- 5.5. ASEAN
- 5.6. Oceania
- 5.7. Rest of Asia Pacific
Digital Converter Box Regional Market Share
Geographic Coverage of Digital Converter Box
Digital Converter Box REPORT HIGHLIGHTS
| Aspects | Details |
|---|---|
| Study Period | 2020-2034 |
| Base Year | 2025 |
| Estimated Year | 2026 |
| Forecast Period | 2026-2034 |
| Historical Period | 2020-2025 |
| Growth Rate | CAGR of 10.33% from 2020-2034 |
| Segmentation |
|
Table of Contents
- 1. Introduction
- 1.1. Research Scope
- 1.2. Market Segmentation
- 1.3. Research Objective
- 1.4. Definitions and Assumptions
- 2. Executive Summary
- 2.1. Market Snapshot
- 3. Market Dynamics
- 3.1. Market Drivers
- 3.2. Market Restrains
- 3.3. Market Trends
- 3.4. Market Opportunities
- 4. Market Factor Analysis
- 4.1. Porters Five Forces
- 4.1.1. Bargaining Power of Suppliers
- 4.1.2. Bargaining Power of Buyers
- 4.1.3. Threat of New Entrants
- 4.1.4. Threat of Substitutes
- 4.1.5. Competitive Rivalry
- 4.2. PESTEL analysis
- 4.3. BCG Analysis
- 4.3.1. Stars (High Growth, High Market Share)
- 4.3.2. Cash Cows (Low Growth, High Market Share)
- 4.3.3. Question Mark (High Growth, Low Market Share)
- 4.3.4. Dogs (Low Growth, Low Market Share)
- 4.4. Ansoff Matrix Analysis
- 4.5. Supply Chain Analysis
- 4.6. Regulatory Landscape
- 4.7. Current Market Potential and Opportunity Assessment (TAM–SAM–SOM Framework)
- 4.8. VDR Analyst Note
- 4.1. Porters Five Forces
- 5. Market Analysis, Insights and Forecast 2021-2033
- 5.1. Market Analysis, Insights and Forecast - by Application
- 5.1.1. Household
- 5.1.2. Commercial
- 5.2. Market Analysis, Insights and Forecast - by Types
- 5.2.1. ASTC-NTSC
- 5.2.2. DVB-PAL
- 5.2.3. ISDBT-NTSC
- 5.3. Market Analysis, Insights and Forecast - by Region
- 5.3.1. North America
- 5.3.2. South America
- 5.3.3. Europe
- 5.3.4. Middle East & Africa
- 5.3.5. Asia Pacific
- 5.1. Market Analysis, Insights and Forecast - by Application
- 6. Global Digital Converter Box Analysis, Insights and Forecast, 2021-2033
- 6.1. Market Analysis, Insights and Forecast - by Application
- 6.1.1. Household
- 6.1.2. Commercial
- 6.2. Market Analysis, Insights and Forecast - by Types
- 6.2.1. ASTC-NTSC
- 6.2.2. DVB-PAL
- 6.2.3. ISDBT-NTSC
- 6.1. Market Analysis, Insights and Forecast - by Application
- 7. North America Digital Converter Box Analysis, Insights and Forecast, 2021-2033
- 7.1. Market Analysis, Insights and Forecast - by Application
- 7.1.1. Household
- 7.1.2. Commercial
- 7.2. Market Analysis, Insights and Forecast - by Types
- 7.2.1. ASTC-NTSC
- 7.2.2. DVB-PAL
- 7.2.3. ISDBT-NTSC
- 7.1. Market Analysis, Insights and Forecast - by Application
- 8. South America Digital Converter Box Analysis, Insights and Forecast, 2021-2033
- 8.1. Market Analysis, Insights and Forecast - by Application
- 8.1.1. Household
- 8.1.2. Commercial
- 8.2. Market Analysis, Insights and Forecast - by Types
- 8.2.1. ASTC-NTSC
- 8.2.2. DVB-PAL
- 8.2.3. ISDBT-NTSC
- 8.1. Market Analysis, Insights and Forecast - by Application
- 9. Europe Digital Converter Box Analysis, Insights and Forecast, 2021-2033
- 9.1. Market Analysis, Insights and Forecast - by Application
- 9.1.1. Household
- 9.1.2. Commercial
- 9.2. Market Analysis, Insights and Forecast - by Types
- 9.2.1. ASTC-NTSC
- 9.2.2. DVB-PAL
- 9.2.3. ISDBT-NTSC
- 9.1. Market Analysis, Insights and Forecast - by Application
- 10. Middle East & Africa Digital Converter Box Analysis, Insights and Forecast, 2021-2033
- 10.1. Market Analysis, Insights and Forecast - by Application
- 10.1.1. Household
- 10.1.2. Commercial
- 10.2. Market Analysis, Insights and Forecast - by Types
- 10.2.1. ASTC-NTSC
- 10.2.2. DVB-PAL
- 10.2.3. ISDBT-NTSC
- 10.1. Market Analysis, Insights and Forecast - by Application
- 11. Asia Pacific Digital Converter Box Analysis, Insights and Forecast, 2021-2033
- 11.1. Market Analysis, Insights and Forecast - by Application
- 11.1.1. Household
- 11.1.2. Commercial
- 11.2. Market Analysis, Insights and Forecast - by Types
- 11.2.1. ASTC-NTSC
- 11.2.2. DVB-PAL
- 11.2.3. ISDBT-NTSC
- 11.1. Market Analysis, Insights and Forecast - by Application
- 12. Competitive Analysis
- 12.1. Company Profiles
- 12.1.1 CommScope (Arris)
- 12.1.1.1. Company Overview
- 12.1.1.2. Products
- 12.1.1.3. Company Financials
- 12.1.1.4. SWOT Analysis
- 12.1.2 Technicolor (Cisco)
- 12.1.2.1. Company Overview
- 12.1.2.2. Products
- 12.1.2.3. Company Financials
- 12.1.2.4. SWOT Analysis
- 12.1.3 Apple
- 12.1.3.1. Company Overview
- 12.1.3.2. Products
- 12.1.3.3. Company Financials
- 12.1.3.4. SWOT Analysis
- 12.1.4 Echostar
- 12.1.4.1. Company Overview
- 12.1.4.2. Products
- 12.1.4.3. Company Financials
- 12.1.4.4. SWOT Analysis
- 12.1.5 Humax
- 12.1.5.1. Company Overview
- 12.1.5.2. Products
- 12.1.5.3. Company Financials
- 12.1.5.4. SWOT Analysis
- 12.1.6 Sagemcom
- 12.1.6.1. Company Overview
- 12.1.6.2. Products
- 12.1.6.3. Company Financials
- 12.1.6.4. SWOT Analysis
- 12.1.7 Samsung
- 12.1.7.1. Company Overview
- 12.1.7.2. Products
- 12.1.7.3. Company Financials
- 12.1.7.4. SWOT Analysis
- 12.1.8 Roku
- 12.1.8.1. Company Overview
- 12.1.8.2. Products
- 12.1.8.3. Company Financials
- 12.1.8.4. SWOT Analysis
- 12.1.9 Skyworth Digital Technology Co.
- 12.1.9.1. Company Overview
- 12.1.9.2. Products
- 12.1.9.3. Company Financials
- 12.1.9.4. SWOT Analysis
- 12.1.10 Ltd
- 12.1.10.1. Company Overview
- 12.1.10.2. Products
- 12.1.10.3. Company Financials
- 12.1.10.4. SWOT Analysis
- 12.1.11 HUAWEI
- 12.1.11.1. Company Overview
- 12.1.11.2. Products
- 12.1.11.3. Company Financials
- 12.1.11.4. SWOT Analysis
- 12.1.12 JEZETEC
- 12.1.12.1. Company Overview
- 12.1.12.2. Products
- 12.1.12.3. Company Financials
- 12.1.12.4. SWOT Analysis
- 12.1.13 COSHIP
- 12.1.13.1. Company Overview
- 12.1.13.2. Products
- 12.1.13.3. Company Financials
- 12.1.13.4. SWOT Analysis
- 12.1.14 SICHUAN CHANGHONG
- 12.1.14.1. Company Overview
- 12.1.14.2. Products
- 12.1.14.3. Company Financials
- 12.1.14.4. SWOT Analysis
- 12.1.15 UNION MAN
- 12.1.15.1. Company Overview
- 12.1.15.2. Products
- 12.1.15.3. Company Financials
- 12.1.15.4. SWOT Analysis
- 12.1.16 YINHE ELECTRONICS
- 12.1.16.1. Company Overview
- 12.1.16.2. Products
- 12.1.16.3. Company Financials
- 12.1.16.4. SWOT Analysis
- 12.1.17 ZTE
- 12.1.17.1. Company Overview
- 12.1.17.2. Products
- 12.1.17.3. Company Financials
- 12.1.17.4. SWOT Analysis
- 12.1.18 HISENSE
- 12.1.18.1. Company Overview
- 12.1.18.2. Products
- 12.1.18.3. Company Financials
- 12.1.18.4. SWOT Analysis
- 12.1.1 CommScope (Arris)
- 12.2. Market Entropy
- 12.2.1 Company's Key Areas Served
- 12.2.2 Recent Developments
- 12.3. Company Market Share Analysis 2025
- 12.3.1 Top 5 Companies Market Share Analysis
- 12.3.2 Top 3 Companies Market Share Analysis
- 12.4. List of Potential Customers
- 13. Research Methodology
List of Figures
- Figure 1: Global Digital Converter Box Revenue Breakdown (billion, %) by Region 2025 & 2033
- Figure 2: Global Digital Converter Box Volume Breakdown (K, %) by Region 2025 & 2033
- Figure 3: North America Digital Converter Box Revenue (billion), by Application 2025 & 2033
- Figure 4: North America Digital Converter Box Volume (K), by Application 2025 & 2033
- Figure 5: North America Digital Converter Box Revenue Share (%), by Application 2025 & 2033
- Figure 6: North America Digital Converter Box Volume Share (%), by Application 2025 & 2033
- Figure 7: North America Digital Converter Box Revenue (billion), by Types 2025 & 2033
- Figure 8: North America Digital Converter Box Volume (K), by Types 2025 & 2033
- Figure 9: North America Digital Converter Box Revenue Share (%), by Types 2025 & 2033
- Figure 10: North America Digital Converter Box Volume Share (%), by Types 2025 & 2033
- Figure 11: North America Digital Converter Box Revenue (billion), by Country 2025 & 2033
- Figure 12: North America Digital Converter Box Volume (K), by Country 2025 & 2033
- Figure 13: North America Digital Converter Box Revenue Share (%), by Country 2025 & 2033
- Figure 14: North America Digital Converter Box Volume Share (%), by Country 2025 & 2033
- Figure 15: South America Digital Converter Box Revenue (billion), by Application 2025 & 2033
- Figure 16: South America Digital Converter Box Volume (K), by Application 2025 & 2033
- Figure 17: South America Digital Converter Box Revenue Share (%), by Application 2025 & 2033
- Figure 18: South America Digital Converter Box Volume Share (%), by Application 2025 & 2033
- Figure 19: South America Digital Converter Box Revenue (billion), by Types 2025 & 2033
- Figure 20: South America Digital Converter Box Volume (K), by Types 2025 & 2033
- Figure 21: South America Digital Converter Box Revenue Share (%), by Types 2025 & 2033
- Figure 22: South America Digital Converter Box Volume Share (%), by Types 2025 & 2033
- Figure 23: South America Digital Converter Box Revenue (billion), by Country 2025 & 2033
- Figure 24: South America Digital Converter Box Volume (K), by Country 2025 & 2033
- Figure 25: South America Digital Converter Box Revenue Share (%), by Country 2025 & 2033
- Figure 26: South America Digital Converter Box Volume Share (%), by Country 2025 & 2033
- Figure 27: Europe Digital Converter Box Revenue (billion), by Application 2025 & 2033
- Figure 28: Europe Digital Converter Box Volume (K), by Application 2025 & 2033
- Figure 29: Europe Digital Converter Box Revenue Share (%), by Application 2025 & 2033
- Figure 30: Europe Digital Converter Box Volume Share (%), by Application 2025 & 2033
- Figure 31: Europe Digital Converter Box Revenue (billion), by Types 2025 & 2033
- Figure 32: Europe Digital Converter Box Volume (K), by Types 2025 & 2033
- Figure 33: Europe Digital Converter Box Revenue Share (%), by Types 2025 & 2033
- Figure 34: Europe Digital Converter Box Volume Share (%), by Types 2025 & 2033
- Figure 35: Europe Digital Converter Box Revenue (billion), by Country 2025 & 2033
- Figure 36: Europe Digital Converter Box Volume (K), by Country 2025 & 2033
- Figure 37: Europe Digital Converter Box Revenue Share (%), by Country 2025 & 2033
- Figure 38: Europe Digital Converter Box Volume Share (%), by Country 2025 & 2033
- Figure 39: Middle East & Africa Digital Converter Box Revenue (billion), by Application 2025 & 2033
- Figure 40: Middle East & Africa Digital Converter Box Volume (K), by Application 2025 & 2033
- Figure 41: Middle East & Africa Digital Converter Box Revenue Share (%), by Application 2025 & 2033
- Figure 42: Middle East & Africa Digital Converter Box Volume Share (%), by Application 2025 & 2033
- Figure 43: Middle East & Africa Digital Converter Box Revenue (billion), by Types 2025 & 2033
- Figure 44: Middle East & Africa Digital Converter Box Volume (K), by Types 2025 & 2033
- Figure 45: Middle East & Africa Digital Converter Box Revenue Share (%), by Types 2025 & 2033
- Figure 46: Middle East & Africa Digital Converter Box Volume Share (%), by Types 2025 & 2033
- Figure 47: Middle East & Africa Digital Converter Box Revenue (billion), by Country 2025 & 2033
- Figure 48: Middle East & Africa Digital Converter Box Volume (K), by Country 2025 & 2033
- Figure 49: Middle East & Africa Digital Converter Box Revenue Share (%), by Country 2025 & 2033
- Figure 50: Middle East & Africa Digital Converter Box Volume Share (%), by Country 2025 & 2033
- Figure 51: Asia Pacific Digital Converter Box Revenue (billion), by Application 2025 & 2033
- Figure 52: Asia Pacific Digital Converter Box Volume (K), by Application 2025 & 2033
- Figure 53: Asia Pacific Digital Converter Box Revenue Share (%), by Application 2025 & 2033
- Figure 54: Asia Pacific Digital Converter Box Volume Share (%), by Application 2025 & 2033
- Figure 55: Asia Pacific Digital Converter Box Revenue (billion), by Types 2025 & 2033
- Figure 56: Asia Pacific Digital Converter Box Volume (K), by Types 2025 & 2033
- Figure 57: Asia Pacific Digital Converter Box Revenue Share (%), by Types 2025 & 2033
- Figure 58: Asia Pacific Digital Converter Box Volume Share (%), by Types 2025 & 2033
- Figure 59: Asia Pacific Digital Converter Box Revenue (billion), by Country 2025 & 2033
- Figure 60: Asia Pacific Digital Converter Box Volume (K), by Country 2025 & 2033
- Figure 61: Asia Pacific Digital Converter Box Revenue Share (%), by Country 2025 & 2033
- Figure 62: Asia Pacific Digital Converter Box Volume Share (%), by Country 2025 & 2033
List of Tables
- Table 1: Global Digital Converter Box Revenue billion Forecast, by Application 2020 & 2033
- Table 2: Global Digital Converter Box Volume K Forecast, by Application 2020 & 2033
- Table 3: Global Digital Converter Box Revenue billion Forecast, by Types 2020 & 2033
- Table 4: Global Digital Converter Box Volume K Forecast, by Types 2020 & 2033
- Table 5: Global Digital Converter Box Revenue billion Forecast, by Region 2020 & 2033
- Table 6: Global Digital Converter Box Volume K Forecast, by Region 2020 & 2033
- Table 7: Global Digital Converter Box Revenue billion Forecast, by Application 2020 & 2033
- Table 8: Global Digital Converter Box Volume K Forecast, by Application 2020 & 2033
- Table 9: Global Digital Converter Box Revenue billion Forecast, by Types 2020 & 2033
- Table 10: Global Digital Converter Box Volume K Forecast, by Types 2020 & 2033
- Table 11: Global Digital Converter Box Revenue billion Forecast, by Country 2020 & 2033
- Table 12: Global Digital Converter Box Volume K Forecast, by Country 2020 & 2033
- Table 13: United States Digital Converter Box Revenue (billion) Forecast, by Application 2020 & 2033
- Table 14: United States Digital Converter Box Volume (K) Forecast, by Application 2020 & 2033
- Table 15: Canada Digital Converter Box Revenue (billion) Forecast, by Application 2020 & 2033
- Table 16: Canada Digital Converter Box Volume (K) Forecast, by Application 2020 & 2033
- Table 17: Mexico Digital Converter Box Revenue (billion) Forecast, by Application 2020 & 2033
- Table 18: Mexico Digital Converter Box Volume (K) Forecast, by Application 2020 & 2033
- Table 19: Global Digital Converter Box Revenue billion Forecast, by Application 2020 & 2033
- Table 20: Global Digital Converter Box Volume K Forecast, by Application 2020 & 2033
- Table 21: Global Digital Converter Box Revenue billion Forecast, by Types 2020 & 2033
- Table 22: Global Digital Converter Box Volume K Forecast, by Types 2020 & 2033
- Table 23: Global Digital Converter Box Revenue billion Forecast, by Country 2020 & 2033
- Table 24: Global Digital Converter Box Volume K Forecast, by Country 2020 & 2033
- Table 25: Brazil Digital Converter Box Revenue (billion) Forecast, by Application 2020 & 2033
- Table 26: Brazil Digital Converter Box Volume (K) Forecast, by Application 2020 & 2033
- Table 27: Argentina Digital Converter Box Revenue (billion) Forecast, by Application 2020 & 2033
- Table 28: Argentina Digital Converter Box Volume (K) Forecast, by Application 2020 & 2033
- Table 29: Rest of South America Digital Converter Box Revenue (billion) Forecast, by Application 2020 & 2033
- Table 30: Rest of South America Digital Converter Box Volume (K) Forecast, by Application 2020 & 2033
- Table 31: Global Digital Converter Box Revenue billion Forecast, by Application 2020 & 2033
- Table 32: Global Digital Converter Box Volume K Forecast, by Application 2020 & 2033
- Table 33: Global Digital Converter Box Revenue billion Forecast, by Types 2020 & 2033
- Table 34: Global Digital Converter Box Volume K Forecast, by Types 2020 & 2033
- Table 35: Global Digital Converter Box Revenue billion Forecast, by Country 2020 & 2033
- Table 36: Global Digital Converter Box Volume K Forecast, by Country 2020 & 2033
- Table 37: United Kingdom Digital Converter Box Revenue (billion) Forecast, by Application 2020 & 2033
- Table 38: United Kingdom Digital Converter Box Volume (K) Forecast, by Application 2020 & 2033
- Table 39: Germany Digital Converter Box Revenue (billion) Forecast, by Application 2020 & 2033
- Table 40: Germany Digital Converter Box Volume (K) Forecast, by Application 2020 & 2033
- Table 41: France Digital Converter Box Revenue (billion) Forecast, by Application 2020 & 2033
- Table 42: France Digital Converter Box Volume (K) Forecast, by Application 2020 & 2033
- Table 43: Italy Digital Converter Box Revenue (billion) Forecast, by Application 2020 & 2033
- Table 44: Italy Digital Converter Box Volume (K) Forecast, by Application 2020 & 2033
- Table 45: Spain Digital Converter Box Revenue (billion) Forecast, by Application 2020 & 2033
- Table 46: Spain Digital Converter Box Volume (K) Forecast, by Application 2020 & 2033
- Table 47: Russia Digital Converter Box Revenue (billion) Forecast, by Application 2020 & 2033
- Table 48: Russia Digital Converter Box Volume (K) Forecast, by Application 2020 & 2033
- Table 49: Benelux Digital Converter Box Revenue (billion) Forecast, by Application 2020 & 2033
- Table 50: Benelux Digital Converter Box Volume (K) Forecast, by Application 2020 & 2033
- Table 51: Nordics Digital Converter Box Revenue (billion) Forecast, by Application 2020 & 2033
- Table 52: Nordics Digital Converter Box Volume (K) Forecast, by Application 2020 & 2033
- Table 53: Rest of Europe Digital Converter Box Revenue (billion) Forecast, by Application 2020 & 2033
- Table 54: Rest of Europe Digital Converter Box Volume (K) Forecast, by Application 2020 & 2033
- Table 55: Global Digital Converter Box Revenue billion Forecast, by Application 2020 & 2033
- Table 56: Global Digital Converter Box Volume K Forecast, by Application 2020 & 2033
- Table 57: Global Digital Converter Box Revenue billion Forecast, by Types 2020 & 2033
- Table 58: Global Digital Converter Box Volume K Forecast, by Types 2020 & 2033
- Table 59: Global Digital Converter Box Revenue billion Forecast, by Country 2020 & 2033
- Table 60: Global Digital Converter Box Volume K Forecast, by Country 2020 & 2033
- Table 61: Turkey Digital Converter Box Revenue (billion) Forecast, by Application 2020 & 2033
- Table 62: Turkey Digital Converter Box Volume (K) Forecast, by Application 2020 & 2033
- Table 63: Israel Digital Converter Box Revenue (billion) Forecast, by Application 2020 & 2033
- Table 64: Israel Digital Converter Box Volume (K) Forecast, by Application 2020 & 2033
- Table 65: GCC Digital Converter Box Revenue (billion) Forecast, by Application 2020 & 2033
- Table 66: GCC Digital Converter Box Volume (K) Forecast, by Application 2020 & 2033
- Table 67: North Africa Digital Converter Box Revenue (billion) Forecast, by Application 2020 & 2033
- Table 68: North Africa Digital Converter Box Volume (K) Forecast, by Application 2020 & 2033
- Table 69: South Africa Digital Converter Box Revenue (billion) Forecast, by Application 2020 & 2033
- Table 70: South Africa Digital Converter Box Volume (K) Forecast, by Application 2020 & 2033
- Table 71: Rest of Middle East & Africa Digital Converter Box Revenue (billion) Forecast, by Application 2020 & 2033
- Table 72: Rest of Middle East & Africa Digital Converter Box Volume (K) Forecast, by Application 2020 & 2033
- Table 73: Global Digital Converter Box Revenue billion Forecast, by Application 2020 & 2033
- Table 74: Global Digital Converter Box Volume K Forecast, by Application 2020 & 2033
- Table 75: Global Digital Converter Box Revenue billion Forecast, by Types 2020 & 2033
- Table 76: Global Digital Converter Box Volume K Forecast, by Types 2020 & 2033
- Table 77: Global Digital Converter Box Revenue billion Forecast, by Country 2020 & 2033
- Table 78: Global Digital Converter Box Volume K Forecast, by Country 2020 & 2033
- Table 79: China Digital Converter Box Revenue (billion) Forecast, by Application 2020 & 2033
- Table 80: China Digital Converter Box Volume (K) Forecast, by Application 2020 & 2033
- Table 81: India Digital Converter Box Revenue (billion) Forecast, by Application 2020 & 2033
- Table 82: India Digital Converter Box Volume (K) Forecast, by Application 2020 & 2033
- Table 83: Japan Digital Converter Box Revenue (billion) Forecast, by Application 2020 & 2033
- Table 84: Japan Digital Converter Box Volume (K) Forecast, by Application 2020 & 2033
- Table 85: South Korea Digital Converter Box Revenue (billion) Forecast, by Application 2020 & 2033
- Table 86: South Korea Digital Converter Box Volume (K) Forecast, by Application 2020 & 2033
- Table 87: ASEAN Digital Converter Box Revenue (billion) Forecast, by Application 2020 & 2033
- Table 88: ASEAN Digital Converter Box Volume (K) Forecast, by Application 2020 & 2033
- Table 89: Oceania Digital Converter Box Revenue (billion) Forecast, by Application 2020 & 2033
- Table 90: Oceania Digital Converter Box Volume (K) Forecast, by Application 2020 & 2033
- Table 91: Rest of Asia Pacific Digital Converter Box Revenue (billion) Forecast, by Application 2020 & 2033
- Table 92: Rest of Asia Pacific Digital Converter Box Volume (K) Forecast, by Application 2020 & 2033
Frequently Asked Questions
1. What is the projected Compound Annual Growth Rate (CAGR) of the Digital Converter Box?
The projected CAGR is approximately 10.33%.
2. Which companies are prominent players in the Digital Converter Box?
Key companies in the market include CommScope (Arris), Technicolor (Cisco), Apple, Echostar, Humax, Sagemcom, Samsung, Roku, Skyworth Digital Technology Co., Ltd, HUAWEI, JEZETEC, COSHIP, SICHUAN CHANGHONG, UNION MAN, YINHE ELECTRONICS, ZTE, HISENSE.
3. What are the main segments of the Digital Converter Box?
The market segments include Application, Types.
4. Can you provide details about the market size?
The market size is estimated to be USD 8.53 billion as of 2022.
5. What are some drivers contributing to market growth?
N/A
6. What are the notable trends driving market growth?
N/A
7. Are there any restraints impacting market growth?
N/A
8. Can you provide examples of recent developments in the market?
N/A
9. What pricing options are available for accessing the report?
Pricing options include single-user, multi-user, and enterprise licenses priced at USD 3350.00, USD 5025.00, and USD 6700.00 respectively.
10. Is the market size provided in terms of value or volume?
The market size is provided in terms of value, measured in billion and volume, measured in K.
11. Are there any specific market keywords associated with the report?
Yes, the market keyword associated with the report is "Digital Converter Box," which aids in identifying and referencing the specific market segment covered.
12. How do I determine which pricing option suits my needs best?
The pricing options vary based on user requirements and access needs. Individual users may opt for single-user licenses, while businesses requiring broader access may choose multi-user or enterprise licenses for cost-effective access to the report.
13. Are there any additional resources or data provided in the Digital Converter Box report?
While the report offers comprehensive insights, it's advisable to review the specific contents or supplementary materials provided to ascertain if additional resources or data are available.
14. How can I stay updated on further developments or reports in the Digital Converter Box?
To stay informed about further developments, trends, and reports in the Digital Converter Box, consider subscribing to industry newsletters, following relevant companies and organizations, or regularly checking reputable industry news sources and publications.
Methodology
Step 1 - Identification of Relevant Samples Size from Population Database


Step 2 - Approaches for Defining Global Market Size (Value, Volume* & Price*)

Note*: In applicable scenarios
Step 3 - Data Sources
Primary Research
- Web Analytics
- Survey Reports
- Research Institute
- Latest Research Reports
- Opinion Leaders
Secondary Research
- Annual Reports
- White Paper
- Latest Press Release
- Industry Association
- Paid Database
- Investor Presentations

Step 4 - Data Triangulation
Involves using different sources of information in order to increase the validity of a study
These sources are likely to be stakeholders in a program - participants, other researchers, program staff, other community members, and so on.
Then we put all data in single framework & apply various statistical tools to find out the dynamic on the market.
During the analysis stage, feedback from the stakeholder groups would be compared to determine areas of agreement as well as areas of divergence

