
Key Insights
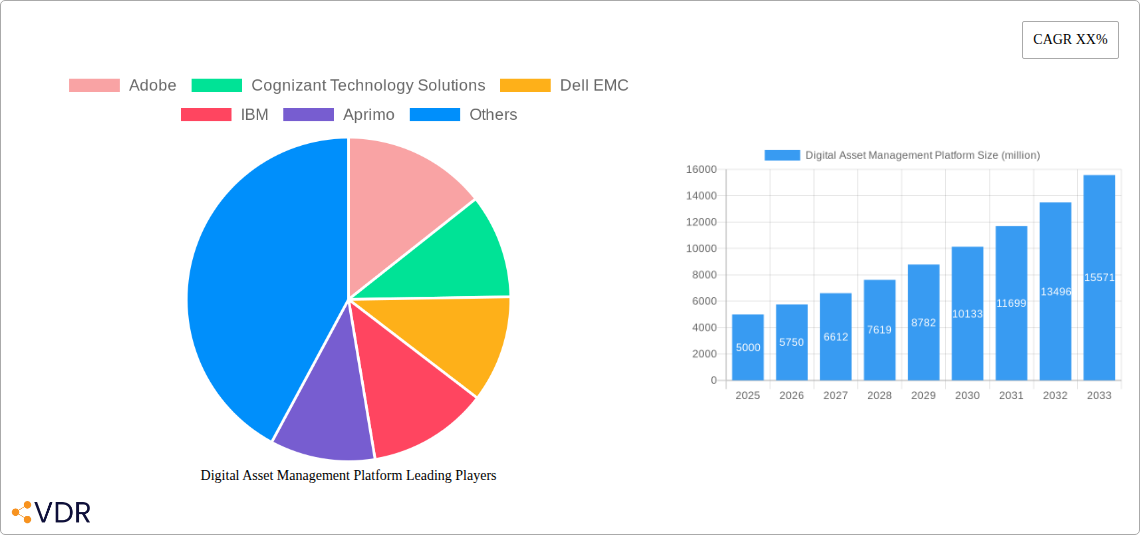
The Digital Asset Management (DAM) platform market is experiencing robust growth, driven by the increasing need for efficient content management and distribution across organizations. The market, estimated at $5 billion in 2025, is projected to expand at a Compound Annual Growth Rate (CAGR) of 15% from 2025 to 2033, reaching approximately $15 billion by 2033. This significant expansion is fueled by several key factors. Firstly, the explosion of digital content across various formats necessitates a centralized system for storage, organization, and retrieval. Secondly, the growing adoption of cloud-based solutions is offering scalability and cost-effectiveness to businesses of all sizes. Thirdly, the increasing demand for enhanced brand consistency and efficient marketing campaigns is driving the adoption of DAM platforms for streamlined content workflows. Major players like Adobe, IBM, and Cognizant are actively expanding their offerings, fueling competition and innovation within the market. However, challenges such as integration complexities with existing systems and concerns around data security and compliance remain as restraints to market growth.
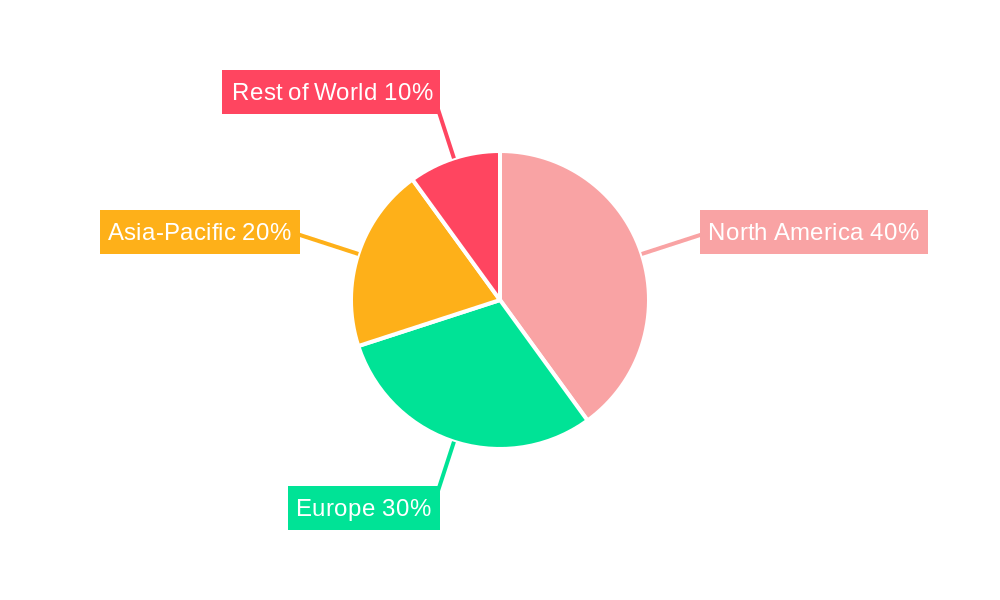
The segmentation of the DAM market reveals diverse applications across various industries, including marketing, media, and e-commerce. The increasing adoption of artificial intelligence (AI) and machine learning (ML) technologies for automated tagging, metadata generation, and content analysis is transforming the capabilities of DAM platforms. This automation enhances efficiency and improves search functionality within vast content repositories. The geographic distribution of the market indicates a strong presence in North America and Europe, with significant growth potential in emerging markets like Asia-Pacific fueled by increasing digital adoption and the growing need for effective content management strategies. The competitive landscape is characterized by a mix of established players and emerging vendors, resulting in a dynamic market with continuous innovation and new feature releases. This competitive pressure fosters the development of more sophisticated and user-friendly DAM solutions.
Digital Asset Management (DAM) Platform Market Report: 2019-2033
This comprehensive report provides an in-depth analysis of the Digital Asset Management (DAM) Platform market, encompassing market dynamics, growth trends, regional dominance, product landscape, key players, and future outlook. The study period spans 2019-2033, with 2025 as the base and estimated year. The forecast period covers 2025-2033, and the historical period is 2019-2024. This report is invaluable for industry professionals, investors, and strategic decision-makers seeking a thorough understanding of this rapidly evolving market. The parent market is Enterprise Content Management (ECM) and the child market includes Marketing Asset Management (MAM) and Media Asset Management (MAM).
Digital Asset Management Platform Market Dynamics & Structure
The Digital Asset Management (DAM) Platform market is characterized by moderate concentration, with a few major players holding significant market share, while numerous smaller players compete for niche segments. Market size in 2025 is estimated at $xx billion. The market is driven by increasing digital content creation and the need for efficient content organization, distribution, and governance. Technological innovation, particularly in AI-powered features like automated tagging and content recognition, is a major growth driver. Regulatory frameworks concerning data privacy (e.g., GDPR) influence DAM platform development and adoption. Competitive substitutes include cloud storage solutions and file-sharing platforms, although DAM platforms offer superior features for managing and distributing assets across organizations. The end-user demographics are broad, spanning diverse industries like media & entertainment, marketing & advertising, healthcare, and manufacturing. M&A activity is notable, with larger players acquiring smaller specialized DAM firms to expand their feature sets and market reach. In the past five years, approximately xx M&A deals were observed.
- Market Concentration: Moderately concentrated, with top 5 players holding approximately xx% market share in 2025.
- Technological Innovation: AI-powered features, automation, and integration with other enterprise software driving growth.
- Regulatory Frameworks: GDPR and similar regulations impact data security and compliance features.
- Competitive Substitutes: Cloud storage and file-sharing platforms offer limited functionality.
- End-User Demographics: Diverse industries including media, marketing, healthcare, and manufacturing.
- M&A Trends: Consistent activity with larger firms consolidating the market.
Digital Asset Management Platform Growth Trends & Insights
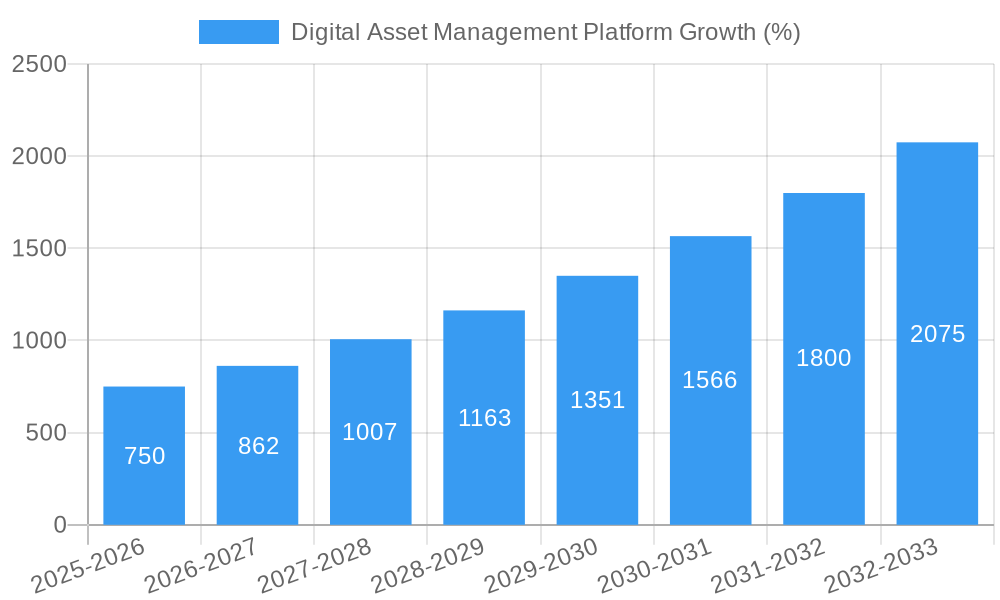
The DAM platform market demonstrates robust growth, fueled by increasing digital content volume, enhanced content governance requirements, and wider adoption across various industries. The market size expanded from $xx billion in 2019 to an estimated $xx billion in 2025, exhibiting a Compound Annual Growth Rate (CAGR) of xx% during the historical period. Market penetration within enterprise organizations is steadily increasing, although significant untapped potential remains, particularly in smaller and medium-sized businesses (SMBs). Technological disruptions, such as the rise of cloud-based solutions and the integration of AI, are reshaping the competitive landscape and driving innovation. Consumer behavior shifts towards personalized experiences and omnichannel marketing strategies are creating a higher demand for robust DAM solutions. By 2033, the market is projected to reach $xx billion, maintaining a healthy CAGR of xx% during the forecast period. Adoption rates are projected to increase significantly among SMBs.
Dominant Regions, Countries, or Segments in Digital Asset Management Platform
North America currently holds the largest market share in the DAM platform market, driven by factors such as early adoption of digital technologies, high spending power, and a robust presence of major DAM vendors. Europe follows closely, with strong growth potential in the next decade. The Asia-Pacific region is witnessing rapid expansion, fueled by increasing digitalization across various industries and a growing number of tech-savvy businesses. Within the segments, the marketing and advertising industry currently holds the largest share of the DAM platform market, owing to the high volume of digital assets used for marketing campaigns and content distribution.
- North America: High adoption rates, large market size, and presence of major vendors.
- Europe: Strong growth trajectory driven by digital transformation across industries.
- Asia-Pacific: Rapid expansion fueled by increasing digitalization and tech adoption.
- Marketing & Advertising: Largest segment due to high digital asset volume and usage.
- Media & Entertainment: High reliance on digital content management and distribution.
Digital Asset Management Platform Product Landscape
The DAM platform market offers a wide range of solutions, from cloud-based SaaS offerings to on-premise deployments. Product innovations include AI-powered features for automatic metadata tagging, sophisticated search functionality, improved version control, and enhanced collaboration tools. Key performance metrics include asset upload speed, search accuracy, user adoption rates, and integration capabilities. Unique selling propositions focus on ease of use, scalability, security, and integration with other enterprise systems. Recent advancements include the integration of blockchain technology for enhanced security and provenance tracking of digital assets.
Key Drivers, Barriers & Challenges in Digital Asset Management Platform
Key Drivers:
- The rising volume of digital assets necessitates efficient management systems.
- The need for enhanced content governance and compliance drives demand.
- Technological advancements (AI, cloud computing) enhance DAM platform capabilities.
- The growing importance of brand consistency across all channels.
Key Challenges & Restraints:
- High initial investment costs for enterprise deployments can be a barrier to entry for some companies.
- Integration with legacy systems can pose complexity and increase costs.
- Data security and privacy concerns, particularly for sensitive assets, remain critical.
- Competition from alternative solutions including cloud storage and file-sharing platforms. The impact is estimated at a xx% reduction in potential market share annually.
Emerging Opportunities in Digital Asset Management Platform
- Growing demand for DAM solutions in emerging markets presents significant opportunities.
- Integration with emerging technologies like the metaverse and VR/AR offers untapped potential.
- Increasing focus on personalization and omnichannel marketing requires sophisticated DAM functionalities.
- Development of specialized DAM solutions for specific industries (e.g., healthcare, manufacturing) is a key area for growth.
Growth Accelerators in the Digital Asset Management Platform Industry
Strategic partnerships between DAM vendors and other technology providers facilitate seamless integration and enhance the overall value proposition. Technological breakthroughs like AI-powered automation and advanced analytics significantly improve efficiency and ROI. Market expansion strategies targeting untapped segments like SMBs are proving critical for sustained growth. The development of specialized vertical solutions tailored to unique industry needs drives market penetration.
Key Players Shaping the Digital Asset Management Platform Market
- Adobe
- Cognizant Technology Solutions
- Dell EMC
- IBM
- Aprimo
- Oracle
- Northplains
- Nuxeo
- OpenText
- MediaValet
- Canto
- Celum
- Bynder
- Bright (Asset Bank)
- Extensis
- Brandmaster
- Qbank
- Censhare
- Cloudinary
- Widen
- Wedia
- Brandfolder
- Percolate Industries
- IntelligenceBank
Notable Milestones in Digital Asset Management Platform Sector
- 2020-Q3: Adobe launches new AI-powered features in its DAM solution.
- 2021-Q1: IBM announces strategic partnership with a leading DAM vendor.
- 2022-Q4: Significant M&A activity among smaller DAM platform providers.
- 2023-Q2: New regulatory compliance mandates boost demand for secure DAM solutions.
- 2024-Q1: Introduction of several blockchain-enabled DAM platforms.
In-Depth Digital Asset Management Platform Market Outlook
The DAM platform market is poised for continued strong growth, driven by technological advancements, increasing digital content creation, and heightened demand for efficient content management and distribution. Strategic opportunities abound for vendors focusing on innovation, integration, security, and specialized solutions for various industries. The market's future potential is substantial, especially in developing economies and in leveraging emerging technologies to create new value propositions. The focus on user experience and providing seamless integrations across various business processes will be key differentiators in the competitive landscape.
Digital Asset Management Platform Segmentation
-
1. Application
- 1.1. Brand Management System
- 1.2. Library or Archive
- 1.3. Production Management Systems
-
2. Types
- 2.1. Cloud Based
- 2.2. On-Premise
Digital Asset Management Platform Segmentation By Geography
-
1. North America
- 1.1. United States
- 1.2. Canada
- 1.3. Mexico
-
2. South America
- 2.1. Brazil
- 2.2. Argentina
- 2.3. Rest of South America
-
3. Europe
- 3.1. United Kingdom
- 3.2. Germany
- 3.3. France
- 3.4. Italy
- 3.5. Spain
- 3.6. Russia
- 3.7. Benelux
- 3.8. Nordics
- 3.9. Rest of Europe
-
4. Middle East & Africa
- 4.1. Turkey
- 4.2. Israel
- 4.3. GCC
- 4.4. North Africa
- 4.5. South Africa
- 4.6. Rest of Middle East & Africa
-
5. Asia Pacific
- 5.1. China
- 5.2. India
- 5.3. Japan
- 5.4. South Korea
- 5.5. ASEAN
- 5.6. Oceania
- 5.7. Rest of Asia Pacific
Digital Asset Management Platform REPORT HIGHLIGHTS
| Aspects | Details |
|---|---|
| Study Period | 2019-2033 |
| Base Year | 2024 |
| Estimated Year | 2025 |
| Forecast Period | 2025-2033 |
| Historical Period | 2019-2024 |
| Growth Rate | CAGR of XX% from 2019-2033 |
| Segmentation |
|
Table of Contents
- 1. Introduction
- 1.1. Research Scope
- 1.2. Market Segmentation
- 1.3. Research Methodology
- 1.4. Definitions and Assumptions
- 2. Executive Summary
- 2.1. Introduction
- 3. Market Dynamics
- 3.1. Introduction
- 3.2. Market Drivers
- 3.3. Market Restrains
- 3.4. Market Trends
- 4. Market Factor Analysis
- 4.1. Porters Five Forces
- 4.2. Supply/Value Chain
- 4.3. PESTEL analysis
- 4.4. Market Entropy
- 4.5. Patent/Trademark Analysis
- 5. Global Digital Asset Management Platform Analysis, Insights and Forecast, 2019-2031
- 5.1. Market Analysis, Insights and Forecast - by Application
- 5.1.1. Brand Management System
- 5.1.2. Library or Archive
- 5.1.3. Production Management Systems
- 5.2. Market Analysis, Insights and Forecast - by Types
- 5.2.1. Cloud Based
- 5.2.2. On-Premise
- 5.3. Market Analysis, Insights and Forecast - by Region
- 5.3.1. North America
- 5.3.2. South America
- 5.3.3. Europe
- 5.3.4. Middle East & Africa
- 5.3.5. Asia Pacific
- 5.1. Market Analysis, Insights and Forecast - by Application
- 6. North America Digital Asset Management Platform Analysis, Insights and Forecast, 2019-2031
- 6.1. Market Analysis, Insights and Forecast - by Application
- 6.1.1. Brand Management System
- 6.1.2. Library or Archive
- 6.1.3. Production Management Systems
- 6.2. Market Analysis, Insights and Forecast - by Types
- 6.2.1. Cloud Based
- 6.2.2. On-Premise
- 6.1. Market Analysis, Insights and Forecast - by Application
- 7. South America Digital Asset Management Platform Analysis, Insights and Forecast, 2019-2031
- 7.1. Market Analysis, Insights and Forecast - by Application
- 7.1.1. Brand Management System
- 7.1.2. Library or Archive
- 7.1.3. Production Management Systems
- 7.2. Market Analysis, Insights and Forecast - by Types
- 7.2.1. Cloud Based
- 7.2.2. On-Premise
- 7.1. Market Analysis, Insights and Forecast - by Application
- 8. Europe Digital Asset Management Platform Analysis, Insights and Forecast, 2019-2031
- 8.1. Market Analysis, Insights and Forecast - by Application
- 8.1.1. Brand Management System
- 8.1.2. Library or Archive
- 8.1.3. Production Management Systems
- 8.2. Market Analysis, Insights and Forecast - by Types
- 8.2.1. Cloud Based
- 8.2.2. On-Premise
- 8.1. Market Analysis, Insights and Forecast - by Application
- 9. Middle East & Africa Digital Asset Management Platform Analysis, Insights and Forecast, 2019-2031
- 9.1. Market Analysis, Insights and Forecast - by Application
- 9.1.1. Brand Management System
- 9.1.2. Library or Archive
- 9.1.3. Production Management Systems
- 9.2. Market Analysis, Insights and Forecast - by Types
- 9.2.1. Cloud Based
- 9.2.2. On-Premise
- 9.1. Market Analysis, Insights and Forecast - by Application
- 10. Asia Pacific Digital Asset Management Platform Analysis, Insights and Forecast, 2019-2031
- 10.1. Market Analysis, Insights and Forecast - by Application
- 10.1.1. Brand Management System
- 10.1.2. Library or Archive
- 10.1.3. Production Management Systems
- 10.2. Market Analysis, Insights and Forecast - by Types
- 10.2.1. Cloud Based
- 10.2.2. On-Premise
- 10.1. Market Analysis, Insights and Forecast - by Application
- 11. Competitive Analysis
- 11.1. Global Market Share Analysis 2024
- 11.2. Company Profiles
- 11.2.1 Adobe
- 11.2.1.1. Overview
- 11.2.1.2. Products
- 11.2.1.3. SWOT Analysis
- 11.2.1.4. Recent Developments
- 11.2.1.5. Financials (Based on Availability)
- 11.2.2 Cognizant Technology Solutions
- 11.2.2.1. Overview
- 11.2.2.2. Products
- 11.2.2.3. SWOT Analysis
- 11.2.2.4. Recent Developments
- 11.2.2.5. Financials (Based on Availability)
- 11.2.3 Dell EMC
- 11.2.3.1. Overview
- 11.2.3.2. Products
- 11.2.3.3. SWOT Analysis
- 11.2.3.4. Recent Developments
- 11.2.3.5. Financials (Based on Availability)
- 11.2.4 IBM
- 11.2.4.1. Overview
- 11.2.4.2. Products
- 11.2.4.3. SWOT Analysis
- 11.2.4.4. Recent Developments
- 11.2.4.5. Financials (Based on Availability)
- 11.2.5 Aprimo
- 11.2.5.1. Overview
- 11.2.5.2. Products
- 11.2.5.3. SWOT Analysis
- 11.2.5.4. Recent Developments
- 11.2.5.5. Financials (Based on Availability)
- 11.2.6 Oracle
- 11.2.6.1. Overview
- 11.2.6.2. Products
- 11.2.6.3. SWOT Analysis
- 11.2.6.4. Recent Developments
- 11.2.6.5. Financials (Based on Availability)
- 11.2.7 Northplains
- 11.2.7.1. Overview
- 11.2.7.2. Products
- 11.2.7.3. SWOT Analysis
- 11.2.7.4. Recent Developments
- 11.2.7.5. Financials (Based on Availability)
- 11.2.8 Nuxeo
- 11.2.8.1. Overview
- 11.2.8.2. Products
- 11.2.8.3. SWOT Analysis
- 11.2.8.4. Recent Developments
- 11.2.8.5. Financials (Based on Availability)
- 11.2.9 OpenText
- 11.2.9.1. Overview
- 11.2.9.2. Products
- 11.2.9.3. SWOT Analysis
- 11.2.9.4. Recent Developments
- 11.2.9.5. Financials (Based on Availability)
- 11.2.10 MediaValet
- 11.2.10.1. Overview
- 11.2.10.2. Products
- 11.2.10.3. SWOT Analysis
- 11.2.10.4. Recent Developments
- 11.2.10.5. Financials (Based on Availability)
- 11.2.11 Canto
- 11.2.11.1. Overview
- 11.2.11.2. Products
- 11.2.11.3. SWOT Analysis
- 11.2.11.4. Recent Developments
- 11.2.11.5. Financials (Based on Availability)
- 11.2.12 Celum
- 11.2.12.1. Overview
- 11.2.12.2. Products
- 11.2.12.3. SWOT Analysis
- 11.2.12.4. Recent Developments
- 11.2.12.5. Financials (Based on Availability)
- 11.2.13 Bynder
- 11.2.13.1. Overview
- 11.2.13.2. Products
- 11.2.13.3. SWOT Analysis
- 11.2.13.4. Recent Developments
- 11.2.13.5. Financials (Based on Availability)
- 11.2.14 Bright (Asset Bank)
- 11.2.14.1. Overview
- 11.2.14.2. Products
- 11.2.14.3. SWOT Analysis
- 11.2.14.4. Recent Developments
- 11.2.14.5. Financials (Based on Availability)
- 11.2.15 Extensis
- 11.2.15.1. Overview
- 11.2.15.2. Products
- 11.2.15.3. SWOT Analysis
- 11.2.15.4. Recent Developments
- 11.2.15.5. Financials (Based on Availability)
- 11.2.16 Brandmaster
- 11.2.16.1. Overview
- 11.2.16.2. Products
- 11.2.16.3. SWOT Analysis
- 11.2.16.4. Recent Developments
- 11.2.16.5. Financials (Based on Availability)
- 11.2.17 Qbank
- 11.2.17.1. Overview
- 11.2.17.2. Products
- 11.2.17.3. SWOT Analysis
- 11.2.17.4. Recent Developments
- 11.2.17.5. Financials (Based on Availability)
- 11.2.18 Censhare
- 11.2.18.1. Overview
- 11.2.18.2. Products
- 11.2.18.3. SWOT Analysis
- 11.2.18.4. Recent Developments
- 11.2.18.5. Financials (Based on Availability)
- 11.2.19 Cloudinary
- 11.2.19.1. Overview
- 11.2.19.2. Products
- 11.2.19.3. SWOT Analysis
- 11.2.19.4. Recent Developments
- 11.2.19.5. Financials (Based on Availability)
- 11.2.20 Widen
- 11.2.20.1. Overview
- 11.2.20.2. Products
- 11.2.20.3. SWOT Analysis
- 11.2.20.4. Recent Developments
- 11.2.20.5. Financials (Based on Availability)
- 11.2.21 Wedia
- 11.2.21.1. Overview
- 11.2.21.2. Products
- 11.2.21.3. SWOT Analysis
- 11.2.21.4. Recent Developments
- 11.2.21.5. Financials (Based on Availability)
- 11.2.22 Brandfolder
- 11.2.22.1. Overview
- 11.2.22.2. Products
- 11.2.22.3. SWOT Analysis
- 11.2.22.4. Recent Developments
- 11.2.22.5. Financials (Based on Availability)
- 11.2.23 Percolate Industries
- 11.2.23.1. Overview
- 11.2.23.2. Products
- 11.2.23.3. SWOT Analysis
- 11.2.23.4. Recent Developments
- 11.2.23.5. Financials (Based on Availability)
- 11.2.24 IntelligenceBank
- 11.2.24.1. Overview
- 11.2.24.2. Products
- 11.2.24.3. SWOT Analysis
- 11.2.24.4. Recent Developments
- 11.2.24.5. Financials (Based on Availability)
- 11.2.1 Adobe
List of Figures
- Figure 1: Global Digital Asset Management Platform Revenue Breakdown (million, %) by Region 2024 & 2032
- Figure 2: North America Digital Asset Management Platform Revenue (million), by Application 2024 & 2032
- Figure 3: North America Digital Asset Management Platform Revenue Share (%), by Application 2024 & 2032
- Figure 4: North America Digital Asset Management Platform Revenue (million), by Types 2024 & 2032
- Figure 5: North America Digital Asset Management Platform Revenue Share (%), by Types 2024 & 2032
- Figure 6: North America Digital Asset Management Platform Revenue (million), by Country 2024 & 2032
- Figure 7: North America Digital Asset Management Platform Revenue Share (%), by Country 2024 & 2032
- Figure 8: South America Digital Asset Management Platform Revenue (million), by Application 2024 & 2032
- Figure 9: South America Digital Asset Management Platform Revenue Share (%), by Application 2024 & 2032
- Figure 10: South America Digital Asset Management Platform Revenue (million), by Types 2024 & 2032
- Figure 11: South America Digital Asset Management Platform Revenue Share (%), by Types 2024 & 2032
- Figure 12: South America Digital Asset Management Platform Revenue (million), by Country 2024 & 2032
- Figure 13: South America Digital Asset Management Platform Revenue Share (%), by Country 2024 & 2032
- Figure 14: Europe Digital Asset Management Platform Revenue (million), by Application 2024 & 2032
- Figure 15: Europe Digital Asset Management Platform Revenue Share (%), by Application 2024 & 2032
- Figure 16: Europe Digital Asset Management Platform Revenue (million), by Types 2024 & 2032
- Figure 17: Europe Digital Asset Management Platform Revenue Share (%), by Types 2024 & 2032
- Figure 18: Europe Digital Asset Management Platform Revenue (million), by Country 2024 & 2032
- Figure 19: Europe Digital Asset Management Platform Revenue Share (%), by Country 2024 & 2032
- Figure 20: Middle East & Africa Digital Asset Management Platform Revenue (million), by Application 2024 & 2032
- Figure 21: Middle East & Africa Digital Asset Management Platform Revenue Share (%), by Application 2024 & 2032
- Figure 22: Middle East & Africa Digital Asset Management Platform Revenue (million), by Types 2024 & 2032
- Figure 23: Middle East & Africa Digital Asset Management Platform Revenue Share (%), by Types 2024 & 2032
- Figure 24: Middle East & Africa Digital Asset Management Platform Revenue (million), by Country 2024 & 2032
- Figure 25: Middle East & Africa Digital Asset Management Platform Revenue Share (%), by Country 2024 & 2032
- Figure 26: Asia Pacific Digital Asset Management Platform Revenue (million), by Application 2024 & 2032
- Figure 27: Asia Pacific Digital Asset Management Platform Revenue Share (%), by Application 2024 & 2032
- Figure 28: Asia Pacific Digital Asset Management Platform Revenue (million), by Types 2024 & 2032
- Figure 29: Asia Pacific Digital Asset Management Platform Revenue Share (%), by Types 2024 & 2032
- Figure 30: Asia Pacific Digital Asset Management Platform Revenue (million), by Country 2024 & 2032
- Figure 31: Asia Pacific Digital Asset Management Platform Revenue Share (%), by Country 2024 & 2032
List of Tables
- Table 1: Global Digital Asset Management Platform Revenue million Forecast, by Region 2019 & 2032
- Table 2: Global Digital Asset Management Platform Revenue million Forecast, by Application 2019 & 2032
- Table 3: Global Digital Asset Management Platform Revenue million Forecast, by Types 2019 & 2032
- Table 4: Global Digital Asset Management Platform Revenue million Forecast, by Region 2019 & 2032
- Table 5: Global Digital Asset Management Platform Revenue million Forecast, by Application 2019 & 2032
- Table 6: Global Digital Asset Management Platform Revenue million Forecast, by Types 2019 & 2032
- Table 7: Global Digital Asset Management Platform Revenue million Forecast, by Country 2019 & 2032
- Table 8: United States Digital Asset Management Platform Revenue (million) Forecast, by Application 2019 & 2032
- Table 9: Canada Digital Asset Management Platform Revenue (million) Forecast, by Application 2019 & 2032
- Table 10: Mexico Digital Asset Management Platform Revenue (million) Forecast, by Application 2019 & 2032
- Table 11: Global Digital Asset Management Platform Revenue million Forecast, by Application 2019 & 2032
- Table 12: Global Digital Asset Management Platform Revenue million Forecast, by Types 2019 & 2032
- Table 13: Global Digital Asset Management Platform Revenue million Forecast, by Country 2019 & 2032
- Table 14: Brazil Digital Asset Management Platform Revenue (million) Forecast, by Application 2019 & 2032
- Table 15: Argentina Digital Asset Management Platform Revenue (million) Forecast, by Application 2019 & 2032
- Table 16: Rest of South America Digital Asset Management Platform Revenue (million) Forecast, by Application 2019 & 2032
- Table 17: Global Digital Asset Management Platform Revenue million Forecast, by Application 2019 & 2032
- Table 18: Global Digital Asset Management Platform Revenue million Forecast, by Types 2019 & 2032
- Table 19: Global Digital Asset Management Platform Revenue million Forecast, by Country 2019 & 2032
- Table 20: United Kingdom Digital Asset Management Platform Revenue (million) Forecast, by Application 2019 & 2032
- Table 21: Germany Digital Asset Management Platform Revenue (million) Forecast, by Application 2019 & 2032
- Table 22: France Digital Asset Management Platform Revenue (million) Forecast, by Application 2019 & 2032
- Table 23: Italy Digital Asset Management Platform Revenue (million) Forecast, by Application 2019 & 2032
- Table 24: Spain Digital Asset Management Platform Revenue (million) Forecast, by Application 2019 & 2032
- Table 25: Russia Digital Asset Management Platform Revenue (million) Forecast, by Application 2019 & 2032
- Table 26: Benelux Digital Asset Management Platform Revenue (million) Forecast, by Application 2019 & 2032
- Table 27: Nordics Digital Asset Management Platform Revenue (million) Forecast, by Application 2019 & 2032
- Table 28: Rest of Europe Digital Asset Management Platform Revenue (million) Forecast, by Application 2019 & 2032
- Table 29: Global Digital Asset Management Platform Revenue million Forecast, by Application 2019 & 2032
- Table 30: Global Digital Asset Management Platform Revenue million Forecast, by Types 2019 & 2032
- Table 31: Global Digital Asset Management Platform Revenue million Forecast, by Country 2019 & 2032
- Table 32: Turkey Digital Asset Management Platform Revenue (million) Forecast, by Application 2019 & 2032
- Table 33: Israel Digital Asset Management Platform Revenue (million) Forecast, by Application 2019 & 2032
- Table 34: GCC Digital Asset Management Platform Revenue (million) Forecast, by Application 2019 & 2032
- Table 35: North Africa Digital Asset Management Platform Revenue (million) Forecast, by Application 2019 & 2032
- Table 36: South Africa Digital Asset Management Platform Revenue (million) Forecast, by Application 2019 & 2032
- Table 37: Rest of Middle East & Africa Digital Asset Management Platform Revenue (million) Forecast, by Application 2019 & 2032
- Table 38: Global Digital Asset Management Platform Revenue million Forecast, by Application 2019 & 2032
- Table 39: Global Digital Asset Management Platform Revenue million Forecast, by Types 2019 & 2032
- Table 40: Global Digital Asset Management Platform Revenue million Forecast, by Country 2019 & 2032
- Table 41: China Digital Asset Management Platform Revenue (million) Forecast, by Application 2019 & 2032
- Table 42: India Digital Asset Management Platform Revenue (million) Forecast, by Application 2019 & 2032
- Table 43: Japan Digital Asset Management Platform Revenue (million) Forecast, by Application 2019 & 2032
- Table 44: South Korea Digital Asset Management Platform Revenue (million) Forecast, by Application 2019 & 2032
- Table 45: ASEAN Digital Asset Management Platform Revenue (million) Forecast, by Application 2019 & 2032
- Table 46: Oceania Digital Asset Management Platform Revenue (million) Forecast, by Application 2019 & 2032
- Table 47: Rest of Asia Pacific Digital Asset Management Platform Revenue (million) Forecast, by Application 2019 & 2032
Frequently Asked Questions
1. What is the projected Compound Annual Growth Rate (CAGR) of the Digital Asset Management Platform?
The projected CAGR is approximately XX%.
2. Which companies are prominent players in the Digital Asset Management Platform?
Key companies in the market include Adobe, Cognizant Technology Solutions, Dell EMC, IBM, Aprimo, Oracle, Northplains, Nuxeo, OpenText, MediaValet, Canto, Celum, Bynder, Bright (Asset Bank), Extensis, Brandmaster, Qbank, Censhare, Cloudinary, Widen, Wedia, Brandfolder, Percolate Industries, IntelligenceBank.
3. What are the main segments of the Digital Asset Management Platform?
The market segments include Application, Types.
4. Can you provide details about the market size?
The market size is estimated to be USD XXX million as of 2022.
5. What are some drivers contributing to market growth?
N/A
6. What are the notable trends driving market growth?
N/A
7. Are there any restraints impacting market growth?
N/A
8. Can you provide examples of recent developments in the market?
N/A
9. What pricing options are available for accessing the report?
Pricing options include single-user, multi-user, and enterprise licenses priced at USD 2900.00, USD 4350.00, and USD 5800.00 respectively.
10. Is the market size provided in terms of value or volume?
The market size is provided in terms of value, measured in million.
11. Are there any specific market keywords associated with the report?
Yes, the market keyword associated with the report is "Digital Asset Management Platform," which aids in identifying and referencing the specific market segment covered.
12. How do I determine which pricing option suits my needs best?
The pricing options vary based on user requirements and access needs. Individual users may opt for single-user licenses, while businesses requiring broader access may choose multi-user or enterprise licenses for cost-effective access to the report.
13. Are there any additional resources or data provided in the Digital Asset Management Platform report?
While the report offers comprehensive insights, it's advisable to review the specific contents or supplementary materials provided to ascertain if additional resources or data are available.
14. How can I stay updated on further developments or reports in the Digital Asset Management Platform?
To stay informed about further developments, trends, and reports in the Digital Asset Management Platform, consider subscribing to industry newsletters, following relevant companies and organizations, or regularly checking reputable industry news sources and publications.
Methodology
Step 1 - Identification of Relevant Samples Size from Population Database


Step 2 - Approaches for Defining Global Market Size (Value, Volume* & Price*)

Note*: In applicable scenarios
Step 3 - Data Sources
Primary Research
- Web Analytics
- Survey Reports
- Research Institute
- Latest Research Reports
- Opinion Leaders
Secondary Research
- Annual Reports
- White Paper
- Latest Press Release
- Industry Association
- Paid Database
- Investor Presentations

Step 4 - Data Triangulation
Involves using different sources of information in order to increase the validity of a study
These sources are likely to be stakeholders in a program - participants, other researchers, program staff, other community members, and so on.
Then we put all data in single framework & apply various statistical tools to find out the dynamic on the market.
During the analysis stage, feedback from the stakeholder groups would be compared to determine areas of agreement as well as areas of divergence


