

Key Insights
The data center blade server market is experiencing substantial expansion, driven by the escalating demand for high-density computing, enhanced energy efficiency, and optimized infrastructure footprint within global data centers. This growth is propelled by the widespread adoption of cloud computing, big data analytics, and artificial intelligence (AI), all of which necessitate robust processing power and efficient resource management. Key market drivers include the integration of higher-performance processors, increased network bandwidth, and advanced technologies like NVMe storage and 5G connectivity. While initial capital expenditure may be higher than for traditional rack servers, blade servers offer significant long-term operational cost savings through reduced power consumption and superior space utilization, making them a compelling choice for enterprises and cloud providers. Competitive dynamics are shaped by ongoing innovation in server architectures, advancements in virtualization, and the development of specialized blade servers tailored for specific workloads. Leading vendors such as Cisco, Dell, Hewlett-Packard, Lenovo, and Fujitsu are actively investing in research and development to elevate performance, efficiency, and feature sets, cultivating a vibrant and competitive market.
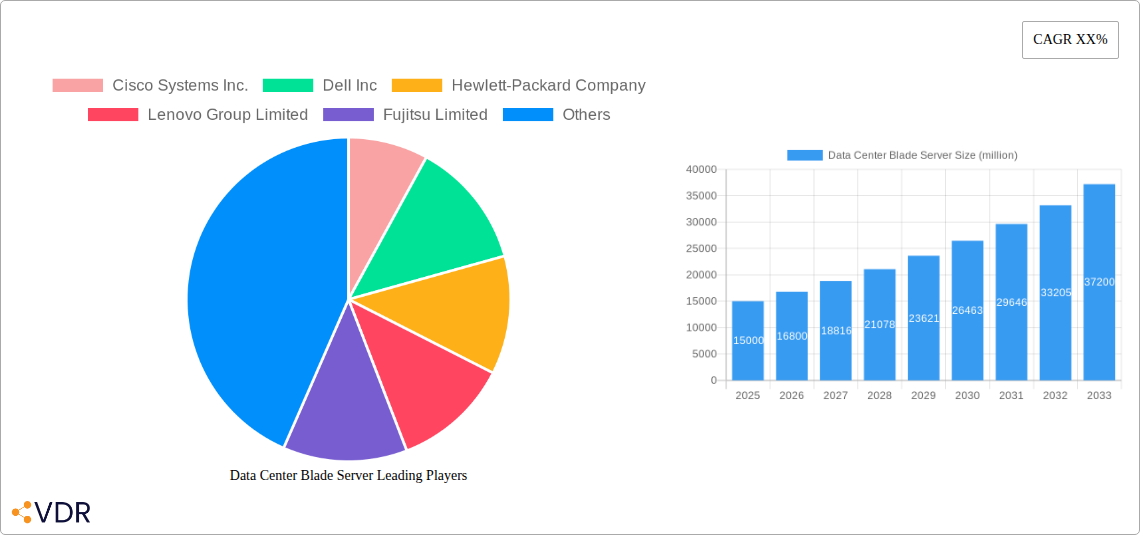
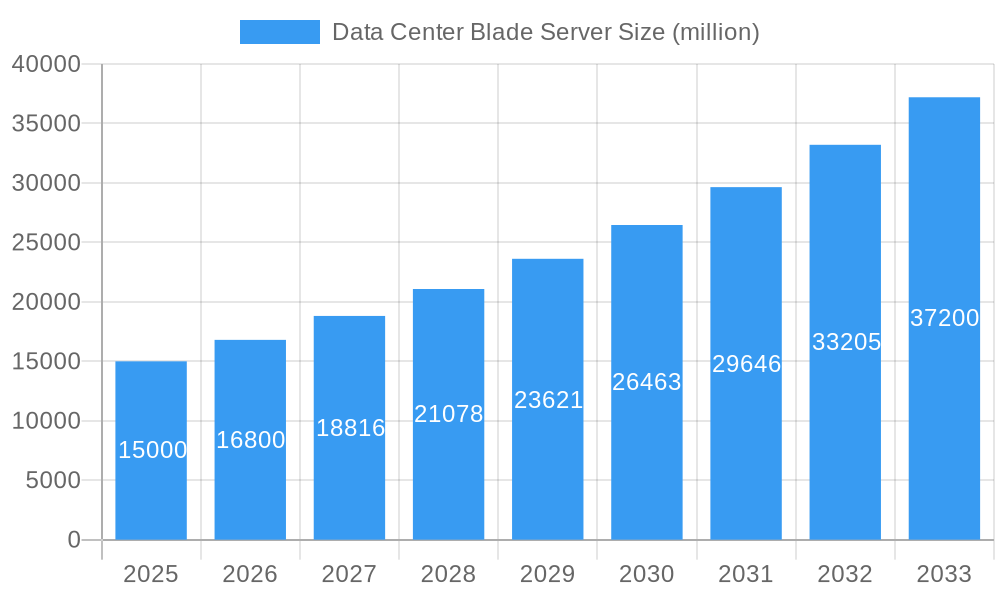
Data Center Blade Server Market Size (In Billion)
For the forecast period of 2025-2033, significant market growth is anticipated, supported by the sustained adoption of cloud services and the growing requirement for scalable and adaptable data center infrastructure. The market is projected to achieve a Compound Annual Growth Rate (CAGR) of 9.01%, indicating consistent expansion fueled by continuous technological advancements and the persistent demand for superior processing capabilities. Challenges such as the complexity of blade server deployment and management, alongside potential vendor lock-in, remain. Nevertheless, the overall market outlook is highly favorable, presenting substantial growth opportunities across diverse segments and geographies. The market's trajectory is marked by a trend towards more standardized and interoperable architectures, thereby increasing the accessibility and appeal of blade servers to a wider user base. The global data center blade server market was valued at $21.374 billion in the base year of 2025 and is expected to grow significantly in the coming years.
Data Center Blade Server Company Market Share
Data Center Blade Server Market Report: 2019-2033
This comprehensive report provides an in-depth analysis of the global Data Center Blade Server market, encompassing historical data (2019-2024), current estimates (2025), and future forecasts (2025-2033). The report meticulously examines market dynamics, growth trends, regional segmentation, competitive landscape, and future opportunities, offering valuable insights for industry professionals, investors, and strategic decision-makers. The market is segmented by key players like Cisco Systems Inc., Dell Inc, Hewlett-Packard Company, Lenovo Group Limited, Fujitsu Limited, Hitachi Limited, NEC Corporation, and SGI Corporation. The study period covers 2019-2033, with 2025 as the base and estimated year.
Data Center Blade Server Market Dynamics & Structure
This section analyzes the competitive intensity, technological advancements, regulatory influences, and market trends within the data center blade server market. The global market size in 2025 is estimated at $XX million, with a projected CAGR of XX% during the forecast period. The market structure is moderately concentrated, with the top five players holding approximately XX% of the market share in 2025.
- Market Concentration: High, with key players driving innovation and market share.
- Technological Innovation Drivers: Advancements in processing power, virtualization, and energy efficiency.
- Regulatory Frameworks: Data privacy regulations and industry standards impact adoption and design.
- Competitive Product Substitutes: Rack servers and cloud computing pose competitive challenges.
- End-User Demographics: Large enterprises, hyperscale data centers, and cloud service providers dominate demand.
- M&A Trends: Consolidation through strategic acquisitions is expected to increase market concentration by XX% by 2033, with an estimated XX M&A deals during the forecast period. Significant barriers to entry include high R&D costs and specialized manufacturing expertise.
Data Center Blade Server Growth Trends & Insights
The data center blade server market has experienced significant growth, fueled by the increasing demand for high-density computing solutions and the rapid expansion of cloud computing infrastructure. The market size grew from $XX million in 2019 to an estimated $XX million in 2025, indicating a robust adoption rate, particularly in North America and Asia Pacific. Technological disruptions, such as the introduction of NVMe drives and advanced networking technologies, have accelerated this growth. The market is expected to continue its expansion, driven by the adoption of 5G networks, edge computing, and the growing need for high-performance computing in various sectors including finance, healthcare, and manufacturing. The CAGR during the forecast period is projected to be XX%, resulting in a market size of $XX million by 2033. Consumer behavior shifts towards digitalization and data-driven decision-making further fuel this growth.
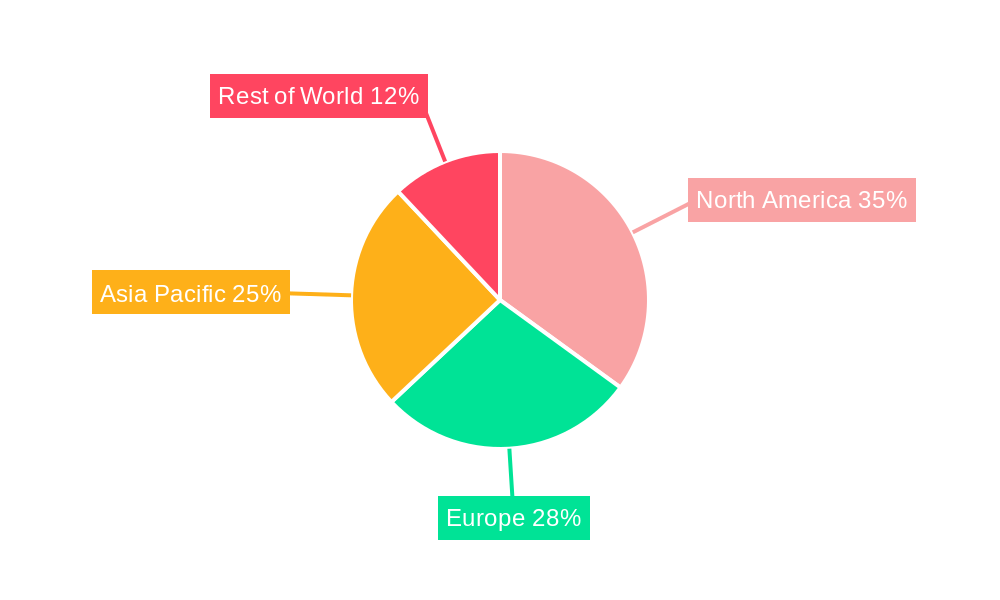
Dominant Regions, Countries, or Segments in Data Center Blade Server
North America currently holds the largest market share, driven by the presence of major technology companies and a well-established IT infrastructure. However, the Asia-Pacific region is projected to witness the fastest growth during the forecast period, fueled by increasing investments in data center infrastructure and the expanding adoption of cloud services.
- North America: High adoption rates due to mature IT infrastructure and presence of major data centers.
- Asia-Pacific: Fastest growth driven by rapid economic development and increasing digitalization.
- Europe: Steady growth driven by governmental initiatives and enterprise adoption of cloud services.
Data Center Blade Server Product Landscape
Data center blade servers offer high density, efficient power usage, and shared resources, improving overall performance. Advancements in processing power (e.g., ARM-based processors), network connectivity (e.g., 400 Gigabit Ethernet), and storage technologies (e.g., NVMe SSDs) are driving product innovation. Key selling propositions include improved energy efficiency, reduced space requirements, and enhanced management capabilities.
Key Drivers, Barriers & Challenges in Data Center Blade Server
Key Drivers:
- The increasing demand for high-density computing solutions.
- The rapid growth of cloud computing and data center infrastructure.
- Advancements in server technologies, including faster processors and improved networking.
- Government initiatives promoting digital transformation.
Key Challenges:
- High initial investment costs for implementing blade server infrastructure.
- Complexity in managing and maintaining blade server systems.
- Competition from alternative technologies like rack-mount servers and cloud computing.
- Supply chain disruptions impacting component availability and pricing. The impact is estimated at XX% reduction in production during 2022-2023.
Emerging Opportunities in Data Center Blade Server
Emerging opportunities lie in the expanding adoption of edge computing, the increasing demand for AI and machine learning applications, and the growth of hyperscale data centers. Furthermore, innovative applications in sectors like healthcare and finance, coupled with the adoption of sustainable data center designs, present significant growth potential.
Growth Accelerators in the Data Center Blade Server Industry
Technological breakthroughs such as advancements in artificial intelligence (AI), machine learning (ML), and the Internet of Things (IoT) will drive substantial growth. Strategic partnerships and collaborations between technology providers and data center operators will enhance market penetration. Aggressive market expansion strategies targeting untapped markets, especially in developing economies, will further fuel market growth.
Key Players Shaping the Data Center Blade Server Market
Notable Milestones in Data Center Blade Server Sector
- 2020: Introduction of next-generation blade servers with enhanced processing power and energy efficiency by Dell.
- 2021: Cisco announces strategic partnership with a major cloud provider for blade server deployment.
- 2022: Significant investment in R&D for blade server technology by Hewlett-Packard.
- 2023: Lenovo launches a new line of sustainable blade servers.
In-Depth Data Center Blade Server Market Outlook
The data center blade server market is poised for continued growth, driven by the increasing demand for high-performance computing, cloud computing adoption, and the emergence of new technologies. Strategic opportunities exist for companies focusing on energy-efficient designs, advanced security features, and innovative applications. The market is expected to reach $XX million by 2033, representing a substantial increase from its current size. The focus on AI, ML, and Edge Computing will be key to market expansion.
Data Center Blade Server Segmentation
-
1. Application
- 1.1. Small Size Organization
- 1.2. Medium Size Organization
- 1.3. Large Size Organization
-
2. Types
- 2.1. Consulting Services
- 2.2. Installation and Support Services
- 2.3. Professional Services
Data Center Blade Server Segmentation By Geography
-
1. North America
- 1.1. United States
- 1.2. Canada
- 1.3. Mexico
-
2. South America
- 2.1. Brazil
- 2.2. Argentina
- 2.3. Rest of South America
-
3. Europe
- 3.1. United Kingdom
- 3.2. Germany
- 3.3. France
- 3.4. Italy
- 3.5. Spain
- 3.6. Russia
- 3.7. Benelux
- 3.8. Nordics
- 3.9. Rest of Europe
-
4. Middle East & Africa
- 4.1. Turkey
- 4.2. Israel
- 4.3. GCC
- 4.4. North Africa
- 4.5. South Africa
- 4.6. Rest of Middle East & Africa
-
5. Asia Pacific
- 5.1. China
- 5.2. India
- 5.3. Japan
- 5.4. South Korea
- 5.5. ASEAN
- 5.6. Oceania
- 5.7. Rest of Asia Pacific
Data Center Blade Server Regional Market Share
Geographic Coverage of Data Center Blade Server
Data Center Blade Server REPORT HIGHLIGHTS
| Aspects | Details |
|---|---|
| Study Period | 2020-2034 |
| Base Year | 2025 |
| Estimated Year | 2026 |
| Forecast Period | 2026-2034 |
| Historical Period | 2020-2025 |
| Growth Rate | CAGR of 9.01% from 2020-2034 |
| Segmentation |
|
Table of Contents
- 1. Introduction
- 1.1. Research Scope
- 1.2. Market Segmentation
- 1.3. Research Objective
- 1.4. Definitions and Assumptions
- 2. Executive Summary
- 2.1. Market Snapshot
- 3. Market Dynamics
- 3.1. Market Drivers
- 3.2. Market Restrains
- 3.3. Market Trends
- 3.4. Market Opportunities
- 4. Market Factor Analysis
- 4.1. Porters Five Forces
- 4.1.1. Bargaining Power of Suppliers
- 4.1.2. Bargaining Power of Buyers
- 4.1.3. Threat of New Entrants
- 4.1.4. Threat of Substitutes
- 4.1.5. Competitive Rivalry
- 4.2. PESTEL analysis
- 4.3. BCG Analysis
- 4.3.1. Stars (High Growth, High Market Share)
- 4.3.2. Cash Cows (Low Growth, High Market Share)
- 4.3.3. Question Mark (High Growth, Low Market Share)
- 4.3.4. Dogs (Low Growth, Low Market Share)
- 4.4. Ansoff Matrix Analysis
- 4.5. Supply Chain Analysis
- 4.6. Regulatory Landscape
- 4.7. Current Market Potential and Opportunity Assessment (TAM–SAM–SOM Framework)
- 4.8. VDR Analyst Note
- 4.1. Porters Five Forces
- 5. Market Analysis, Insights and Forecast 2021-2033
- 5.1. Market Analysis, Insights and Forecast - by Application
- 5.1.1. Small Size Organization
- 5.1.2. Medium Size Organization
- 5.1.3. Large Size Organization
- 5.2. Market Analysis, Insights and Forecast - by Types
- 5.2.1. Consulting Services
- 5.2.2. Installation and Support Services
- 5.2.3. Professional Services
- 5.3. Market Analysis, Insights and Forecast - by Region
- 5.3.1. North America
- 5.3.2. South America
- 5.3.3. Europe
- 5.3.4. Middle East & Africa
- 5.3.5. Asia Pacific
- 5.1. Market Analysis, Insights and Forecast - by Application
- 6. Global Data Center Blade Server Analysis, Insights and Forecast, 2021-2033
- 6.1. Market Analysis, Insights and Forecast - by Application
- 6.1.1. Small Size Organization
- 6.1.2. Medium Size Organization
- 6.1.3. Large Size Organization
- 6.2. Market Analysis, Insights and Forecast - by Types
- 6.2.1. Consulting Services
- 6.2.2. Installation and Support Services
- 6.2.3. Professional Services
- 6.1. Market Analysis, Insights and Forecast - by Application
- 7. North America Data Center Blade Server Analysis, Insights and Forecast, 2021-2033
- 7.1. Market Analysis, Insights and Forecast - by Application
- 7.1.1. Small Size Organization
- 7.1.2. Medium Size Organization
- 7.1.3. Large Size Organization
- 7.2. Market Analysis, Insights and Forecast - by Types
- 7.2.1. Consulting Services
- 7.2.2. Installation and Support Services
- 7.2.3. Professional Services
- 7.1. Market Analysis, Insights and Forecast - by Application
- 8. South America Data Center Blade Server Analysis, Insights and Forecast, 2021-2033
- 8.1. Market Analysis, Insights and Forecast - by Application
- 8.1.1. Small Size Organization
- 8.1.2. Medium Size Organization
- 8.1.3. Large Size Organization
- 8.2. Market Analysis, Insights and Forecast - by Types
- 8.2.1. Consulting Services
- 8.2.2. Installation and Support Services
- 8.2.3. Professional Services
- 8.1. Market Analysis, Insights and Forecast - by Application
- 9. Europe Data Center Blade Server Analysis, Insights and Forecast, 2021-2033
- 9.1. Market Analysis, Insights and Forecast - by Application
- 9.1.1. Small Size Organization
- 9.1.2. Medium Size Organization
- 9.1.3. Large Size Organization
- 9.2. Market Analysis, Insights and Forecast - by Types
- 9.2.1. Consulting Services
- 9.2.2. Installation and Support Services
- 9.2.3. Professional Services
- 9.1. Market Analysis, Insights and Forecast - by Application
- 10. Middle East & Africa Data Center Blade Server Analysis, Insights and Forecast, 2021-2033
- 10.1. Market Analysis, Insights and Forecast - by Application
- 10.1.1. Small Size Organization
- 10.1.2. Medium Size Organization
- 10.1.3. Large Size Organization
- 10.2. Market Analysis, Insights and Forecast - by Types
- 10.2.1. Consulting Services
- 10.2.2. Installation and Support Services
- 10.2.3. Professional Services
- 10.1. Market Analysis, Insights and Forecast - by Application
- 11. Asia Pacific Data Center Blade Server Analysis, Insights and Forecast, 2021-2033
- 11.1. Market Analysis, Insights and Forecast - by Application
- 11.1.1. Small Size Organization
- 11.1.2. Medium Size Organization
- 11.1.3. Large Size Organization
- 11.2. Market Analysis, Insights and Forecast - by Types
- 11.2.1. Consulting Services
- 11.2.2. Installation and Support Services
- 11.2.3. Professional Services
- 11.1. Market Analysis, Insights and Forecast - by Application
- 12. Competitive Analysis
- 12.1. Company Profiles
- 12.1.1 Cisco Systems Inc.
- 12.1.1.1. Company Overview
- 12.1.1.2. Products
- 12.1.1.3. Company Financials
- 12.1.1.4. SWOT Analysis
- 12.1.2 Dell Inc
- 12.1.2.1. Company Overview
- 12.1.2.2. Products
- 12.1.2.3. Company Financials
- 12.1.2.4. SWOT Analysis
- 12.1.3 Hewlett-Packard Company
- 12.1.3.1. Company Overview
- 12.1.3.2. Products
- 12.1.3.3. Company Financials
- 12.1.3.4. SWOT Analysis
- 12.1.4 Lenovo Group Limited
- 12.1.4.1. Company Overview
- 12.1.4.2. Products
- 12.1.4.3. Company Financials
- 12.1.4.4. SWOT Analysis
- 12.1.5 Fujitsu Limited
- 12.1.5.1. Company Overview
- 12.1.5.2. Products
- 12.1.5.3. Company Financials
- 12.1.5.4. SWOT Analysis
- 12.1.6 Hitachi Limited
- 12.1.6.1. Company Overview
- 12.1.6.2. Products
- 12.1.6.3. Company Financials
- 12.1.6.4. SWOT Analysis
- 12.1.7 NEC Corporation
- 12.1.7.1. Company Overview
- 12.1.7.2. Products
- 12.1.7.3. Company Financials
- 12.1.7.4. SWOT Analysis
- 12.1.8 SGI Corporation
- 12.1.8.1. Company Overview
- 12.1.8.2. Products
- 12.1.8.3. Company Financials
- 12.1.8.4. SWOT Analysis
- 12.1.1 Cisco Systems Inc.
- 12.2. Market Entropy
- 12.2.1 Company's Key Areas Served
- 12.2.2 Recent Developments
- 12.3. Company Market Share Analysis 2025
- 12.3.1 Top 5 Companies Market Share Analysis
- 12.3.2 Top 3 Companies Market Share Analysis
- 12.4. List of Potential Customers
- 13. Research Methodology
List of Figures
- Figure 1: Global Data Center Blade Server Revenue Breakdown (billion, %) by Region 2025 & 2033
- Figure 2: North America Data Center Blade Server Revenue (billion), by Application 2025 & 2033
- Figure 3: North America Data Center Blade Server Revenue Share (%), by Application 2025 & 2033
- Figure 4: North America Data Center Blade Server Revenue (billion), by Types 2025 & 2033
- Figure 5: North America Data Center Blade Server Revenue Share (%), by Types 2025 & 2033
- Figure 6: North America Data Center Blade Server Revenue (billion), by Country 2025 & 2033
- Figure 7: North America Data Center Blade Server Revenue Share (%), by Country 2025 & 2033
- Figure 8: South America Data Center Blade Server Revenue (billion), by Application 2025 & 2033
- Figure 9: South America Data Center Blade Server Revenue Share (%), by Application 2025 & 2033
- Figure 10: South America Data Center Blade Server Revenue (billion), by Types 2025 & 2033
- Figure 11: South America Data Center Blade Server Revenue Share (%), by Types 2025 & 2033
- Figure 12: South America Data Center Blade Server Revenue (billion), by Country 2025 & 2033
- Figure 13: South America Data Center Blade Server Revenue Share (%), by Country 2025 & 2033
- Figure 14: Europe Data Center Blade Server Revenue (billion), by Application 2025 & 2033
- Figure 15: Europe Data Center Blade Server Revenue Share (%), by Application 2025 & 2033
- Figure 16: Europe Data Center Blade Server Revenue (billion), by Types 2025 & 2033
- Figure 17: Europe Data Center Blade Server Revenue Share (%), by Types 2025 & 2033
- Figure 18: Europe Data Center Blade Server Revenue (billion), by Country 2025 & 2033
- Figure 19: Europe Data Center Blade Server Revenue Share (%), by Country 2025 & 2033
- Figure 20: Middle East & Africa Data Center Blade Server Revenue (billion), by Application 2025 & 2033
- Figure 21: Middle East & Africa Data Center Blade Server Revenue Share (%), by Application 2025 & 2033
- Figure 22: Middle East & Africa Data Center Blade Server Revenue (billion), by Types 2025 & 2033
- Figure 23: Middle East & Africa Data Center Blade Server Revenue Share (%), by Types 2025 & 2033
- Figure 24: Middle East & Africa Data Center Blade Server Revenue (billion), by Country 2025 & 2033
- Figure 25: Middle East & Africa Data Center Blade Server Revenue Share (%), by Country 2025 & 2033
- Figure 26: Asia Pacific Data Center Blade Server Revenue (billion), by Application 2025 & 2033
- Figure 27: Asia Pacific Data Center Blade Server Revenue Share (%), by Application 2025 & 2033
- Figure 28: Asia Pacific Data Center Blade Server Revenue (billion), by Types 2025 & 2033
- Figure 29: Asia Pacific Data Center Blade Server Revenue Share (%), by Types 2025 & 2033
- Figure 30: Asia Pacific Data Center Blade Server Revenue (billion), by Country 2025 & 2033
- Figure 31: Asia Pacific Data Center Blade Server Revenue Share (%), by Country 2025 & 2033
List of Tables
- Table 1: Global Data Center Blade Server Revenue billion Forecast, by Application 2020 & 2033
- Table 2: Global Data Center Blade Server Revenue billion Forecast, by Types 2020 & 2033
- Table 3: Global Data Center Blade Server Revenue billion Forecast, by Region 2020 & 2033
- Table 4: Global Data Center Blade Server Revenue billion Forecast, by Application 2020 & 2033
- Table 5: Global Data Center Blade Server Revenue billion Forecast, by Types 2020 & 2033
- Table 6: Global Data Center Blade Server Revenue billion Forecast, by Country 2020 & 2033
- Table 7: United States Data Center Blade Server Revenue (billion) Forecast, by Application 2020 & 2033
- Table 8: Canada Data Center Blade Server Revenue (billion) Forecast, by Application 2020 & 2033
- Table 9: Mexico Data Center Blade Server Revenue (billion) Forecast, by Application 2020 & 2033
- Table 10: Global Data Center Blade Server Revenue billion Forecast, by Application 2020 & 2033
- Table 11: Global Data Center Blade Server Revenue billion Forecast, by Types 2020 & 2033
- Table 12: Global Data Center Blade Server Revenue billion Forecast, by Country 2020 & 2033
- Table 13: Brazil Data Center Blade Server Revenue (billion) Forecast, by Application 2020 & 2033
- Table 14: Argentina Data Center Blade Server Revenue (billion) Forecast, by Application 2020 & 2033
- Table 15: Rest of South America Data Center Blade Server Revenue (billion) Forecast, by Application 2020 & 2033
- Table 16: Global Data Center Blade Server Revenue billion Forecast, by Application 2020 & 2033
- Table 17: Global Data Center Blade Server Revenue billion Forecast, by Types 2020 & 2033
- Table 18: Global Data Center Blade Server Revenue billion Forecast, by Country 2020 & 2033
- Table 19: United Kingdom Data Center Blade Server Revenue (billion) Forecast, by Application 2020 & 2033
- Table 20: Germany Data Center Blade Server Revenue (billion) Forecast, by Application 2020 & 2033
- Table 21: France Data Center Blade Server Revenue (billion) Forecast, by Application 2020 & 2033
- Table 22: Italy Data Center Blade Server Revenue (billion) Forecast, by Application 2020 & 2033
- Table 23: Spain Data Center Blade Server Revenue (billion) Forecast, by Application 2020 & 2033
- Table 24: Russia Data Center Blade Server Revenue (billion) Forecast, by Application 2020 & 2033
- Table 25: Benelux Data Center Blade Server Revenue (billion) Forecast, by Application 2020 & 2033
- Table 26: Nordics Data Center Blade Server Revenue (billion) Forecast, by Application 2020 & 2033
- Table 27: Rest of Europe Data Center Blade Server Revenue (billion) Forecast, by Application 2020 & 2033
- Table 28: Global Data Center Blade Server Revenue billion Forecast, by Application 2020 & 2033
- Table 29: Global Data Center Blade Server Revenue billion Forecast, by Types 2020 & 2033
- Table 30: Global Data Center Blade Server Revenue billion Forecast, by Country 2020 & 2033
- Table 31: Turkey Data Center Blade Server Revenue (billion) Forecast, by Application 2020 & 2033
- Table 32: Israel Data Center Blade Server Revenue (billion) Forecast, by Application 2020 & 2033
- Table 33: GCC Data Center Blade Server Revenue (billion) Forecast, by Application 2020 & 2033
- Table 34: North Africa Data Center Blade Server Revenue (billion) Forecast, by Application 2020 & 2033
- Table 35: South Africa Data Center Blade Server Revenue (billion) Forecast, by Application 2020 & 2033
- Table 36: Rest of Middle East & Africa Data Center Blade Server Revenue (billion) Forecast, by Application 2020 & 2033
- Table 37: Global Data Center Blade Server Revenue billion Forecast, by Application 2020 & 2033
- Table 38: Global Data Center Blade Server Revenue billion Forecast, by Types 2020 & 2033
- Table 39: Global Data Center Blade Server Revenue billion Forecast, by Country 2020 & 2033
- Table 40: China Data Center Blade Server Revenue (billion) Forecast, by Application 2020 & 2033
- Table 41: India Data Center Blade Server Revenue (billion) Forecast, by Application 2020 & 2033
- Table 42: Japan Data Center Blade Server Revenue (billion) Forecast, by Application 2020 & 2033
- Table 43: South Korea Data Center Blade Server Revenue (billion) Forecast, by Application 2020 & 2033
- Table 44: ASEAN Data Center Blade Server Revenue (billion) Forecast, by Application 2020 & 2033
- Table 45: Oceania Data Center Blade Server Revenue (billion) Forecast, by Application 2020 & 2033
- Table 46: Rest of Asia Pacific Data Center Blade Server Revenue (billion) Forecast, by Application 2020 & 2033
Frequently Asked Questions
1. What is the projected Compound Annual Growth Rate (CAGR) of the Data Center Blade Server?
The projected CAGR is approximately 9.01%.
2. Which companies are prominent players in the Data Center Blade Server?
Key companies in the market include Cisco Systems Inc., Dell Inc, Hewlett-Packard Company, Lenovo Group Limited, Fujitsu Limited, Hitachi Limited, NEC Corporation, SGI Corporation.
3. What are the main segments of the Data Center Blade Server?
The market segments include Application, Types.
4. Can you provide details about the market size?
The market size is estimated to be USD 21.374 billion as of 2022.
5. What are some drivers contributing to market growth?
N/A
6. What are the notable trends driving market growth?
N/A
7. Are there any restraints impacting market growth?
N/A
8. Can you provide examples of recent developments in the market?
N/A
9. What pricing options are available for accessing the report?
Pricing options include single-user, multi-user, and enterprise licenses priced at USD 4900.00, USD 7350.00, and USD 9800.00 respectively.
10. Is the market size provided in terms of value or volume?
The market size is provided in terms of value, measured in billion.
11. Are there any specific market keywords associated with the report?
Yes, the market keyword associated with the report is "Data Center Blade Server," which aids in identifying and referencing the specific market segment covered.
12. How do I determine which pricing option suits my needs best?
The pricing options vary based on user requirements and access needs. Individual users may opt for single-user licenses, while businesses requiring broader access may choose multi-user or enterprise licenses for cost-effective access to the report.
13. Are there any additional resources or data provided in the Data Center Blade Server report?
While the report offers comprehensive insights, it's advisable to review the specific contents or supplementary materials provided to ascertain if additional resources or data are available.
14. How can I stay updated on further developments or reports in the Data Center Blade Server?
To stay informed about further developments, trends, and reports in the Data Center Blade Server, consider subscribing to industry newsletters, following relevant companies and organizations, or regularly checking reputable industry news sources and publications.
Methodology
Step 1 - Identification of Relevant Samples Size from Population Database


Step 2 - Approaches for Defining Global Market Size (Value, Volume* & Price*)

Note*: In applicable scenarios
Step 3 - Data Sources
Primary Research
- Web Analytics
- Survey Reports
- Research Institute
- Latest Research Reports
- Opinion Leaders
Secondary Research
- Annual Reports
- White Paper
- Latest Press Release
- Industry Association
- Paid Database
- Investor Presentations

Step 4 - Data Triangulation
Involves using different sources of information in order to increase the validity of a study
These sources are likely to be stakeholders in a program - participants, other researchers, program staff, other community members, and so on.
Then we put all data in single framework & apply various statistical tools to find out the dynamic on the market.
During the analysis stage, feedback from the stakeholder groups would be compared to determine areas of agreement as well as areas of divergence