

Key Insights
The DAC Copper Cable market is experiencing robust growth, driven by the increasing adoption of high-speed data centers and the expanding need for high-bandwidth connectivity solutions. The market's expansion is fueled by several key factors, including the escalating demand for cloud computing services, the proliferation of 5G networks, and the growing adoption of artificial intelligence and machine learning applications. These technologies require robust and reliable high-speed data transmission, which DAC Copper Cables excel at providing, due to their superior performance compared to traditional fiber optic cables in shorter distances. The market is segmented based on cable type, application, and region, with significant growth projected across all segments. Major players such as Cisco, Nvidia, and Hewlett Packard Enterprise are actively investing in research and development, further stimulating innovation and market expansion. While challenges remain, such as managing costs and ensuring compatibility across various systems, the overall market outlook remains positive, driven by the continued growth of data-intensive applications and technologies.
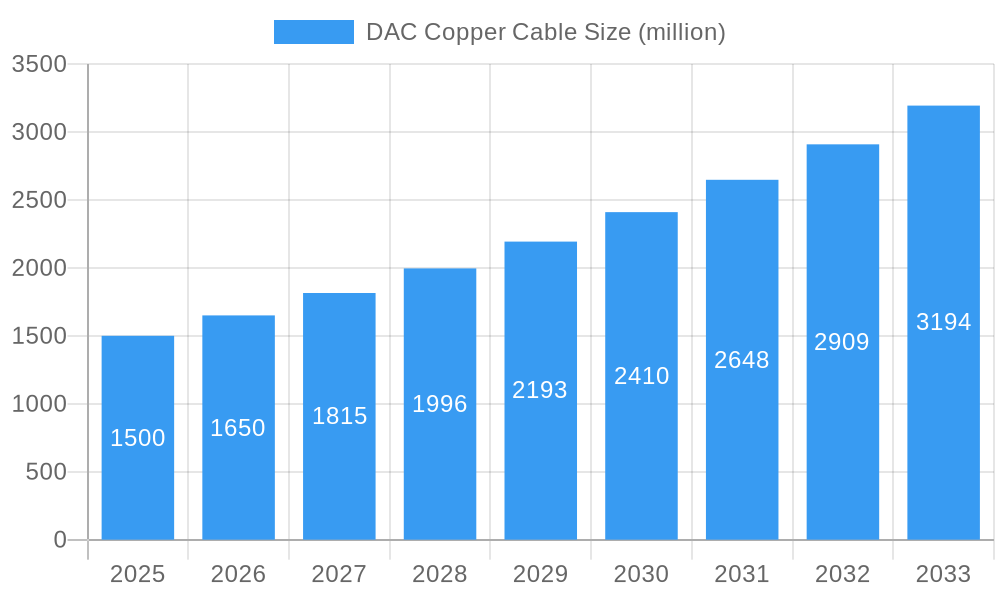
DAC Copper Cable Market Size (In Billion)
The forecast period from 2025 to 2033 is expected to witness substantial expansion of the DAC Copper Cable market. Several key trends are shaping the industry's trajectory, including the increasing adoption of 400 Gigabit Ethernet and 800 Gigabit Ethernet technologies, leading to higher data transfer speeds. Miniaturization of data centers and the rise of edge computing are also influencing the demand for compact and efficient DAC Copper Cables. Competition among market players is intense, with established players facing competition from emerging companies. The competitive landscape is characterized by innovation in cable design, improved performance characteristics, and strategic partnerships. Regional variations in market growth are expected due to differences in technological adoption rates and infrastructure development across various geographical areas. The consistent growth in global data consumption and the continuous evolution of data center infrastructure will support the long-term growth potential of this market.
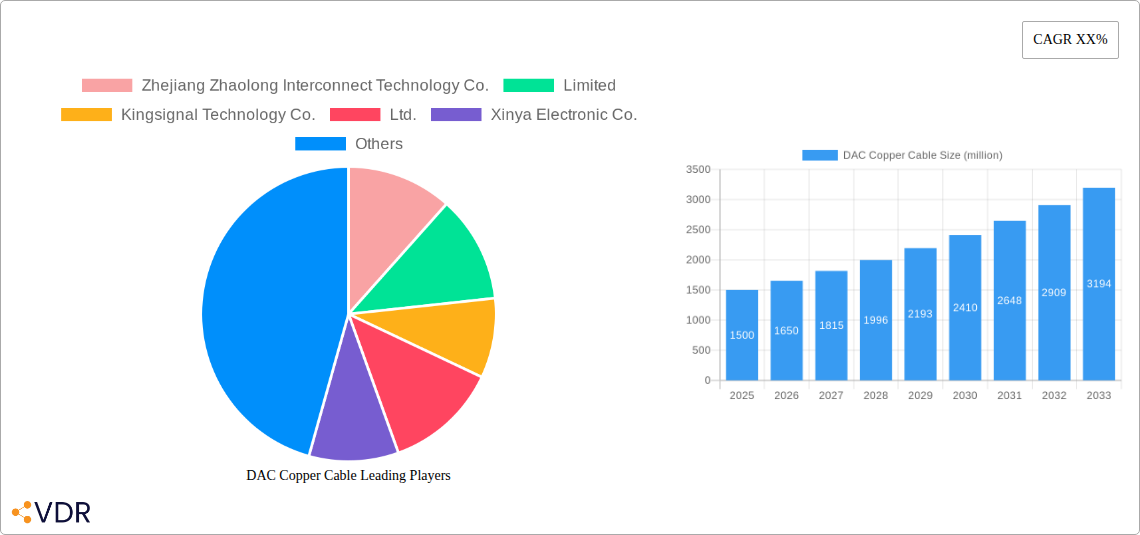
DAC Copper Cable Company Market Share
DAC Copper Cable Market Report: 2019-2033
This comprehensive report provides an in-depth analysis of the global DAC Copper Cable market, encompassing historical data (2019-2024), current estimates (2025), and future forecasts (2025-2033). The study meticulously examines market dynamics, growth trends, regional performance, product landscape, key players, and emerging opportunities within the parent market of data center cabling and the child market of high-speed copper interconnect solutions. The report is an invaluable resource for industry professionals, investors, and strategic decision-makers seeking actionable insights into this dynamic market.
DAC Copper Cable Market Dynamics & Structure
The global DAC Copper Cable market is characterized by moderate concentration, with a few major players holding significant market share, while numerous smaller companies compete in niche segments. Technological innovation, particularly in higher bandwidth capabilities and smaller form factors, is a crucial driver. Stringent regulatory compliance requirements, especially concerning signal integrity and environmental standards, also shape market dynamics. Competitive substitutes, such as fiber optic cables, exert pressure, particularly in long-distance applications. The end-user demographics are heavily weighted towards data centers, cloud providers, and high-performance computing sectors. M&A activity has been relatively steady, with strategic acquisitions aiming to expand product portfolios and geographic reach.
- Market Concentration: xx% held by top 5 players in 2025.
- Technological Innovation: Focus on 400G and 800G solutions driving growth.
- Regulatory Frameworks: Compliance with RoHS and REACH regulations.
- Competitive Substitutes: Fiber optic cables pose a significant competitive threat.
- End-User Demographics: Data centers, cloud providers, and HPC sectors dominate.
- M&A Trends: xx M&A deals recorded between 2019 and 2024, with an average deal value of $xx million.
DAC Copper Cable Growth Trends & Insights
The global DAC Copper Cable market experienced robust growth during the historical period (2019-2024), driven by the increasing demand for high-bandwidth data transmission in data centers and high-performance computing environments. The market size expanded from xx million units in 2019 to xx million units in 2024, registering a CAGR of xx%. This growth is projected to continue in the forecast period (2025-2033), with the market size expected to reach xx million units by 2033, driven by factors such as the proliferation of cloud computing, the rise of 5G networks, and the growing adoption of artificial intelligence and machine learning. Technological disruptions, such as the introduction of new connector types and improved cable designs, are further accelerating market adoption. Consumer behavior shifts towards increased reliance on data-intensive applications are also contributing to market expansion. The market penetration rate is projected to reach xx% by 2033.
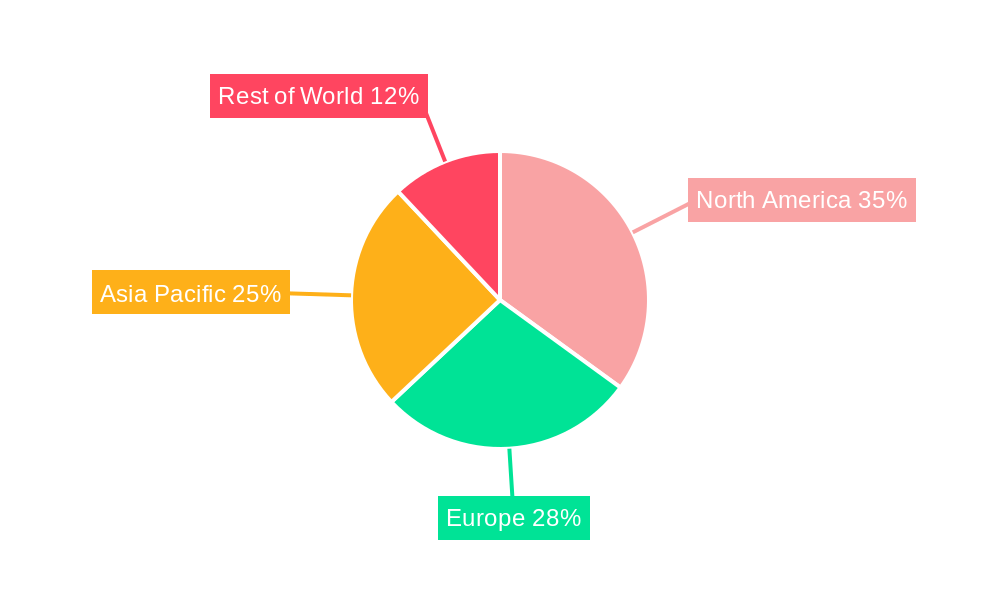
Dominant Regions, Countries, or Segments in DAC Copper Cable
North America currently holds the largest market share in the DAC Copper Cable market, driven by the high concentration of data centers and cloud service providers in the region. The strong presence of major technology companies and supportive government policies further contribute to this dominance. Asia-Pacific is projected to witness the fastest growth rate in the forecast period, fueled by rapid economic expansion, increasing investments in data center infrastructure, and a burgeoning digital economy.
- North America: High data center density, strong presence of major technology companies.
- Asia-Pacific: Rapid economic growth, significant investments in data center infrastructure.
- Europe: Steady growth, driven by increasing adoption of cloud computing and 5G.
- Rest of the World: Moderate growth, with emerging economies showing potential.
DAC Copper Cable Product Landscape
The DAC Copper Cable market offers a range of products with varying bandwidth capabilities, connector types, and cable lengths. Recent innovations focus on miniaturized designs, enhanced signal integrity, and improved power efficiency. Key features driving product differentiation include higher bandwidth support, improved signal quality, and reduced signal loss. The unique selling propositions of various products include improved cost-effectiveness, higher durability, and compatibility with various data center equipment.
Key Drivers, Barriers & Challenges in DAC Copper Cable
Key Drivers:
- The escalating demand for high-speed data transmission in data centers is a primary driver.
- The growing adoption of cloud computing and the expansion of 5G networks are boosting market growth.
- Advancements in connector technology and cable design are improving performance and reliability.
Key Challenges:
- Competition from fiber optic cables in long-haul applications.
- Supply chain disruptions and potential material shortages.
- Stringent regulatory compliance requirements add to manufacturing costs.
Emerging Opportunities in DAC Copper Cable
Emerging opportunities exist in the development of next-generation DAC Copper Cables supporting higher bandwidths (e.g., 1600G and beyond), and the integration of advanced signal processing techniques to enhance performance and reduce signal loss. Expanding into emerging markets and developing innovative solutions for specific applications, such as high-performance computing and artificial intelligence, also present significant potential for growth.
Growth Accelerators in the DAC Copper Cable Industry
Technological breakthroughs in connector and cable designs, leading to improved signal integrity and higher bandwidth capabilities, will be key growth catalysts. Strategic partnerships between cable manufacturers and data center equipment providers will facilitate the adoption of new technologies. Expansion into untapped markets in developing economies and the development of customized solutions for niche applications will also contribute significantly to long-term growth.
Key Players Shaping the DAC Copper Cable Market
- Cisco
- Nvidia
- C-Flink
- Hewlett Packard Enterprise (HPE)
- Juniper Networks
- Mellanox Technologies
- Arista Networks
- Supermicro
- QLogic Corporation
- Brocade Communications Systems
- Avago Technologies
- Zhejiang Zhaolong Interconnect Technology Co.,Limited
- Kingsignal Technology Co.,Ltd.
- Xinya Electronic Co.,Ltd.
- Broadex Technologies Co.,Ltd.
Notable Milestones in DAC Copper Cable Sector
- 2020: Introduction of the first 400G DAC Copper Cable by [Company Name].
- 2022: [Company Name] launches a new miniaturized DAC Copper Cable design.
- 2023: Merger between [Company A] and [Company B] expands market presence.
- 2024: [Company Name] receives regulatory approval for a new high-bandwidth cable.
In-Depth DAC Copper Cable Market Outlook
The future of the DAC Copper Cable market looks promising, with continued growth driven by the increasing demand for high-speed data transmission in data centers and the expansion of cloud computing. Strategic partnerships, technological advancements, and expansion into new markets will shape the market landscape in the coming years. Companies that can effectively address evolving customer needs, such as miniaturization and higher bandwidth requirements, will be well-positioned for success in this dynamic market.
DAC Copper Cable Segmentation
-
1. Application
- 1.1. Data Center
- 1.2. High Performance Computing (HPC) Center
-
2. Types
- 2.1. Passive DAC Cable
- 2.2. Active DAC Cable
DAC Copper Cable Segmentation By Geography
-
1. North America
- 1.1. United States
- 1.2. Canada
- 1.3. Mexico
-
2. South America
- 2.1. Brazil
- 2.2. Argentina
- 2.3. Rest of South America
-
3. Europe
- 3.1. United Kingdom
- 3.2. Germany
- 3.3. France
- 3.4. Italy
- 3.5. Spain
- 3.6. Russia
- 3.7. Benelux
- 3.8. Nordics
- 3.9. Rest of Europe
-
4. Middle East & Africa
- 4.1. Turkey
- 4.2. Israel
- 4.3. GCC
- 4.4. North Africa
- 4.5. South Africa
- 4.6. Rest of Middle East & Africa
-
5. Asia Pacific
- 5.1. China
- 5.2. India
- 5.3. Japan
- 5.4. South Korea
- 5.5. ASEAN
- 5.6. Oceania
- 5.7. Rest of Asia Pacific
DAC Copper Cable Regional Market Share
Geographic Coverage of DAC Copper Cable
DAC Copper Cable REPORT HIGHLIGHTS
| Aspects | Details |
|---|---|
| Study Period | 2020-2034 |
| Base Year | 2025 |
| Estimated Year | 2026 |
| Forecast Period | 2026-2034 |
| Historical Period | 2020-2025 |
| Growth Rate | CAGR of 36.71% from 2020-2034 |
| Segmentation |
|
Table of Contents
- 1. Introduction
- 1.1. Research Scope
- 1.2. Market Segmentation
- 1.3. Research Objective
- 1.4. Definitions and Assumptions
- 2. Executive Summary
- 2.1. Market Snapshot
- 3. Market Dynamics
- 3.1. Market Drivers
- 3.2. Market Restrains
- 3.3. Market Trends
- 3.4. Market Opportunities
- 4. Market Factor Analysis
- 4.1. Porters Five Forces
- 4.1.1. Bargaining Power of Suppliers
- 4.1.2. Bargaining Power of Buyers
- 4.1.3. Threat of New Entrants
- 4.1.4. Threat of Substitutes
- 4.1.5. Competitive Rivalry
- 4.2. PESTEL analysis
- 4.3. BCG Analysis
- 4.3.1. Stars (High Growth, High Market Share)
- 4.3.2. Cash Cows (Low Growth, High Market Share)
- 4.3.3. Question Mark (High Growth, Low Market Share)
- 4.3.4. Dogs (Low Growth, Low Market Share)
- 4.4. Ansoff Matrix Analysis
- 4.5. Supply Chain Analysis
- 4.6. Regulatory Landscape
- 4.7. Current Market Potential and Opportunity Assessment (TAM–SAM–SOM Framework)
- 4.8. VDR Analyst Note
- 4.1. Porters Five Forces
- 5. Market Analysis, Insights and Forecast 2021-2033
- 5.1. Market Analysis, Insights and Forecast - by Application
- 5.1.1. Data Center
- 5.1.2. High Performance Computing (HPC) Center
- 5.2. Market Analysis, Insights and Forecast - by Types
- 5.2.1. Passive DAC Cable
- 5.2.2. Active DAC Cable
- 5.3. Market Analysis, Insights and Forecast - by Region
- 5.3.1. North America
- 5.3.2. South America
- 5.3.3. Europe
- 5.3.4. Middle East & Africa
- 5.3.5. Asia Pacific
- 5.1. Market Analysis, Insights and Forecast - by Application
- 6. Global DAC Copper Cable Analysis, Insights and Forecast, 2021-2033
- 6.1. Market Analysis, Insights and Forecast - by Application
- 6.1.1. Data Center
- 6.1.2. High Performance Computing (HPC) Center
- 6.2. Market Analysis, Insights and Forecast - by Types
- 6.2.1. Passive DAC Cable
- 6.2.2. Active DAC Cable
- 6.1. Market Analysis, Insights and Forecast - by Application
- 7. North America DAC Copper Cable Analysis, Insights and Forecast, 2021-2033
- 7.1. Market Analysis, Insights and Forecast - by Application
- 7.1.1. Data Center
- 7.1.2. High Performance Computing (HPC) Center
- 7.2. Market Analysis, Insights and Forecast - by Types
- 7.2.1. Passive DAC Cable
- 7.2.2. Active DAC Cable
- 7.1. Market Analysis, Insights and Forecast - by Application
- 8. South America DAC Copper Cable Analysis, Insights and Forecast, 2021-2033
- 8.1. Market Analysis, Insights and Forecast - by Application
- 8.1.1. Data Center
- 8.1.2. High Performance Computing (HPC) Center
- 8.2. Market Analysis, Insights and Forecast - by Types
- 8.2.1. Passive DAC Cable
- 8.2.2. Active DAC Cable
- 8.1. Market Analysis, Insights and Forecast - by Application
- 9. Europe DAC Copper Cable Analysis, Insights and Forecast, 2021-2033
- 9.1. Market Analysis, Insights and Forecast - by Application
- 9.1.1. Data Center
- 9.1.2. High Performance Computing (HPC) Center
- 9.2. Market Analysis, Insights and Forecast - by Types
- 9.2.1. Passive DAC Cable
- 9.2.2. Active DAC Cable
- 9.1. Market Analysis, Insights and Forecast - by Application
- 10. Middle East & Africa DAC Copper Cable Analysis, Insights and Forecast, 2021-2033
- 10.1. Market Analysis, Insights and Forecast - by Application
- 10.1.1. Data Center
- 10.1.2. High Performance Computing (HPC) Center
- 10.2. Market Analysis, Insights and Forecast - by Types
- 10.2.1. Passive DAC Cable
- 10.2.2. Active DAC Cable
- 10.1. Market Analysis, Insights and Forecast - by Application
- 11. Asia Pacific DAC Copper Cable Analysis, Insights and Forecast, 2021-2033
- 11.1. Market Analysis, Insights and Forecast - by Application
- 11.1.1. Data Center
- 11.1.2. High Performance Computing (HPC) Center
- 11.2. Market Analysis, Insights and Forecast - by Types
- 11.2.1. Passive DAC Cable
- 11.2.2. Active DAC Cable
- 11.1. Market Analysis, Insights and Forecast - by Application
- 12. Competitive Analysis
- 12.1. Company Profiles
- 12.1.1 Zhejiang Zhaolong Interconnect Technology Co.
- 12.1.1.1. Company Overview
- 12.1.1.2. Products
- 12.1.1.3. Company Financials
- 12.1.1.4. SWOT Analysis
- 12.1.2 Limited
- 12.1.2.1. Company Overview
- 12.1.2.2. Products
- 12.1.2.3. Company Financials
- 12.1.2.4. SWOT Analysis
- 12.1.3 Kingsignal Technology Co.
- 12.1.3.1. Company Overview
- 12.1.3.2. Products
- 12.1.3.3. Company Financials
- 12.1.3.4. SWOT Analysis
- 12.1.4 Ltd.
- 12.1.4.1. Company Overview
- 12.1.4.2. Products
- 12.1.4.3. Company Financials
- 12.1.4.4. SWOT Analysis
- 12.1.5 Xinya Electronic Co.
- 12.1.5.1. Company Overview
- 12.1.5.2. Products
- 12.1.5.3. Company Financials
- 12.1.5.4. SWOT Analysis
- 12.1.6 Ltd.
- 12.1.6.1. Company Overview
- 12.1.6.2. Products
- 12.1.6.3. Company Financials
- 12.1.6.4. SWOT Analysis
- 12.1.7 Broadex Technologies Co.
- 12.1.7.1. Company Overview
- 12.1.7.2. Products
- 12.1.7.3. Company Financials
- 12.1.7.4. SWOT Analysis
- 12.1.8 Ltd.
- 12.1.8.1. Company Overview
- 12.1.8.2. Products
- 12.1.8.3. Company Financials
- 12.1.8.4. SWOT Analysis
- 12.1.9 Cisco
- 12.1.9.1. Company Overview
- 12.1.9.2. Products
- 12.1.9.3. Company Financials
- 12.1.9.4. SWOT Analysis
- 12.1.10 Nvidia
- 12.1.10.1. Company Overview
- 12.1.10.2. Products
- 12.1.10.3. Company Financials
- 12.1.10.4. SWOT Analysis
- 12.1.11 C-Flink
- 12.1.11.1. Company Overview
- 12.1.11.2. Products
- 12.1.11.3. Company Financials
- 12.1.11.4. SWOT Analysis
- 12.1.12 Hewlett Packard Enterprise (HPE)
- 12.1.12.1. Company Overview
- 12.1.12.2. Products
- 12.1.12.3. Company Financials
- 12.1.12.4. SWOT Analysis
- 12.1.13 Juniper Networks
- 12.1.13.1. Company Overview
- 12.1.13.2. Products
- 12.1.13.3. Company Financials
- 12.1.13.4. SWOT Analysis
- 12.1.14 Mellanox Technologies
- 12.1.14.1. Company Overview
- 12.1.14.2. Products
- 12.1.14.3. Company Financials
- 12.1.14.4. SWOT Analysis
- 12.1.15 Arista Networks
- 12.1.15.1. Company Overview
- 12.1.15.2. Products
- 12.1.15.3. Company Financials
- 12.1.15.4. SWOT Analysis
- 12.1.16 Supermicro
- 12.1.16.1. Company Overview
- 12.1.16.2. Products
- 12.1.16.3. Company Financials
- 12.1.16.4. SWOT Analysis
- 12.1.17 QLogic Corporation
- 12.1.17.1. Company Overview
- 12.1.17.2. Products
- 12.1.17.3. Company Financials
- 12.1.17.4. SWOT Analysis
- 12.1.18 Brocade Communications Systems
- 12.1.18.1. Company Overview
- 12.1.18.2. Products
- 12.1.18.3. Company Financials
- 12.1.18.4. SWOT Analysis
- 12.1.19 Avago Technologies
- 12.1.19.1. Company Overview
- 12.1.19.2. Products
- 12.1.19.3. Company Financials
- 12.1.19.4. SWOT Analysis
- 12.1.1 Zhejiang Zhaolong Interconnect Technology Co.
- 12.2. Market Entropy
- 12.2.1 Company's Key Areas Served
- 12.2.2 Recent Developments
- 12.3. Company Market Share Analysis 2025
- 12.3.1 Top 5 Companies Market Share Analysis
- 12.3.2 Top 3 Companies Market Share Analysis
- 12.4. List of Potential Customers
- 13. Research Methodology
List of Figures
- Figure 1: Global DAC Copper Cable Revenue Breakdown (undefined, %) by Region 2025 & 2033
- Figure 2: Global DAC Copper Cable Volume Breakdown (K, %) by Region 2025 & 2033
- Figure 3: North America DAC Copper Cable Revenue (undefined), by Application 2025 & 2033
- Figure 4: North America DAC Copper Cable Volume (K), by Application 2025 & 2033
- Figure 5: North America DAC Copper Cable Revenue Share (%), by Application 2025 & 2033
- Figure 6: North America DAC Copper Cable Volume Share (%), by Application 2025 & 2033
- Figure 7: North America DAC Copper Cable Revenue (undefined), by Types 2025 & 2033
- Figure 8: North America DAC Copper Cable Volume (K), by Types 2025 & 2033
- Figure 9: North America DAC Copper Cable Revenue Share (%), by Types 2025 & 2033
- Figure 10: North America DAC Copper Cable Volume Share (%), by Types 2025 & 2033
- Figure 11: North America DAC Copper Cable Revenue (undefined), by Country 2025 & 2033
- Figure 12: North America DAC Copper Cable Volume (K), by Country 2025 & 2033
- Figure 13: North America DAC Copper Cable Revenue Share (%), by Country 2025 & 2033
- Figure 14: North America DAC Copper Cable Volume Share (%), by Country 2025 & 2033
- Figure 15: South America DAC Copper Cable Revenue (undefined), by Application 2025 & 2033
- Figure 16: South America DAC Copper Cable Volume (K), by Application 2025 & 2033
- Figure 17: South America DAC Copper Cable Revenue Share (%), by Application 2025 & 2033
- Figure 18: South America DAC Copper Cable Volume Share (%), by Application 2025 & 2033
- Figure 19: South America DAC Copper Cable Revenue (undefined), by Types 2025 & 2033
- Figure 20: South America DAC Copper Cable Volume (K), by Types 2025 & 2033
- Figure 21: South America DAC Copper Cable Revenue Share (%), by Types 2025 & 2033
- Figure 22: South America DAC Copper Cable Volume Share (%), by Types 2025 & 2033
- Figure 23: South America DAC Copper Cable Revenue (undefined), by Country 2025 & 2033
- Figure 24: South America DAC Copper Cable Volume (K), by Country 2025 & 2033
- Figure 25: South America DAC Copper Cable Revenue Share (%), by Country 2025 & 2033
- Figure 26: South America DAC Copper Cable Volume Share (%), by Country 2025 & 2033
- Figure 27: Europe DAC Copper Cable Revenue (undefined), by Application 2025 & 2033
- Figure 28: Europe DAC Copper Cable Volume (K), by Application 2025 & 2033
- Figure 29: Europe DAC Copper Cable Revenue Share (%), by Application 2025 & 2033
- Figure 30: Europe DAC Copper Cable Volume Share (%), by Application 2025 & 2033
- Figure 31: Europe DAC Copper Cable Revenue (undefined), by Types 2025 & 2033
- Figure 32: Europe DAC Copper Cable Volume (K), by Types 2025 & 2033
- Figure 33: Europe DAC Copper Cable Revenue Share (%), by Types 2025 & 2033
- Figure 34: Europe DAC Copper Cable Volume Share (%), by Types 2025 & 2033
- Figure 35: Europe DAC Copper Cable Revenue (undefined), by Country 2025 & 2033
- Figure 36: Europe DAC Copper Cable Volume (K), by Country 2025 & 2033
- Figure 37: Europe DAC Copper Cable Revenue Share (%), by Country 2025 & 2033
- Figure 38: Europe DAC Copper Cable Volume Share (%), by Country 2025 & 2033
- Figure 39: Middle East & Africa DAC Copper Cable Revenue (undefined), by Application 2025 & 2033
- Figure 40: Middle East & Africa DAC Copper Cable Volume (K), by Application 2025 & 2033
- Figure 41: Middle East & Africa DAC Copper Cable Revenue Share (%), by Application 2025 & 2033
- Figure 42: Middle East & Africa DAC Copper Cable Volume Share (%), by Application 2025 & 2033
- Figure 43: Middle East & Africa DAC Copper Cable Revenue (undefined), by Types 2025 & 2033
- Figure 44: Middle East & Africa DAC Copper Cable Volume (K), by Types 2025 & 2033
- Figure 45: Middle East & Africa DAC Copper Cable Revenue Share (%), by Types 2025 & 2033
- Figure 46: Middle East & Africa DAC Copper Cable Volume Share (%), by Types 2025 & 2033
- Figure 47: Middle East & Africa DAC Copper Cable Revenue (undefined), by Country 2025 & 2033
- Figure 48: Middle East & Africa DAC Copper Cable Volume (K), by Country 2025 & 2033
- Figure 49: Middle East & Africa DAC Copper Cable Revenue Share (%), by Country 2025 & 2033
- Figure 50: Middle East & Africa DAC Copper Cable Volume Share (%), by Country 2025 & 2033
- Figure 51: Asia Pacific DAC Copper Cable Revenue (undefined), by Application 2025 & 2033
- Figure 52: Asia Pacific DAC Copper Cable Volume (K), by Application 2025 & 2033
- Figure 53: Asia Pacific DAC Copper Cable Revenue Share (%), by Application 2025 & 2033
- Figure 54: Asia Pacific DAC Copper Cable Volume Share (%), by Application 2025 & 2033
- Figure 55: Asia Pacific DAC Copper Cable Revenue (undefined), by Types 2025 & 2033
- Figure 56: Asia Pacific DAC Copper Cable Volume (K), by Types 2025 & 2033
- Figure 57: Asia Pacific DAC Copper Cable Revenue Share (%), by Types 2025 & 2033
- Figure 58: Asia Pacific DAC Copper Cable Volume Share (%), by Types 2025 & 2033
- Figure 59: Asia Pacific DAC Copper Cable Revenue (undefined), by Country 2025 & 2033
- Figure 60: Asia Pacific DAC Copper Cable Volume (K), by Country 2025 & 2033
- Figure 61: Asia Pacific DAC Copper Cable Revenue Share (%), by Country 2025 & 2033
- Figure 62: Asia Pacific DAC Copper Cable Volume Share (%), by Country 2025 & 2033
List of Tables
- Table 1: Global DAC Copper Cable Revenue undefined Forecast, by Application 2020 & 2033
- Table 2: Global DAC Copper Cable Volume K Forecast, by Application 2020 & 2033
- Table 3: Global DAC Copper Cable Revenue undefined Forecast, by Types 2020 & 2033
- Table 4: Global DAC Copper Cable Volume K Forecast, by Types 2020 & 2033
- Table 5: Global DAC Copper Cable Revenue undefined Forecast, by Region 2020 & 2033
- Table 6: Global DAC Copper Cable Volume K Forecast, by Region 2020 & 2033
- Table 7: Global DAC Copper Cable Revenue undefined Forecast, by Application 2020 & 2033
- Table 8: Global DAC Copper Cable Volume K Forecast, by Application 2020 & 2033
- Table 9: Global DAC Copper Cable Revenue undefined Forecast, by Types 2020 & 2033
- Table 10: Global DAC Copper Cable Volume K Forecast, by Types 2020 & 2033
- Table 11: Global DAC Copper Cable Revenue undefined Forecast, by Country 2020 & 2033
- Table 12: Global DAC Copper Cable Volume K Forecast, by Country 2020 & 2033
- Table 13: United States DAC Copper Cable Revenue (undefined) Forecast, by Application 2020 & 2033
- Table 14: United States DAC Copper Cable Volume (K) Forecast, by Application 2020 & 2033
- Table 15: Canada DAC Copper Cable Revenue (undefined) Forecast, by Application 2020 & 2033
- Table 16: Canada DAC Copper Cable Volume (K) Forecast, by Application 2020 & 2033
- Table 17: Mexico DAC Copper Cable Revenue (undefined) Forecast, by Application 2020 & 2033
- Table 18: Mexico DAC Copper Cable Volume (K) Forecast, by Application 2020 & 2033
- Table 19: Global DAC Copper Cable Revenue undefined Forecast, by Application 2020 & 2033
- Table 20: Global DAC Copper Cable Volume K Forecast, by Application 2020 & 2033
- Table 21: Global DAC Copper Cable Revenue undefined Forecast, by Types 2020 & 2033
- Table 22: Global DAC Copper Cable Volume K Forecast, by Types 2020 & 2033
- Table 23: Global DAC Copper Cable Revenue undefined Forecast, by Country 2020 & 2033
- Table 24: Global DAC Copper Cable Volume K Forecast, by Country 2020 & 2033
- Table 25: Brazil DAC Copper Cable Revenue (undefined) Forecast, by Application 2020 & 2033
- Table 26: Brazil DAC Copper Cable Volume (K) Forecast, by Application 2020 & 2033
- Table 27: Argentina DAC Copper Cable Revenue (undefined) Forecast, by Application 2020 & 2033
- Table 28: Argentina DAC Copper Cable Volume (K) Forecast, by Application 2020 & 2033
- Table 29: Rest of South America DAC Copper Cable Revenue (undefined) Forecast, by Application 2020 & 2033
- Table 30: Rest of South America DAC Copper Cable Volume (K) Forecast, by Application 2020 & 2033
- Table 31: Global DAC Copper Cable Revenue undefined Forecast, by Application 2020 & 2033
- Table 32: Global DAC Copper Cable Volume K Forecast, by Application 2020 & 2033
- Table 33: Global DAC Copper Cable Revenue undefined Forecast, by Types 2020 & 2033
- Table 34: Global DAC Copper Cable Volume K Forecast, by Types 2020 & 2033
- Table 35: Global DAC Copper Cable Revenue undefined Forecast, by Country 2020 & 2033
- Table 36: Global DAC Copper Cable Volume K Forecast, by Country 2020 & 2033
- Table 37: United Kingdom DAC Copper Cable Revenue (undefined) Forecast, by Application 2020 & 2033
- Table 38: United Kingdom DAC Copper Cable Volume (K) Forecast, by Application 2020 & 2033
- Table 39: Germany DAC Copper Cable Revenue (undefined) Forecast, by Application 2020 & 2033
- Table 40: Germany DAC Copper Cable Volume (K) Forecast, by Application 2020 & 2033
- Table 41: France DAC Copper Cable Revenue (undefined) Forecast, by Application 2020 & 2033
- Table 42: France DAC Copper Cable Volume (K) Forecast, by Application 2020 & 2033
- Table 43: Italy DAC Copper Cable Revenue (undefined) Forecast, by Application 2020 & 2033
- Table 44: Italy DAC Copper Cable Volume (K) Forecast, by Application 2020 & 2033
- Table 45: Spain DAC Copper Cable Revenue (undefined) Forecast, by Application 2020 & 2033
- Table 46: Spain DAC Copper Cable Volume (K) Forecast, by Application 2020 & 2033
- Table 47: Russia DAC Copper Cable Revenue (undefined) Forecast, by Application 2020 & 2033
- Table 48: Russia DAC Copper Cable Volume (K) Forecast, by Application 2020 & 2033
- Table 49: Benelux DAC Copper Cable Revenue (undefined) Forecast, by Application 2020 & 2033
- Table 50: Benelux DAC Copper Cable Volume (K) Forecast, by Application 2020 & 2033
- Table 51: Nordics DAC Copper Cable Revenue (undefined) Forecast, by Application 2020 & 2033
- Table 52: Nordics DAC Copper Cable Volume (K) Forecast, by Application 2020 & 2033
- Table 53: Rest of Europe DAC Copper Cable Revenue (undefined) Forecast, by Application 2020 & 2033
- Table 54: Rest of Europe DAC Copper Cable Volume (K) Forecast, by Application 2020 & 2033
- Table 55: Global DAC Copper Cable Revenue undefined Forecast, by Application 2020 & 2033
- Table 56: Global DAC Copper Cable Volume K Forecast, by Application 2020 & 2033
- Table 57: Global DAC Copper Cable Revenue undefined Forecast, by Types 2020 & 2033
- Table 58: Global DAC Copper Cable Volume K Forecast, by Types 2020 & 2033
- Table 59: Global DAC Copper Cable Revenue undefined Forecast, by Country 2020 & 2033
- Table 60: Global DAC Copper Cable Volume K Forecast, by Country 2020 & 2033
- Table 61: Turkey DAC Copper Cable Revenue (undefined) Forecast, by Application 2020 & 2033
- Table 62: Turkey DAC Copper Cable Volume (K) Forecast, by Application 2020 & 2033
- Table 63: Israel DAC Copper Cable Revenue (undefined) Forecast, by Application 2020 & 2033
- Table 64: Israel DAC Copper Cable Volume (K) Forecast, by Application 2020 & 2033
- Table 65: GCC DAC Copper Cable Revenue (undefined) Forecast, by Application 2020 & 2033
- Table 66: GCC DAC Copper Cable Volume (K) Forecast, by Application 2020 & 2033
- Table 67: North Africa DAC Copper Cable Revenue (undefined) Forecast, by Application 2020 & 2033
- Table 68: North Africa DAC Copper Cable Volume (K) Forecast, by Application 2020 & 2033
- Table 69: South Africa DAC Copper Cable Revenue (undefined) Forecast, by Application 2020 & 2033
- Table 70: South Africa DAC Copper Cable Volume (K) Forecast, by Application 2020 & 2033
- Table 71: Rest of Middle East & Africa DAC Copper Cable Revenue (undefined) Forecast, by Application 2020 & 2033
- Table 72: Rest of Middle East & Africa DAC Copper Cable Volume (K) Forecast, by Application 2020 & 2033
- Table 73: Global DAC Copper Cable Revenue undefined Forecast, by Application 2020 & 2033
- Table 74: Global DAC Copper Cable Volume K Forecast, by Application 2020 & 2033
- Table 75: Global DAC Copper Cable Revenue undefined Forecast, by Types 2020 & 2033
- Table 76: Global DAC Copper Cable Volume K Forecast, by Types 2020 & 2033
- Table 77: Global DAC Copper Cable Revenue undefined Forecast, by Country 2020 & 2033
- Table 78: Global DAC Copper Cable Volume K Forecast, by Country 2020 & 2033
- Table 79: China DAC Copper Cable Revenue (undefined) Forecast, by Application 2020 & 2033
- Table 80: China DAC Copper Cable Volume (K) Forecast, by Application 2020 & 2033
- Table 81: India DAC Copper Cable Revenue (undefined) Forecast, by Application 2020 & 2033
- Table 82: India DAC Copper Cable Volume (K) Forecast, by Application 2020 & 2033
- Table 83: Japan DAC Copper Cable Revenue (undefined) Forecast, by Application 2020 & 2033
- Table 84: Japan DAC Copper Cable Volume (K) Forecast, by Application 2020 & 2033
- Table 85: South Korea DAC Copper Cable Revenue (undefined) Forecast, by Application 2020 & 2033
- Table 86: South Korea DAC Copper Cable Volume (K) Forecast, by Application 2020 & 2033
- Table 87: ASEAN DAC Copper Cable Revenue (undefined) Forecast, by Application 2020 & 2033
- Table 88: ASEAN DAC Copper Cable Volume (K) Forecast, by Application 2020 & 2033
- Table 89: Oceania DAC Copper Cable Revenue (undefined) Forecast, by Application 2020 & 2033
- Table 90: Oceania DAC Copper Cable Volume (K) Forecast, by Application 2020 & 2033
- Table 91: Rest of Asia Pacific DAC Copper Cable Revenue (undefined) Forecast, by Application 2020 & 2033
- Table 92: Rest of Asia Pacific DAC Copper Cable Volume (K) Forecast, by Application 2020 & 2033
Frequently Asked Questions
1. What is the projected Compound Annual Growth Rate (CAGR) of the DAC Copper Cable?
The projected CAGR is approximately 36.71%.
2. Which companies are prominent players in the DAC Copper Cable?
Key companies in the market include Zhejiang Zhaolong Interconnect Technology Co., Limited, Kingsignal Technology Co., Ltd., Xinya Electronic Co., Ltd., Broadex Technologies Co., Ltd., Cisco, Nvidia, C-Flink, Hewlett Packard Enterprise (HPE), Juniper Networks, Mellanox Technologies, Arista Networks, Supermicro, QLogic Corporation, Brocade Communications Systems, Avago Technologies.
3. What are the main segments of the DAC Copper Cable?
The market segments include Application, Types.
4. Can you provide details about the market size?
The market size is estimated to be USD XXX N/A as of 2022.
5. What are some drivers contributing to market growth?
N/A
6. What are the notable trends driving market growth?
N/A
7. Are there any restraints impacting market growth?
N/A
8. Can you provide examples of recent developments in the market?
N/A
9. What pricing options are available for accessing the report?
Pricing options include single-user, multi-user, and enterprise licenses priced at USD 3950.00, USD 5925.00, and USD 7900.00 respectively.
10. Is the market size provided in terms of value or volume?
The market size is provided in terms of value, measured in N/A and volume, measured in K.
11. Are there any specific market keywords associated with the report?
Yes, the market keyword associated with the report is "DAC Copper Cable," which aids in identifying and referencing the specific market segment covered.
12. How do I determine which pricing option suits my needs best?
The pricing options vary based on user requirements and access needs. Individual users may opt for single-user licenses, while businesses requiring broader access may choose multi-user or enterprise licenses for cost-effective access to the report.
13. Are there any additional resources or data provided in the DAC Copper Cable report?
While the report offers comprehensive insights, it's advisable to review the specific contents or supplementary materials provided to ascertain if additional resources or data are available.
14. How can I stay updated on further developments or reports in the DAC Copper Cable?
To stay informed about further developments, trends, and reports in the DAC Copper Cable, consider subscribing to industry newsletters, following relevant companies and organizations, or regularly checking reputable industry news sources and publications.
Methodology
Step 1 - Identification of Relevant Samples Size from Population Database


Step 2 - Approaches for Defining Global Market Size (Value, Volume* & Price*)

Note*: In applicable scenarios
Step 3 - Data Sources
Primary Research
- Web Analytics
- Survey Reports
- Research Institute
- Latest Research Reports
- Opinion Leaders
Secondary Research
- Annual Reports
- White Paper
- Latest Press Release
- Industry Association
- Paid Database
- Investor Presentations

Step 4 - Data Triangulation
Involves using different sources of information in order to increase the validity of a study
These sources are likely to be stakeholders in a program - participants, other researchers, program staff, other community members, and so on.
Then we put all data in single framework & apply various statistical tools to find out the dynamic on the market.
During the analysis stage, feedback from the stakeholder groups would be compared to determine areas of agreement as well as areas of divergence