
Key Insights
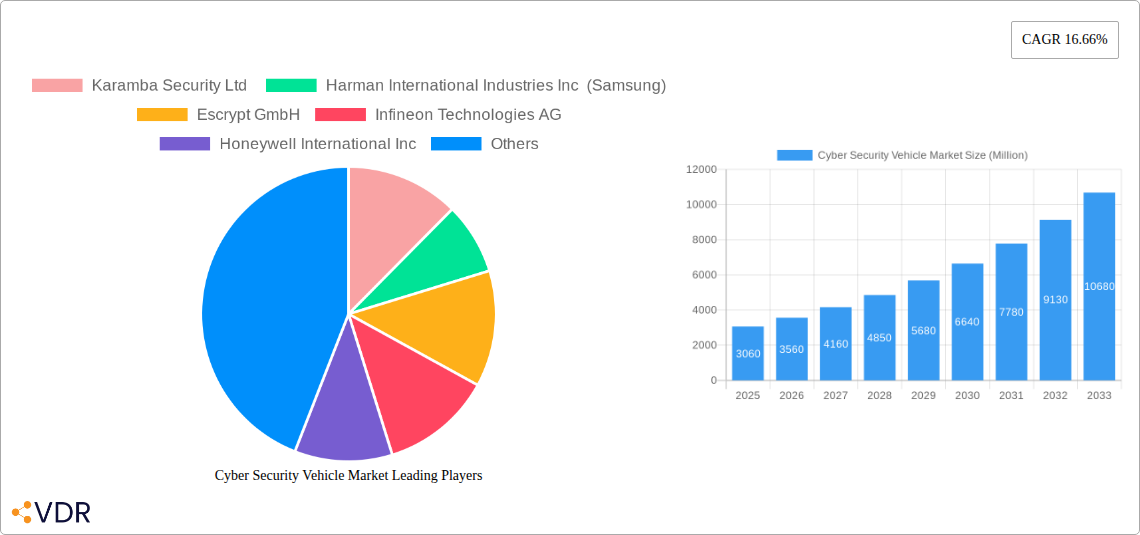
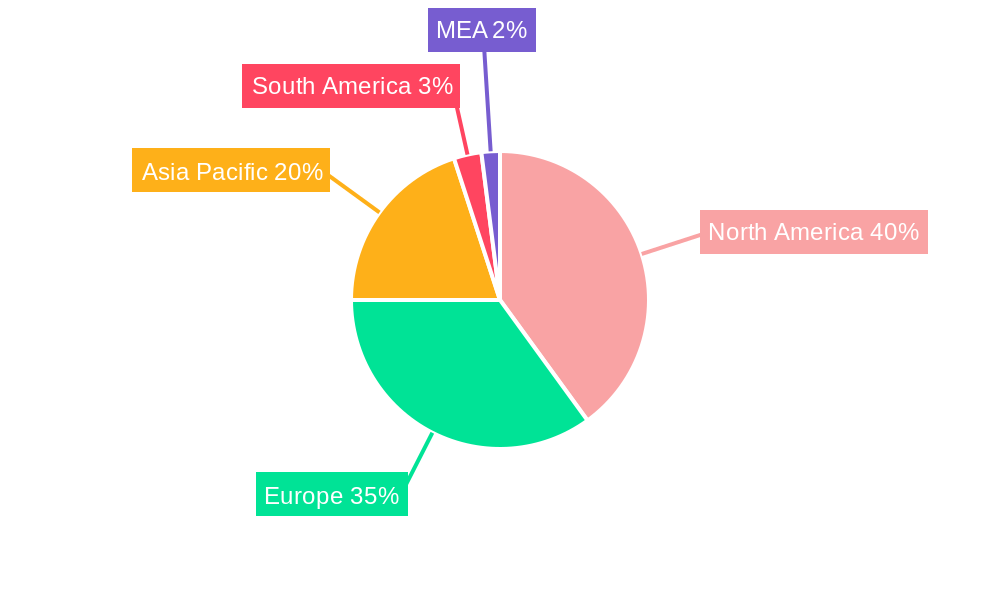
The global automotive cybersecurity market is experiencing robust growth, projected to reach $3.06 billion in 2025 and expand significantly over the forecast period (2025-2033). A Compound Annual Growth Rate (CAGR) of 16.66% signifies strong market momentum driven by several key factors. The increasing connectivity of vehicles through advanced driver-assistance systems (ADAS), in-vehicle infotainment (IVI) systems, and the rise of autonomous vehicles (AVs) significantly expand the attack surface, making cybersecurity a critical concern for manufacturers and consumers alike. Growing government regulations mandating robust cybersecurity measures in vehicles further propel market expansion. The market is segmented by security type (network, application, cloud, and other) and solution type (software-based, hardware-based, professional services, integration, and others). Software-based solutions currently dominate, owing to their flexibility and scalability, while hardware-based solutions are gaining traction due to their enhanced security capabilities. North America and Europe currently hold the largest market share, driven by high vehicle adoption rates and stringent regulatory landscapes. However, the Asia-Pacific region is expected to witness the fastest growth due to increasing vehicle production and rising consumer demand for connected and autonomous vehicles. The competitive landscape is fragmented, with a mix of established players and emerging innovative startups. Key players are constantly investing in research and development to enhance their product offerings and cater to the evolving cybersecurity needs of the automotive industry. This competitive environment is fostering innovation and driving the market towards more sophisticated and comprehensive security solutions.
The market's growth trajectory is influenced by several factors including the continuous evolution of hacking techniques and vulnerabilities, requiring constant upgrades and improvements to cybersecurity systems. The development and integration of Artificial Intelligence (AI) and Machine Learning (ML) into automotive cybersecurity solutions will likely lead to more proactive and predictive security measures. However, challenges remain, including the high cost of implementation and the need for skilled cybersecurity professionals. Addressing these challenges is crucial for ensuring the continued growth and success of the automotive cybersecurity market. The market will also see increased collaboration between automakers, cybersecurity firms, and government agencies to establish industry standards and best practices. This collaborative approach will be vital in addressing the evolving threats and ensuring the safety and security of connected vehicles.
Cyber Security Vehicle Market: A Comprehensive Market Report (2019-2033)
This in-depth report provides a comprehensive analysis of the Cyber Security Vehicle Market, encompassing market dynamics, growth trends, regional dominance, product landscape, key players, and future outlook. The study period covers 2019-2033, with 2025 as the base and estimated year. The report meticulously examines the parent market (Automotive Security) and its child market (Cyber Security Vehicle) to offer a granular understanding of this rapidly evolving sector. Market values are presented in million units.
Cyber Security Vehicle Market Dynamics & Structure
The Cyber Security Vehicle Market is characterized by a moderately concentrated landscape, with several major players holding significant market share. Technological innovation is a key driver, spurred by the increasing sophistication of vehicle electronics and the growing threat of cyberattacks. Stringent government regulations mandating vehicle cybersecurity are also shaping the market. Competitive substitutes, such as traditional security measures, are gradually being replaced by more advanced solutions. The end-user demographic primarily consists of automotive manufacturers, Tier-1 suppliers, and fleet operators. Mergers and acquisitions (M&A) are frequent, reflecting consolidation and expansion strategies.
- Market Concentration: Moderately concentrated, with top 5 players holding approximately xx% of the market share in 2024.
- Technological Innovation: Focus on AI, machine learning, and advanced encryption technologies. Barriers include high R&D costs and integration complexities.
- Regulatory Framework: Stringent regulations, particularly in regions like Europe and North America, are driving adoption.
- M&A Activity: An average of xx M&A deals per year were observed during 2019-2024, indicating a consolidating market.
- Competitive Substitutes: Traditional security measures are being phased out in favor of more robust, integrated solutions.
Cyber Security Vehicle Market Growth Trends & Insights
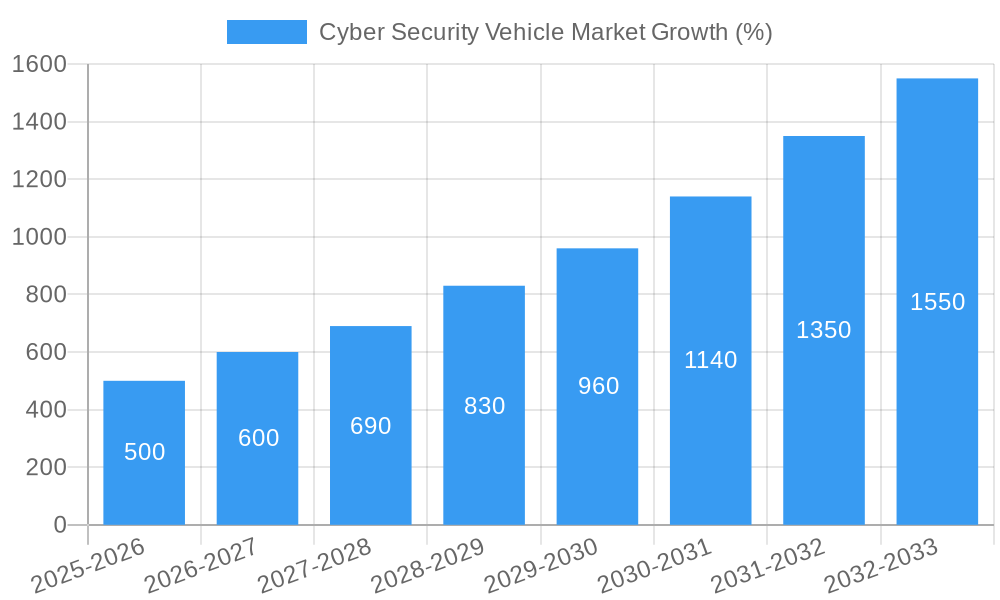
The Cyber Security Vehicle Market experienced significant growth between 2019 and 2024, with a Compound Annual Growth Rate (CAGR) of xx%. This growth is attributed to the increasing connectivity of vehicles, the rising adoption of Advanced Driver-Assistance Systems (ADAS), and the heightened awareness of cybersecurity risks within the automotive industry. Market penetration is expected to reach xx% by 2033, driven by technological advancements and supportive government policies. Disruptive technologies, such as blockchain and quantum-resistant cryptography, are poised to further accelerate market growth. Consumer behavior is shifting towards a greater demand for secure and reliable vehicles, influencing purchasing decisions. Market size is projected to reach xx million units by 2033.
Dominant Regions, Countries, or Segments in Cyber Security Vehicle Market
North America currently holds the largest market share in the Cyber Security Vehicle Market, driven by early adoption of advanced technologies and robust regulatory frameworks. Europe follows closely, with strong government initiatives fostering cybersecurity investments. Asia-Pacific is projected to witness the fastest growth, fueled by burgeoning automotive production and increasing digitalization.
By Type of Security:
- Network Security: Dominates the market due to the critical role of securing vehicle networks against external threats.
- Application Security: Significant growth expected due to the rising number of software applications in vehicles.
- Cloud Security: Emergence of cloud-based services for vehicle management is driving market expansion.
By Type of Solution:
- Software-Based: Largest market share due to flexibility and scalability.
- Hardware-Based: Significant market share due to robustness and security features.
Cyber Security Vehicle Market Product Landscape
The Cyber Security Vehicle Market offers a range of solutions, from basic intrusion detection systems to sophisticated threat intelligence platforms. Products are increasingly integrated and offer comprehensive protection against various cyber threats. Key features include real-time threat detection, automated response mechanisms, and remote vulnerability management. Technological advancements focus on AI-powered threat analysis and proactive security measures. Unique selling propositions include ease of integration, low latency response times, and comprehensive security coverage.
Key Drivers, Barriers & Challenges in Cyber Security Vehicle Market
Key Drivers:
- Increasing vehicle connectivity and data exchange.
- Growing adoption of ADAS and autonomous driving technologies.
- Rising cybersecurity threats and regulations.
Challenges & Restraints:
- High implementation costs and integration complexities.
- Lack of standardization and interoperability across different systems.
- Supply chain disruptions affecting component availability. This caused a xx% decrease in production in Q3 2022.
Emerging Opportunities in Cyber Security Vehicle Market
- Expansion into emerging markets with growing automotive sectors.
- Development of specialized solutions for specific vehicle segments (e.g., autonomous vehicles, electric vehicles).
- Integration of cybersecurity into vehicle design and manufacturing processes.
Growth Accelerators in the Cyber Security Vehicle Market Industry
Strategic partnerships between automotive manufacturers and cybersecurity companies are accelerating market growth. Technological breakthroughs in AI and machine learning are enhancing the effectiveness of security solutions. Government support and regulatory incentives are further stimulating market expansion.
Key Players Shaping the Cyber Security Vehicle Market Market
- Karamba Security Ltd
- Harman International Industries Inc (Samsung)
- Escrypt GmbH
- Infineon Technologies AG
- Honeywell International Inc
- Denso Corporation
- Visteon Corporation
- Delphi Automotive PLC
- NXP Semiconductors NV
- Arilou Technologies Ltd
- Cisco Systems Inc
- Continental AG
- Argus Cybersecurity Ltd
- Secunet AG
Notable Milestones in Cyber Security Vehicle Market Sector
- July 2022: Infineon Technologies acquires NoBug Consulting SRL and NoBug d.o.o., significantly enhancing its capabilities in IoT product development and cybersecurity.
- July 2022: NXP Semiconductors collaborates with Foxconn to develop platforms for next-generation connected vehicles, strengthening its position in the automotive cybersecurity market.
In-Depth Cyber Security Vehicle Market Market Outlook
The Cyber Security Vehicle Market is poised for continued strong growth, driven by technological advancements, increasing vehicle connectivity, and heightened cybersecurity awareness. Strategic partnerships, M&A activity, and innovative product development will further shape the market landscape. The market presents significant opportunities for companies that can offer robust, scalable, and integrated security solutions. The forecast indicates a sustained CAGR of xx% during the period 2025-2033, resulting in a market size of xx million units by 2033.
Cyber Security Vehicle Market Segmentation
-
1. Type of Solution
- 1.1. Software-Based
- 1.2. Hardware-Based
- 1.3. Professional Service
- 1.4. Integration
- 1.5. Other Types of Solution
-
2. Type of Security
- 2.1. Network Security
- 2.2. Application Security
- 2.3. Cloud Security
- 2.4. Other Types of Security
Cyber Security Vehicle Market Segmentation By Geography
- 1. North America
- 2. Europe
- 3. Asia
- 4. Australia and New Zealand
- 5. Latin America
- 6. Middle East and Africa
Cyber Security Vehicle Market REPORT HIGHLIGHTS
| Aspects | Details |
|---|---|
| Study Period | 2019-2033 |
| Base Year | 2024 |
| Estimated Year | 2025 |
| Forecast Period | 2025-2033 |
| Historical Period | 2019-2024 |
| Growth Rate | CAGR of 16.66% from 2019-2033 |
| Segmentation |
|
Table of Contents
- 1. Introduction
- 1.1. Research Scope
- 1.2. Market Segmentation
- 1.3. Research Methodology
- 1.4. Definitions and Assumptions
- 2. Executive Summary
- 2.1. Introduction
- 3. Market Dynamics
- 3.1. Introduction
- 3.2. Market Drivers
- 3.2.1. Increasing Remote Working and Real-time Collaboration in Organizations
- 3.3. Market Restrains
- 3.3.1. Lack of Awareness and Digital Resources in Developing Countries
- 3.4. Market Trends
- 3.4.1. Rising Security Threats as More Technologies Get Integrated Into Cars is Expected to Drive the Market
- 4. Market Factor Analysis
- 4.1. Porters Five Forces
- 4.2. Supply/Value Chain
- 4.3. PESTEL analysis
- 4.4. Market Entropy
- 4.5. Patent/Trademark Analysis
- 5. Global Cyber Security Vehicle Market Analysis, Insights and Forecast, 2019-2031
- 5.1. Market Analysis, Insights and Forecast - by Type of Solution
- 5.1.1. Software-Based
- 5.1.2. Hardware-Based
- 5.1.3. Professional Service
- 5.1.4. Integration
- 5.1.5. Other Types of Solution
- 5.2. Market Analysis, Insights and Forecast - by Type of Security
- 5.2.1. Network Security
- 5.2.2. Application Security
- 5.2.3. Cloud Security
- 5.2.4. Other Types of Security
- 5.3. Market Analysis, Insights and Forecast - by Region
- 5.3.1. North America
- 5.3.2. Europe
- 5.3.3. Asia
- 5.3.4. Australia and New Zealand
- 5.3.5. Latin America
- 5.3.6. Middle East and Africa
- 5.1. Market Analysis, Insights and Forecast - by Type of Solution
- 6. North America Cyber Security Vehicle Market Analysis, Insights and Forecast, 2019-2031
- 6.1. Market Analysis, Insights and Forecast - by Type of Solution
- 6.1.1. Software-Based
- 6.1.2. Hardware-Based
- 6.1.3. Professional Service
- 6.1.4. Integration
- 6.1.5. Other Types of Solution
- 6.2. Market Analysis, Insights and Forecast - by Type of Security
- 6.2.1. Network Security
- 6.2.2. Application Security
- 6.2.3. Cloud Security
- 6.2.4. Other Types of Security
- 6.1. Market Analysis, Insights and Forecast - by Type of Solution
- 7. Europe Cyber Security Vehicle Market Analysis, Insights and Forecast, 2019-2031
- 7.1. Market Analysis, Insights and Forecast - by Type of Solution
- 7.1.1. Software-Based
- 7.1.2. Hardware-Based
- 7.1.3. Professional Service
- 7.1.4. Integration
- 7.1.5. Other Types of Solution
- 7.2. Market Analysis, Insights and Forecast - by Type of Security
- 7.2.1. Network Security
- 7.2.2. Application Security
- 7.2.3. Cloud Security
- 7.2.4. Other Types of Security
- 7.1. Market Analysis, Insights and Forecast - by Type of Solution
- 8. Asia Cyber Security Vehicle Market Analysis, Insights and Forecast, 2019-2031
- 8.1. Market Analysis, Insights and Forecast - by Type of Solution
- 8.1.1. Software-Based
- 8.1.2. Hardware-Based
- 8.1.3. Professional Service
- 8.1.4. Integration
- 8.1.5. Other Types of Solution
- 8.2. Market Analysis, Insights and Forecast - by Type of Security
- 8.2.1. Network Security
- 8.2.2. Application Security
- 8.2.3. Cloud Security
- 8.2.4. Other Types of Security
- 8.1. Market Analysis, Insights and Forecast - by Type of Solution
- 9. Australia and New Zealand Cyber Security Vehicle Market Analysis, Insights and Forecast, 2019-2031
- 9.1. Market Analysis, Insights and Forecast - by Type of Solution
- 9.1.1. Software-Based
- 9.1.2. Hardware-Based
- 9.1.3. Professional Service
- 9.1.4. Integration
- 9.1.5. Other Types of Solution
- 9.2. Market Analysis, Insights and Forecast - by Type of Security
- 9.2.1. Network Security
- 9.2.2. Application Security
- 9.2.3. Cloud Security
- 9.2.4. Other Types of Security
- 9.1. Market Analysis, Insights and Forecast - by Type of Solution
- 10. Latin America Cyber Security Vehicle Market Analysis, Insights and Forecast, 2019-2031
- 10.1. Market Analysis, Insights and Forecast - by Type of Solution
- 10.1.1. Software-Based
- 10.1.2. Hardware-Based
- 10.1.3. Professional Service
- 10.1.4. Integration
- 10.1.5. Other Types of Solution
- 10.2. Market Analysis, Insights and Forecast - by Type of Security
- 10.2.1. Network Security
- 10.2.2. Application Security
- 10.2.3. Cloud Security
- 10.2.4. Other Types of Security
- 10.1. Market Analysis, Insights and Forecast - by Type of Solution
- 11. Middle East and Africa Cyber Security Vehicle Market Analysis, Insights and Forecast, 2019-2031
- 11.1. Market Analysis, Insights and Forecast - by Type of Solution
- 11.1.1. Software-Based
- 11.1.2. Hardware-Based
- 11.1.3. Professional Service
- 11.1.4. Integration
- 11.1.5. Other Types of Solution
- 11.2. Market Analysis, Insights and Forecast - by Type of Security
- 11.2.1. Network Security
- 11.2.2. Application Security
- 11.2.3. Cloud Security
- 11.2.4. Other Types of Security
- 11.1. Market Analysis, Insights and Forecast - by Type of Solution
- 12. North America Cyber Security Vehicle Market Analysis, Insights and Forecast, 2019-2031
- 12.1. Market Analysis, Insights and Forecast - By Country/Sub-region
- 12.1.1 United States
- 12.1.2 Canada
- 12.1.3 Mexico
- 13. Europe Cyber Security Vehicle Market Analysis, Insights and Forecast, 2019-2031
- 13.1. Market Analysis, Insights and Forecast - By Country/Sub-region
- 13.1.1 Germany
- 13.1.2 United Kingdom
- 13.1.3 France
- 13.1.4 Spain
- 13.1.5 Italy
- 13.1.6 Spain
- 13.1.7 Belgium
- 13.1.8 Netherland
- 13.1.9 Nordics
- 13.1.10 Rest of Europe
- 14. Asia Pacific Cyber Security Vehicle Market Analysis, Insights and Forecast, 2019-2031
- 14.1. Market Analysis, Insights and Forecast - By Country/Sub-region
- 14.1.1 China
- 14.1.2 Japan
- 14.1.3 India
- 14.1.4 South Korea
- 14.1.5 Southeast Asia
- 14.1.6 Australia
- 14.1.7 Indonesia
- 14.1.8 Phillipes
- 14.1.9 Singapore
- 14.1.10 Thailandc
- 14.1.11 Rest of Asia Pacific
- 15. South America Cyber Security Vehicle Market Analysis, Insights and Forecast, 2019-2031
- 15.1. Market Analysis, Insights and Forecast - By Country/Sub-region
- 15.1.1 Brazil
- 15.1.2 Argentina
- 15.1.3 Peru
- 15.1.4 Chile
- 15.1.5 Colombia
- 15.1.6 Ecuador
- 15.1.7 Venezuela
- 15.1.8 Rest of South America
- 16. North America Cyber Security Vehicle Market Analysis, Insights and Forecast, 2019-2031
- 16.1. Market Analysis, Insights and Forecast - By Country/Sub-region
- 16.1.1 United States
- 16.1.2 Canada
- 16.1.3 Mexico
- 17. MEA Cyber Security Vehicle Market Analysis, Insights and Forecast, 2019-2031
- 17.1. Market Analysis, Insights and Forecast - By Country/Sub-region
- 17.1.1 United Arab Emirates
- 17.1.2 Saudi Arabia
- 17.1.3 South Africa
- 17.1.4 Rest of Middle East and Africa
- 18. Competitive Analysis
- 18.1. Global Market Share Analysis 2024
- 18.2. Company Profiles
- 18.2.1 Karamba Security Ltd
- 18.2.1.1. Overview
- 18.2.1.2. Products
- 18.2.1.3. SWOT Analysis
- 18.2.1.4. Recent Developments
- 18.2.1.5. Financials (Based on Availability)
- 18.2.2 Harman International Industries Inc (Samsung)
- 18.2.2.1. Overview
- 18.2.2.2. Products
- 18.2.2.3. SWOT Analysis
- 18.2.2.4. Recent Developments
- 18.2.2.5. Financials (Based on Availability)
- 18.2.3 Escrypt GmbH
- 18.2.3.1. Overview
- 18.2.3.2. Products
- 18.2.3.3. SWOT Analysis
- 18.2.3.4. Recent Developments
- 18.2.3.5. Financials (Based on Availability)
- 18.2.4 Infineon Technologies AG
- 18.2.4.1. Overview
- 18.2.4.2. Products
- 18.2.4.3. SWOT Analysis
- 18.2.4.4. Recent Developments
- 18.2.4.5. Financials (Based on Availability)
- 18.2.5 Honeywell International Inc
- 18.2.5.1. Overview
- 18.2.5.2. Products
- 18.2.5.3. SWOT Analysis
- 18.2.5.4. Recent Developments
- 18.2.5.5. Financials (Based on Availability)
- 18.2.6 Denso Corporation
- 18.2.6.1. Overview
- 18.2.6.2. Products
- 18.2.6.3. SWOT Analysis
- 18.2.6.4. Recent Developments
- 18.2.6.5. Financials (Based on Availability)
- 18.2.7 Visteon Corporation
- 18.2.7.1. Overview
- 18.2.7.2. Products
- 18.2.7.3. SWOT Analysis
- 18.2.7.4. Recent Developments
- 18.2.7.5. Financials (Based on Availability)
- 18.2.8 Delphi Automotive PLC
- 18.2.8.1. Overview
- 18.2.8.2. Products
- 18.2.8.3. SWOT Analysis
- 18.2.8.4. Recent Developments
- 18.2.8.5. Financials (Based on Availability)
- 18.2.9 NXP Semiconductors NV
- 18.2.9.1. Overview
- 18.2.9.2. Products
- 18.2.9.3. SWOT Analysis
- 18.2.9.4. Recent Developments
- 18.2.9.5. Financials (Based on Availability)
- 18.2.10 Arilou Technologies Ltd
- 18.2.10.1. Overview
- 18.2.10.2. Products
- 18.2.10.3. SWOT Analysis
- 18.2.10.4. Recent Developments
- 18.2.10.5. Financials (Based on Availability)
- 18.2.11 Cisco Systems Inc
- 18.2.11.1. Overview
- 18.2.11.2. Products
- 18.2.11.3. SWOT Analysis
- 18.2.11.4. Recent Developments
- 18.2.11.5. Financials (Based on Availability)
- 18.2.12 Continental AG
- 18.2.12.1. Overview
- 18.2.12.2. Products
- 18.2.12.3. SWOT Analysis
- 18.2.12.4. Recent Developments
- 18.2.12.5. Financials (Based on Availability)
- 18.2.13 Argus Cybersecurity Ltd
- 18.2.13.1. Overview
- 18.2.13.2. Products
- 18.2.13.3. SWOT Analysis
- 18.2.13.4. Recent Developments
- 18.2.13.5. Financials (Based on Availability)
- 18.2.14 Secunet AG
- 18.2.14.1. Overview
- 18.2.14.2. Products
- 18.2.14.3. SWOT Analysis
- 18.2.14.4. Recent Developments
- 18.2.14.5. Financials (Based on Availability)
- 18.2.1 Karamba Security Ltd
List of Figures
- Figure 1: Global Cyber Security Vehicle Market Revenue Breakdown (Million, %) by Region 2024 & 2032
- Figure 2: North America Cyber Security Vehicle Market Revenue (Million), by Country 2024 & 2032
- Figure 3: North America Cyber Security Vehicle Market Revenue Share (%), by Country 2024 & 2032
- Figure 4: Europe Cyber Security Vehicle Market Revenue (Million), by Country 2024 & 2032
- Figure 5: Europe Cyber Security Vehicle Market Revenue Share (%), by Country 2024 & 2032
- Figure 6: Asia Pacific Cyber Security Vehicle Market Revenue (Million), by Country 2024 & 2032
- Figure 7: Asia Pacific Cyber Security Vehicle Market Revenue Share (%), by Country 2024 & 2032
- Figure 8: South America Cyber Security Vehicle Market Revenue (Million), by Country 2024 & 2032
- Figure 9: South America Cyber Security Vehicle Market Revenue Share (%), by Country 2024 & 2032
- Figure 10: North America Cyber Security Vehicle Market Revenue (Million), by Country 2024 & 2032
- Figure 11: North America Cyber Security Vehicle Market Revenue Share (%), by Country 2024 & 2032
- Figure 12: MEA Cyber Security Vehicle Market Revenue (Million), by Country 2024 & 2032
- Figure 13: MEA Cyber Security Vehicle Market Revenue Share (%), by Country 2024 & 2032
- Figure 14: North America Cyber Security Vehicle Market Revenue (Million), by Type of Solution 2024 & 2032
- Figure 15: North America Cyber Security Vehicle Market Revenue Share (%), by Type of Solution 2024 & 2032
- Figure 16: North America Cyber Security Vehicle Market Revenue (Million), by Type of Security 2024 & 2032
- Figure 17: North America Cyber Security Vehicle Market Revenue Share (%), by Type of Security 2024 & 2032
- Figure 18: North America Cyber Security Vehicle Market Revenue (Million), by Country 2024 & 2032
- Figure 19: North America Cyber Security Vehicle Market Revenue Share (%), by Country 2024 & 2032
- Figure 20: Europe Cyber Security Vehicle Market Revenue (Million), by Type of Solution 2024 & 2032
- Figure 21: Europe Cyber Security Vehicle Market Revenue Share (%), by Type of Solution 2024 & 2032
- Figure 22: Europe Cyber Security Vehicle Market Revenue (Million), by Type of Security 2024 & 2032
- Figure 23: Europe Cyber Security Vehicle Market Revenue Share (%), by Type of Security 2024 & 2032
- Figure 24: Europe Cyber Security Vehicle Market Revenue (Million), by Country 2024 & 2032
- Figure 25: Europe Cyber Security Vehicle Market Revenue Share (%), by Country 2024 & 2032
- Figure 26: Asia Cyber Security Vehicle Market Revenue (Million), by Type of Solution 2024 & 2032
- Figure 27: Asia Cyber Security Vehicle Market Revenue Share (%), by Type of Solution 2024 & 2032
- Figure 28: Asia Cyber Security Vehicle Market Revenue (Million), by Type of Security 2024 & 2032
- Figure 29: Asia Cyber Security Vehicle Market Revenue Share (%), by Type of Security 2024 & 2032
- Figure 30: Asia Cyber Security Vehicle Market Revenue (Million), by Country 2024 & 2032
- Figure 31: Asia Cyber Security Vehicle Market Revenue Share (%), by Country 2024 & 2032
- Figure 32: Australia and New Zealand Cyber Security Vehicle Market Revenue (Million), by Type of Solution 2024 & 2032
- Figure 33: Australia and New Zealand Cyber Security Vehicle Market Revenue Share (%), by Type of Solution 2024 & 2032
- Figure 34: Australia and New Zealand Cyber Security Vehicle Market Revenue (Million), by Type of Security 2024 & 2032
- Figure 35: Australia and New Zealand Cyber Security Vehicle Market Revenue Share (%), by Type of Security 2024 & 2032
- Figure 36: Australia and New Zealand Cyber Security Vehicle Market Revenue (Million), by Country 2024 & 2032
- Figure 37: Australia and New Zealand Cyber Security Vehicle Market Revenue Share (%), by Country 2024 & 2032
- Figure 38: Latin America Cyber Security Vehicle Market Revenue (Million), by Type of Solution 2024 & 2032
- Figure 39: Latin America Cyber Security Vehicle Market Revenue Share (%), by Type of Solution 2024 & 2032
- Figure 40: Latin America Cyber Security Vehicle Market Revenue (Million), by Type of Security 2024 & 2032
- Figure 41: Latin America Cyber Security Vehicle Market Revenue Share (%), by Type of Security 2024 & 2032
- Figure 42: Latin America Cyber Security Vehicle Market Revenue (Million), by Country 2024 & 2032
- Figure 43: Latin America Cyber Security Vehicle Market Revenue Share (%), by Country 2024 & 2032
- Figure 44: Middle East and Africa Cyber Security Vehicle Market Revenue (Million), by Type of Solution 2024 & 2032
- Figure 45: Middle East and Africa Cyber Security Vehicle Market Revenue Share (%), by Type of Solution 2024 & 2032
- Figure 46: Middle East and Africa Cyber Security Vehicle Market Revenue (Million), by Type of Security 2024 & 2032
- Figure 47: Middle East and Africa Cyber Security Vehicle Market Revenue Share (%), by Type of Security 2024 & 2032
- Figure 48: Middle East and Africa Cyber Security Vehicle Market Revenue (Million), by Country 2024 & 2032
- Figure 49: Middle East and Africa Cyber Security Vehicle Market Revenue Share (%), by Country 2024 & 2032
List of Tables
- Table 1: Global Cyber Security Vehicle Market Revenue Million Forecast, by Region 2019 & 2032
- Table 2: Global Cyber Security Vehicle Market Revenue Million Forecast, by Type of Solution 2019 & 2032
- Table 3: Global Cyber Security Vehicle Market Revenue Million Forecast, by Type of Security 2019 & 2032
- Table 4: Global Cyber Security Vehicle Market Revenue Million Forecast, by Region 2019 & 2032
- Table 5: Global Cyber Security Vehicle Market Revenue Million Forecast, by Country 2019 & 2032
- Table 6: United States Cyber Security Vehicle Market Revenue (Million) Forecast, by Application 2019 & 2032
- Table 7: Canada Cyber Security Vehicle Market Revenue (Million) Forecast, by Application 2019 & 2032
- Table 8: Mexico Cyber Security Vehicle Market Revenue (Million) Forecast, by Application 2019 & 2032
- Table 9: Global Cyber Security Vehicle Market Revenue Million Forecast, by Country 2019 & 2032
- Table 10: Germany Cyber Security Vehicle Market Revenue (Million) Forecast, by Application 2019 & 2032
- Table 11: United Kingdom Cyber Security Vehicle Market Revenue (Million) Forecast, by Application 2019 & 2032
- Table 12: France Cyber Security Vehicle Market Revenue (Million) Forecast, by Application 2019 & 2032
- Table 13: Spain Cyber Security Vehicle Market Revenue (Million) Forecast, by Application 2019 & 2032
- Table 14: Italy Cyber Security Vehicle Market Revenue (Million) Forecast, by Application 2019 & 2032
- Table 15: Spain Cyber Security Vehicle Market Revenue (Million) Forecast, by Application 2019 & 2032
- Table 16: Belgium Cyber Security Vehicle Market Revenue (Million) Forecast, by Application 2019 & 2032
- Table 17: Netherland Cyber Security Vehicle Market Revenue (Million) Forecast, by Application 2019 & 2032
- Table 18: Nordics Cyber Security Vehicle Market Revenue (Million) Forecast, by Application 2019 & 2032
- Table 19: Rest of Europe Cyber Security Vehicle Market Revenue (Million) Forecast, by Application 2019 & 2032
- Table 20: Global Cyber Security Vehicle Market Revenue Million Forecast, by Country 2019 & 2032
- Table 21: China Cyber Security Vehicle Market Revenue (Million) Forecast, by Application 2019 & 2032
- Table 22: Japan Cyber Security Vehicle Market Revenue (Million) Forecast, by Application 2019 & 2032
- Table 23: India Cyber Security Vehicle Market Revenue (Million) Forecast, by Application 2019 & 2032
- Table 24: South Korea Cyber Security Vehicle Market Revenue (Million) Forecast, by Application 2019 & 2032
- Table 25: Southeast Asia Cyber Security Vehicle Market Revenue (Million) Forecast, by Application 2019 & 2032
- Table 26: Australia Cyber Security Vehicle Market Revenue (Million) Forecast, by Application 2019 & 2032
- Table 27: Indonesia Cyber Security Vehicle Market Revenue (Million) Forecast, by Application 2019 & 2032
- Table 28: Phillipes Cyber Security Vehicle Market Revenue (Million) Forecast, by Application 2019 & 2032
- Table 29: Singapore Cyber Security Vehicle Market Revenue (Million) Forecast, by Application 2019 & 2032
- Table 30: Thailandc Cyber Security Vehicle Market Revenue (Million) Forecast, by Application 2019 & 2032
- Table 31: Rest of Asia Pacific Cyber Security Vehicle Market Revenue (Million) Forecast, by Application 2019 & 2032
- Table 32: Global Cyber Security Vehicle Market Revenue Million Forecast, by Country 2019 & 2032
- Table 33: Brazil Cyber Security Vehicle Market Revenue (Million) Forecast, by Application 2019 & 2032
- Table 34: Argentina Cyber Security Vehicle Market Revenue (Million) Forecast, by Application 2019 & 2032
- Table 35: Peru Cyber Security Vehicle Market Revenue (Million) Forecast, by Application 2019 & 2032
- Table 36: Chile Cyber Security Vehicle Market Revenue (Million) Forecast, by Application 2019 & 2032
- Table 37: Colombia Cyber Security Vehicle Market Revenue (Million) Forecast, by Application 2019 & 2032
- Table 38: Ecuador Cyber Security Vehicle Market Revenue (Million) Forecast, by Application 2019 & 2032
- Table 39: Venezuela Cyber Security Vehicle Market Revenue (Million) Forecast, by Application 2019 & 2032
- Table 40: Rest of South America Cyber Security Vehicle Market Revenue (Million) Forecast, by Application 2019 & 2032
- Table 41: Global Cyber Security Vehicle Market Revenue Million Forecast, by Country 2019 & 2032
- Table 42: United States Cyber Security Vehicle Market Revenue (Million) Forecast, by Application 2019 & 2032
- Table 43: Canada Cyber Security Vehicle Market Revenue (Million) Forecast, by Application 2019 & 2032
- Table 44: Mexico Cyber Security Vehicle Market Revenue (Million) Forecast, by Application 2019 & 2032
- Table 45: Global Cyber Security Vehicle Market Revenue Million Forecast, by Country 2019 & 2032
- Table 46: United Arab Emirates Cyber Security Vehicle Market Revenue (Million) Forecast, by Application 2019 & 2032
- Table 47: Saudi Arabia Cyber Security Vehicle Market Revenue (Million) Forecast, by Application 2019 & 2032
- Table 48: South Africa Cyber Security Vehicle Market Revenue (Million) Forecast, by Application 2019 & 2032
- Table 49: Rest of Middle East and Africa Cyber Security Vehicle Market Revenue (Million) Forecast, by Application 2019 & 2032
- Table 50: Global Cyber Security Vehicle Market Revenue Million Forecast, by Type of Solution 2019 & 2032
- Table 51: Global Cyber Security Vehicle Market Revenue Million Forecast, by Type of Security 2019 & 2032
- Table 52: Global Cyber Security Vehicle Market Revenue Million Forecast, by Country 2019 & 2032
- Table 53: Global Cyber Security Vehicle Market Revenue Million Forecast, by Type of Solution 2019 & 2032
- Table 54: Global Cyber Security Vehicle Market Revenue Million Forecast, by Type of Security 2019 & 2032
- Table 55: Global Cyber Security Vehicle Market Revenue Million Forecast, by Country 2019 & 2032
- Table 56: Global Cyber Security Vehicle Market Revenue Million Forecast, by Type of Solution 2019 & 2032
- Table 57: Global Cyber Security Vehicle Market Revenue Million Forecast, by Type of Security 2019 & 2032
- Table 58: Global Cyber Security Vehicle Market Revenue Million Forecast, by Country 2019 & 2032
- Table 59: Global Cyber Security Vehicle Market Revenue Million Forecast, by Type of Solution 2019 & 2032
- Table 60: Global Cyber Security Vehicle Market Revenue Million Forecast, by Type of Security 2019 & 2032
- Table 61: Global Cyber Security Vehicle Market Revenue Million Forecast, by Country 2019 & 2032
- Table 62: Global Cyber Security Vehicle Market Revenue Million Forecast, by Type of Solution 2019 & 2032
- Table 63: Global Cyber Security Vehicle Market Revenue Million Forecast, by Type of Security 2019 & 2032
- Table 64: Global Cyber Security Vehicle Market Revenue Million Forecast, by Country 2019 & 2032
- Table 65: Global Cyber Security Vehicle Market Revenue Million Forecast, by Type of Solution 2019 & 2032
- Table 66: Global Cyber Security Vehicle Market Revenue Million Forecast, by Type of Security 2019 & 2032
- Table 67: Global Cyber Security Vehicle Market Revenue Million Forecast, by Country 2019 & 2032
Frequently Asked Questions
1. What is the projected Compound Annual Growth Rate (CAGR) of the Cyber Security Vehicle Market?
The projected CAGR is approximately 16.66%.
2. Which companies are prominent players in the Cyber Security Vehicle Market?
Key companies in the market include Karamba Security Ltd , Harman International Industries Inc (Samsung), Escrypt GmbH, Infineon Technologies AG, Honeywell International Inc, Denso Corporation, Visteon Corporation, Delphi Automotive PLC, NXP Semiconductors NV, Arilou Technologies Ltd, Cisco Systems Inc, Continental AG, Argus Cybersecurity Ltd, Secunet AG.
3. What are the main segments of the Cyber Security Vehicle Market?
The market segments include Type of Solution, Type of Security.
4. Can you provide details about the market size?
The market size is estimated to be USD 3.06 Million as of 2022.
5. What are some drivers contributing to market growth?
Increasing Remote Working and Real-time Collaboration in Organizations.
6. What are the notable trends driving market growth?
Rising Security Threats as More Technologies Get Integrated Into Cars is Expected to Drive the Market.
7. Are there any restraints impacting market growth?
Lack of Awareness and Digital Resources in Developing Countries.
8. Can you provide examples of recent developments in the market?
July 2022: NoBug Consulting SRL (Romania) and NoBug d.o.o. were acquired by Infineon Technologies (Serbia). NoBug, founded in 1998, is a privately held engineering firm that provides verification and design services for all digital functions of semiconductor products. Infineon is enhancing its Connected Secure Systems (CSS) Division's capacity to work on complex IoT product development. Thus, Infineon is laying the groundwork for the future IoT infrastructure, enabling cybersecurity, AI, machine learning, and robust connections.
9. What pricing options are available for accessing the report?
Pricing options include single-user, multi-user, and enterprise licenses priced at USD 4750, USD 5250, and USD 8750 respectively.
10. Is the market size provided in terms of value or volume?
The market size is provided in terms of value, measured in Million.
11. Are there any specific market keywords associated with the report?
Yes, the market keyword associated with the report is "Cyber Security Vehicle Market," which aids in identifying and referencing the specific market segment covered.
12. How do I determine which pricing option suits my needs best?
The pricing options vary based on user requirements and access needs. Individual users may opt for single-user licenses, while businesses requiring broader access may choose multi-user or enterprise licenses for cost-effective access to the report.
13. Are there any additional resources or data provided in the Cyber Security Vehicle Market report?
While the report offers comprehensive insights, it's advisable to review the specific contents or supplementary materials provided to ascertain if additional resources or data are available.
14. How can I stay updated on further developments or reports in the Cyber Security Vehicle Market?
To stay informed about further developments, trends, and reports in the Cyber Security Vehicle Market, consider subscribing to industry newsletters, following relevant companies and organizations, or regularly checking reputable industry news sources and publications.
Methodology
Step 1 - Identification of Relevant Samples Size from Population Database


Step 2 - Approaches for Defining Global Market Size (Value, Volume* & Price*)

Note*: In applicable scenarios
Step 3 - Data Sources
Primary Research
- Web Analytics
- Survey Reports
- Research Institute
- Latest Research Reports
- Opinion Leaders
Secondary Research
- Annual Reports
- White Paper
- Latest Press Release
- Industry Association
- Paid Database
- Investor Presentations

Step 4 - Data Triangulation
Involves using different sources of information in order to increase the validity of a study
These sources are likely to be stakeholders in a program - participants, other researchers, program staff, other community members, and so on.
Then we put all data in single framework & apply various statistical tools to find out the dynamic on the market.
During the analysis stage, feedback from the stakeholder groups would be compared to determine areas of agreement as well as areas of divergence


