Key Insights
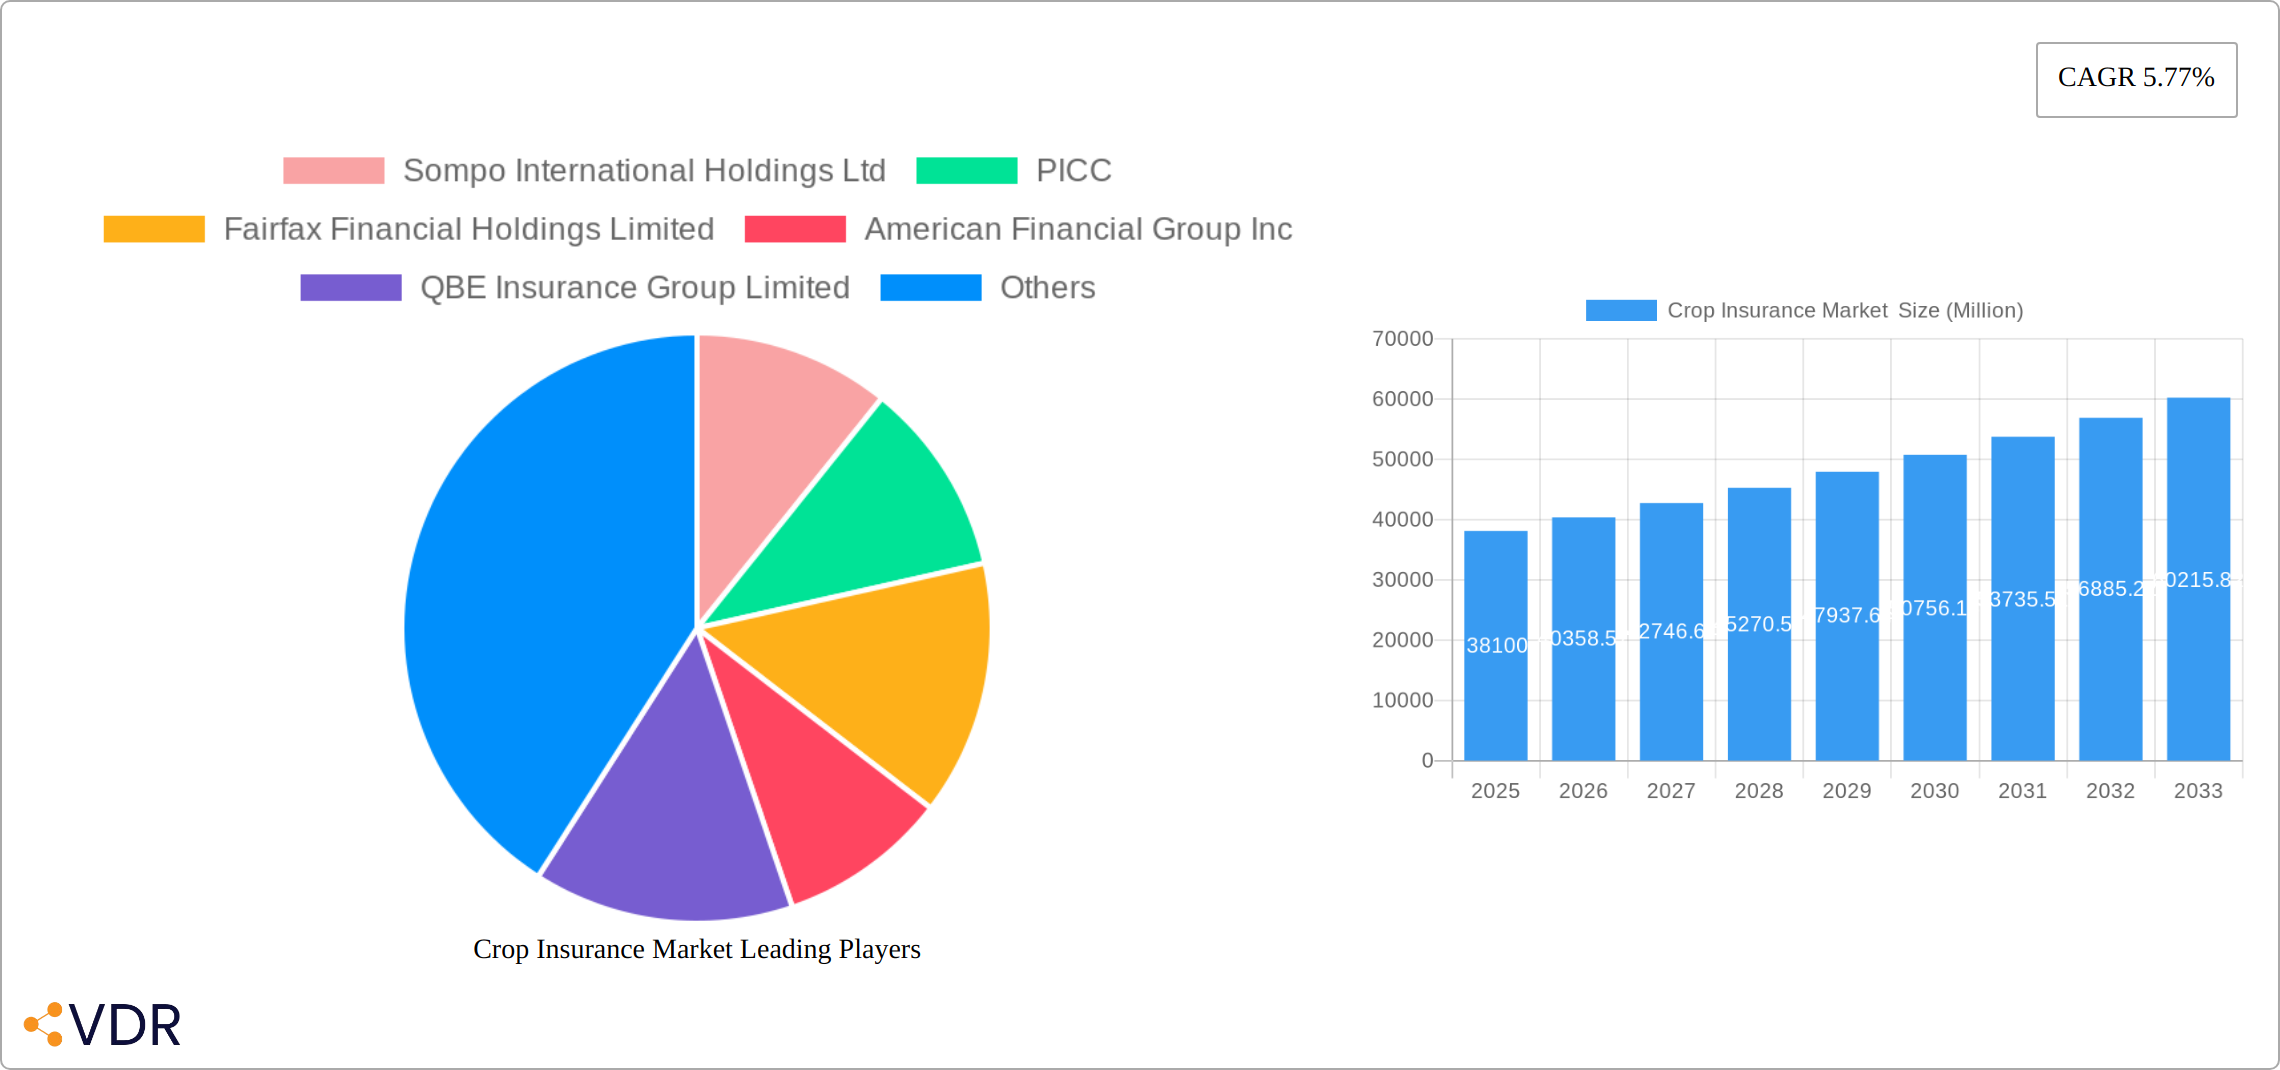
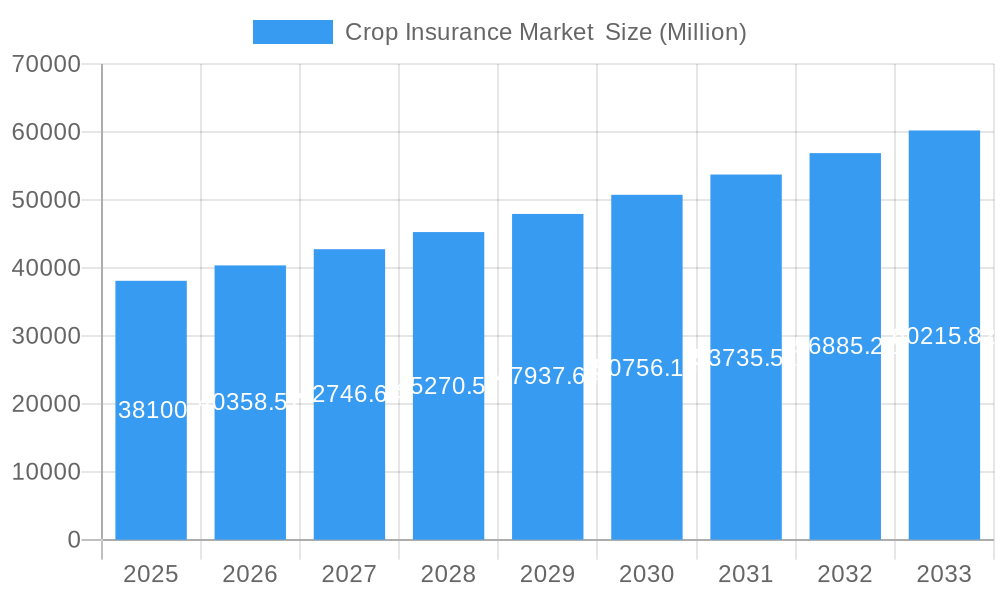
The global crop insurance market, valued at $38.10 billion in 2025, is projected to experience robust growth, exhibiting a compound annual growth rate (CAGR) of 5.77% from 2025 to 2033. This expansion is driven by several key factors. Increasing frequency and severity of climate change-related events like droughts, floods, and extreme weather patterns are significantly impacting agricultural yields, compelling farmers to seek insurance protection. Government initiatives promoting agricultural insurance schemes, coupled with rising awareness among farmers regarding the benefits of risk mitigation, are further fueling market growth. The market is segmented by coverage type (localized calamities, sowing/planting/germination risk, standing crop loss, post-harvest losses), distribution channels (banks, insurance companies, brokers and agents), and insurance type (multiple peril crop insurance, actual production history, crop revenue coverage). The diverse product offerings cater to the specific needs of various farming communities and risk profiles. North America, Europe, and Asia-Pacific are currently the dominant regions, but emerging economies in Asia and Africa are poised for significant growth, driven by expanding agricultural sectors and increasing government support.
Crop Insurance Market Market Size (In Billion)
Competition in the crop insurance market is intense, with both established global players like Sompo International Holdings Ltd, PICC, Fairfax Financial Holdings Limited, and American Financial Group Inc, and regional insurers like ICICI Lombard and Agriculture Insurance Company of India Limited (AIC) vying for market share. The market's future trajectory depends heavily on technological advancements, particularly in precision agriculture and remote sensing. These technologies enable more accurate risk assessment and claims processing, leading to improved efficiency and affordability of insurance products. Furthermore, the development of innovative insurance products tailored to specific crop types and regional vulnerabilities will be critical in achieving wider market penetration and driving sustainable growth. The ongoing evolution of agricultural practices and increasing reliance on data-driven decision-making will continue to shape the landscape of the crop insurance industry.
Crop Insurance Market Company Market Share
Crop Insurance Market: A Comprehensive Report (2019-2033)
This comprehensive report provides a detailed analysis of the Crop Insurance Market, encompassing market dynamics, growth trends, regional analysis, product landscape, key players, and future outlook. The study period covers 2019-2033, with 2025 as the base and estimated year. The report segments the market by coverage (Localized Calamities, Sowing/Planting/Germination Risk, Standing Crop Loss, Post-harvest Losses), distribution channel (Banks, Insurance Companies, Brokers and Agents, Other Distribution Channels), and type (Multiple Peril Crop Insurance, Actual Production History, Crop Revenue Coverage). The market size is presented in million units.
Crop Insurance Market Market Dynamics & Structure
The global crop insurance market exhibits a moderately concentrated landscape, dominated by key players such as Sompo International Holdings Ltd, PICC, Fairfax Financial Holdings Limited, American Financial Group Inc, QBE Insurance Group Limited, ICICI Lombard General Insurance Company Limited, Zurich, Chubb, Tokio Marine HCC, and Agriculture Insurance Company of India Limited (AIC). These companies hold a substantial market share; however, a considerable number of smaller, regional, and niche players also contribute to the market's dynamism.
Market concentration is a dynamic interplay of mergers and acquisitions (M&A), regulatory frameworks, and technological advancements. Recent years have seen a moderate but significant level of M&A activity, with strategic deals focused on expanding geographical reach and diversifying product portfolios. The July 2023 acquisition of Crop Risk Services by American Financial Group serves as a prime example of this trend. Our analysis estimates approximately [Insert Precise Number] M&A deals between 2019 and 2024, leading to an estimated [Insert Precise Percentage]% increase in market concentration. This consolidation trend is expected to continue, driven by the pursuit of economies of scale and enhanced product offerings.
- Technological Innovation: Precision agriculture technologies, including remote sensing, IoT devices, and AI-driven analytics, are revolutionizing crop insurance. These technologies are improving risk assessment, claims processing, and product design. While offering significant potential, high initial investment costs and data security concerns remain barriers to broader adoption.
- Regulatory Frameworks: Government policies, including subsidies and mandates, exert considerable influence on market growth, particularly in developing economies. The diverse regulatory landscapes across different regions present challenges to seamless market expansion and require tailored strategies for insurers.
- Competitive Product Substitutes: Alternative risk management tools, such as futures contracts, options trading, and hedging strategies, compete with traditional crop insurance. Farmers may opt for these alternatives depending on their risk tolerance, market conditions, and the specific risks involved.
- End-User Demographics: The market is profoundly impacted by the size and characteristics of farming communities. Larger, commercially oriented farms generally exhibit higher adoption rates compared to smaller, subsistence-based farms. This creates opportunities for specialized product offerings tailored to different farm sizes and operations.
Crop Insurance Market Growth Trends & Insights
The global crop insurance market is poised for robust growth throughout the forecast period (2025-2033). Several key factors fuel this expansion: the increasing frequency and severity of extreme weather events, a rising awareness of risk mitigation strategies among farmers, and supportive government policies in many regions. We project a CAGR of [Insert Precise Percentage]% from 2025 to 2033, resulting in a market size of [Insert Precise Value] million by 2033. Current market penetration stands at [Insert Precise Percentage]%, with considerable untapped potential, particularly in underdeveloped regions.
Technological advancements, such as AI-powered risk assessment and remote sensing, are streamlining claims processing and enhancing underwriting accuracy. This leads to increased efficiency, reduced operational costs for insurers, and improved service for farmers. The growing adoption of digital platforms enhances accessibility and convenience. The market is also witnessing a shift towards tailored crop insurance products that address specific regional and crop-specific risks. Index-based insurance, which offers coverage based on broader weather indices rather than individual farm yields, is gaining significant traction due to its cost-effectiveness and ease of implementation.
Dominant Regions, Countries, or Segments in Crop Insurance Market
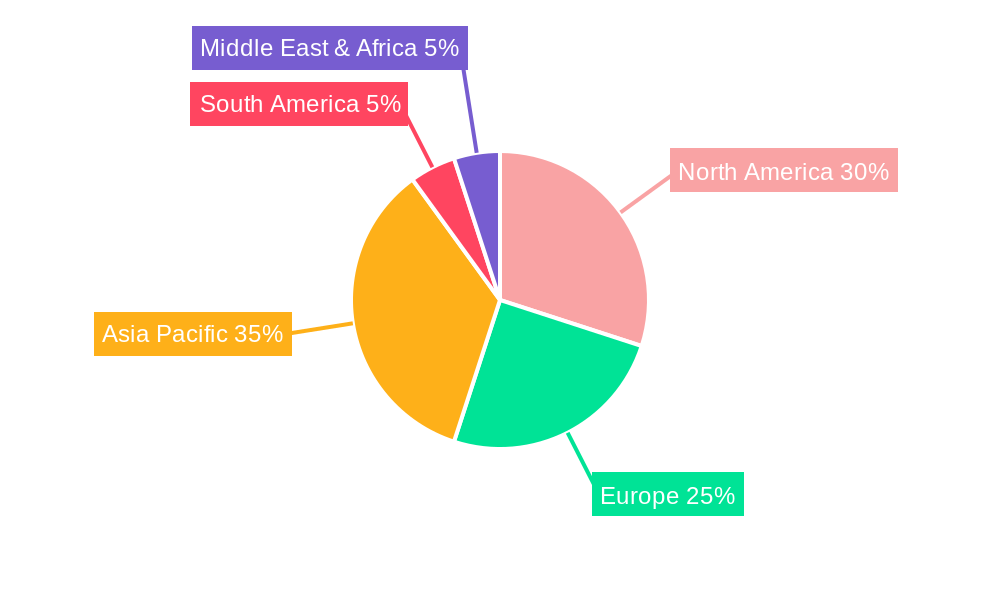
North America currently commands the largest market share, driven by its established insurance infrastructure, high agricultural output, and supportive government policies. However, the Asia-Pacific region is projected to exhibit the fastest growth rate, propelled by its vast agricultural sector and escalating government initiatives promoting crop insurance adoption. This rapid growth is fueled by increasing awareness of climate-related risks and the need for financial protection among farmers.
- By Coverage: Standing crop loss insurance remains the dominant segment, accounting for [Insert Precise Percentage]% of the total market share. However, post-harvest loss insurance is experiencing rapid growth due to heightened awareness of post-harvest losses and technological improvements in storage and transportation.
- By Distribution Channel: Insurance companies constitute the primary distribution channel. Banks are emerging as increasingly important players, especially in developing economies, leveraging their existing relationships with farmers and their role in agricultural finance.
- By Type: Multiple peril crop insurance remains the most prevalent type, offering comprehensive coverage that caters to the diverse risk profiles faced by farmers.
Regional variations in growth drivers are notable. Developed regions are primarily driven by technological advancements and sophisticated risk management tools. Developing economies, conversely, see growth propelled by government subsidies, increasing awareness of risk mitigation, and supportive economic policies aimed at agricultural development and infrastructure improvement.
Crop Insurance Market Product Landscape
The crop insurance market is witnessing the introduction of innovative products and services tailored to specific crop types, regions, and risk profiles. These include parametric insurance products utilizing weather data and index-based insurance schemes offering cost-effective coverage for larger geographic areas. Technological advancements like remote sensing, drones, and AI are improving accuracy in risk assessment and claims processing. Unique selling propositions are increasingly centered on personalized risk mitigation plans, faster claims processing, and the use of advanced data analytics to provide accurate and timely coverage.
Key Drivers, Barriers & Challenges in Crop Insurance Market
Key Drivers:
- Escalating frequency and severity of extreme weather events, driven by climate change.
- Growing recognition of the importance of risk mitigation strategies amongst farmers.
- Government support and subsidies, particularly in developing economies, incentivize adoption.
- Technological advancements enhancing risk assessment, claims processing, and product design.
- Increased awareness of the financial risks associated with crop production.
Challenges:
- Data scarcity in developing regions hampers accurate risk assessment and product development.
- Regulatory complexities and inconsistencies across jurisdictions create barriers to market entry and expansion.
- High administrative and operational costs limit accessibility for smallholder farmers.
- Competition from alternative risk management tools, which we estimate reduces annual market growth by approximately [Insert Precise Percentage]%.
- Lack of awareness and understanding of crop insurance products among farmers in some regions.
Emerging Opportunities in Crop Insurance Market
- Untapped markets: Significant growth potential exists in developing economies with large agricultural sectors but limited insurance penetration.
- Innovative applications: Integration of IoT, AI, and blockchain technologies offer opportunities for improved risk management, fraud prevention, and streamlined claims processing.
- Evolving consumer preferences: A growing demand for personalized and customized insurance solutions catered to specific farm types and risk profiles presents a significant market opportunity.
Growth Accelerators in the Crop Insurance Market Industry
The long-term growth of the crop insurance market will be driven by several factors, including continuous technological innovation in risk assessment and claims processing, strategic partnerships between insurers and agricultural technology companies, and expansion into underserved markets. Government initiatives promoting financial inclusion in agriculture will play a vital role in increasing market penetration.
Key Players Shaping the Crop Insurance Market Market
- Sompo International Holdings Ltd
- PICC
- Fairfax Financial Holdings Limited
- American Financial Group Inc
- QBE Insurance Group Limited
- ICICI Lombard General Insurance Company Limited
- Zurich
- Chubb
- Tokio Marine HCC
- Agriculture Insurance Company of India Limited (AIC)
Notable Milestones in Crop Insurance Market Sector
- September 2023: Launch of the Shrimp Crop Insurance scheme by the Agricultural Insurance Company of India. This expands coverage to a new agricultural segment.
- July 2023: American Financial Group's acquisition of Crop Risk Services, strengthening its position in the US multi-peril crop insurance market.
In-Depth Crop Insurance Market Market Outlook
The crop insurance market is poised for sustained and substantial growth, driven by technological innovation, expanding coverage into new segments (e.g., livestock, aquaculture), and increased government support globally. Strategic partnerships between insurers, technology providers, and agricultural stakeholders will play a crucial role in shaping the future market landscape. We anticipate increased sophistication in product offerings, with greater emphasis on data-driven insights, personalized risk mitigation strategies, and parametric insurance solutions. The continued integration of technology and innovative financial solutions promises to unlock significant opportunities for growth and expansion within the crop insurance market, contributing to enhanced food security and resilience in the agricultural sector.
Crop Insurance Market Segmentation
-
1. Type
- 1.1. Multiple Peril Crop Insurance
- 1.2. Actual Production History
- 1.3. Crop Revenue Coverage
-
2. Coverage
- 2.1. Localized Calamities
- 2.2. Sowing/Planting/Germination Risk
- 2.3. Standing Crop Loss
- 2.4. Post-harvest Losses
-
3. Distribution Channel
- 3.1. Banks
- 3.2. Insurance Companies
- 3.3. Brokers and Agents
- 3.4. Other Distribution Channels
Crop Insurance Market Segmentation By Geography
-
1. North America
- 1.1. United States
- 1.2. Canada
- 1.3. Mexico
-
2. South America
- 2.1. Brazil
- 2.2. Argentina
- 2.3. Rest of South America
-
3. Europe
- 3.1. United Kingdom
- 3.2. Germany
- 3.3. France
- 3.4. Italy
- 3.5. Spain
- 3.6. Russia
- 3.7. Benelux
- 3.8. Nordics
- 3.9. Rest of Europe
-
4. Middle East & Africa
- 4.1. Turkey
- 4.2. Israel
- 4.3. GCC
- 4.4. North Africa
- 4.5. South Africa
- 4.6. Rest of Middle East & Africa
-
5. Asia Pacific
- 5.1. China
- 5.2. India
- 5.3. Japan
- 5.4. South Korea
- 5.5. ASEAN
- 5.6. Oceania
- 5.7. Rest of Asia Pacific
Crop Insurance Market Regional Market Share
Geographic Coverage of Crop Insurance Market
Crop Insurance Market REPORT HIGHLIGHTS
| Aspects | Details |
|---|---|
| Study Period | 2020-2034 |
| Base Year | 2025 |
| Estimated Year | 2026 |
| Forecast Period | 2026-2034 |
| Historical Period | 2020-2025 |
| Growth Rate | CAGR of 5.77% from 2020-2034 |
| Segmentation |
|
Table of Contents
- 1. Introduction
- 1.1. Research Scope
- 1.2. Market Segmentation
- 1.3. Research Methodology
- 1.4. Definitions and Assumptions
- 2. Executive Summary
- 2.1. Introduction
- 3. Market Dynamics
- 3.1. Introduction
- 3.2. Market Drivers
- 3.2.1 Government Support
- 3.2.2 Including Subsidies and Initiatives
- 3.2.3 is a Significant Driver
- 3.3. Market Restrains
- 3.3.1. Instances of Fraud or Misreporting can Impact the Integrity of the Crop Insurance System
- 3.4. Market Trends
- 3.4.1. Increasing Value Crop Protection Globally
- 4. Market Factor Analysis
- 4.1. Porters Five Forces
- 4.2. Supply/Value Chain
- 4.3. PESTEL analysis
- 4.4. Market Entropy
- 4.5. Patent/Trademark Analysis
- 5. Global Crop Insurance Market Analysis, Insights and Forecast, 2020-2032
- 5.1. Market Analysis, Insights and Forecast - by Type
- 5.1.1. Multiple Peril Crop Insurance
- 5.1.2. Actual Production History
- 5.1.3. Crop Revenue Coverage
- 5.2. Market Analysis, Insights and Forecast - by Coverage
- 5.2.1. Localized Calamities
- 5.2.2. Sowing/Planting/Germination Risk
- 5.2.3. Standing Crop Loss
- 5.2.4. Post-harvest Losses
- 5.3. Market Analysis, Insights and Forecast - by Distribution Channel
- 5.3.1. Banks
- 5.3.2. Insurance Companies
- 5.3.3. Brokers and Agents
- 5.3.4. Other Distribution Channels
- 5.4. Market Analysis, Insights and Forecast - by Region
- 5.4.1. North America
- 5.4.2. South America
- 5.4.3. Europe
- 5.4.4. Middle East & Africa
- 5.4.5. Asia Pacific
- 5.1. Market Analysis, Insights and Forecast - by Type
- 6. North America Crop Insurance Market Analysis, Insights and Forecast, 2020-2032
- 6.1. Market Analysis, Insights and Forecast - by Type
- 6.1.1. Multiple Peril Crop Insurance
- 6.1.2. Actual Production History
- 6.1.3. Crop Revenue Coverage
- 6.2. Market Analysis, Insights and Forecast - by Coverage
- 6.2.1. Localized Calamities
- 6.2.2. Sowing/Planting/Germination Risk
- 6.2.3. Standing Crop Loss
- 6.2.4. Post-harvest Losses
- 6.3. Market Analysis, Insights and Forecast - by Distribution Channel
- 6.3.1. Banks
- 6.3.2. Insurance Companies
- 6.3.3. Brokers and Agents
- 6.3.4. Other Distribution Channels
- 6.1. Market Analysis, Insights and Forecast - by Type
- 7. South America Crop Insurance Market Analysis, Insights and Forecast, 2020-2032
- 7.1. Market Analysis, Insights and Forecast - by Type
- 7.1.1. Multiple Peril Crop Insurance
- 7.1.2. Actual Production History
- 7.1.3. Crop Revenue Coverage
- 7.2. Market Analysis, Insights and Forecast - by Coverage
- 7.2.1. Localized Calamities
- 7.2.2. Sowing/Planting/Germination Risk
- 7.2.3. Standing Crop Loss
- 7.2.4. Post-harvest Losses
- 7.3. Market Analysis, Insights and Forecast - by Distribution Channel
- 7.3.1. Banks
- 7.3.2. Insurance Companies
- 7.3.3. Brokers and Agents
- 7.3.4. Other Distribution Channels
- 7.1. Market Analysis, Insights and Forecast - by Type
- 8. Europe Crop Insurance Market Analysis, Insights and Forecast, 2020-2032
- 8.1. Market Analysis, Insights and Forecast - by Type
- 8.1.1. Multiple Peril Crop Insurance
- 8.1.2. Actual Production History
- 8.1.3. Crop Revenue Coverage
- 8.2. Market Analysis, Insights and Forecast - by Coverage
- 8.2.1. Localized Calamities
- 8.2.2. Sowing/Planting/Germination Risk
- 8.2.3. Standing Crop Loss
- 8.2.4. Post-harvest Losses
- 8.3. Market Analysis, Insights and Forecast - by Distribution Channel
- 8.3.1. Banks
- 8.3.2. Insurance Companies
- 8.3.3. Brokers and Agents
- 8.3.4. Other Distribution Channels
- 8.1. Market Analysis, Insights and Forecast - by Type
- 9. Middle East & Africa Crop Insurance Market Analysis, Insights and Forecast, 2020-2032
- 9.1. Market Analysis, Insights and Forecast - by Type
- 9.1.1. Multiple Peril Crop Insurance
- 9.1.2. Actual Production History
- 9.1.3. Crop Revenue Coverage
- 9.2. Market Analysis, Insights and Forecast - by Coverage
- 9.2.1. Localized Calamities
- 9.2.2. Sowing/Planting/Germination Risk
- 9.2.3. Standing Crop Loss
- 9.2.4. Post-harvest Losses
- 9.3. Market Analysis, Insights and Forecast - by Distribution Channel
- 9.3.1. Banks
- 9.3.2. Insurance Companies
- 9.3.3. Brokers and Agents
- 9.3.4. Other Distribution Channels
- 9.1. Market Analysis, Insights and Forecast - by Type
- 10. Asia Pacific Crop Insurance Market Analysis, Insights and Forecast, 2020-2032
- 10.1. Market Analysis, Insights and Forecast - by Type
- 10.1.1. Multiple Peril Crop Insurance
- 10.1.2. Actual Production History
- 10.1.3. Crop Revenue Coverage
- 10.2. Market Analysis, Insights and Forecast - by Coverage
- 10.2.1. Localized Calamities
- 10.2.2. Sowing/Planting/Germination Risk
- 10.2.3. Standing Crop Loss
- 10.2.4. Post-harvest Losses
- 10.3. Market Analysis, Insights and Forecast - by Distribution Channel
- 10.3.1. Banks
- 10.3.2. Insurance Companies
- 10.3.3. Brokers and Agents
- 10.3.4. Other Distribution Channels
- 10.1. Market Analysis, Insights and Forecast - by Type
- 11. Competitive Analysis
- 11.1. Global Market Share Analysis 2025
- 11.2. Company Profiles
- 11.2.1 Sompo International Holdings Ltd
- 11.2.1.1. Overview
- 11.2.1.2. Products
- 11.2.1.3. SWOT Analysis
- 11.2.1.4. Recent Developments
- 11.2.1.5. Financials (Based on Availability)
- 11.2.2 PICC
- 11.2.2.1. Overview
- 11.2.2.2. Products
- 11.2.2.3. SWOT Analysis
- 11.2.2.4. Recent Developments
- 11.2.2.5. Financials (Based on Availability)
- 11.2.3 Fairfax Financial Holdings Limited
- 11.2.3.1. Overview
- 11.2.3.2. Products
- 11.2.3.3. SWOT Analysis
- 11.2.3.4. Recent Developments
- 11.2.3.5. Financials (Based on Availability)
- 11.2.4 American Financial Group Inc
- 11.2.4.1. Overview
- 11.2.4.2. Products
- 11.2.4.3. SWOT Analysis
- 11.2.4.4. Recent Developments
- 11.2.4.5. Financials (Based on Availability)
- 11.2.5 QBE Insurance Group Limited
- 11.2.5.1. Overview
- 11.2.5.2. Products
- 11.2.5.3. SWOT Analysis
- 11.2.5.4. Recent Developments
- 11.2.5.5. Financials (Based on Availability)
- 11.2.6 ICICI Lombard General Insurance Company Limited
- 11.2.6.1. Overview
- 11.2.6.2. Products
- 11.2.6.3. SWOT Analysis
- 11.2.6.4. Recent Developments
- 11.2.6.5. Financials (Based on Availability)
- 11.2.7 Zurich**List Not Exhaustive
- 11.2.7.1. Overview
- 11.2.7.2. Products
- 11.2.7.3. SWOT Analysis
- 11.2.7.4. Recent Developments
- 11.2.7.5. Financials (Based on Availability)
- 11.2.8 Chubb
- 11.2.8.1. Overview
- 11.2.8.2. Products
- 11.2.8.3. SWOT Analysis
- 11.2.8.4. Recent Developments
- 11.2.8.5. Financials (Based on Availability)
- 11.2.9 Tokio Marine HCC
- 11.2.9.1. Overview
- 11.2.9.2. Products
- 11.2.9.3. SWOT Analysis
- 11.2.9.4. Recent Developments
- 11.2.9.5. Financials (Based on Availability)
- 11.2.10 Agriculture Insurance Company of India Limited (AIC)
- 11.2.10.1. Overview
- 11.2.10.2. Products
- 11.2.10.3. SWOT Analysis
- 11.2.10.4. Recent Developments
- 11.2.10.5. Financials (Based on Availability)
- 11.2.1 Sompo International Holdings Ltd
List of Figures
- Figure 1: Global Crop Insurance Market Revenue Breakdown (Million, %) by Region 2025 & 2033
- Figure 2: North America Crop Insurance Market Revenue (Million), by Type 2025 & 2033
- Figure 3: North America Crop Insurance Market Revenue Share (%), by Type 2025 & 2033
- Figure 4: North America Crop Insurance Market Revenue (Million), by Coverage 2025 & 2033
- Figure 5: North America Crop Insurance Market Revenue Share (%), by Coverage 2025 & 2033
- Figure 6: North America Crop Insurance Market Revenue (Million), by Distribution Channel 2025 & 2033
- Figure 7: North America Crop Insurance Market Revenue Share (%), by Distribution Channel 2025 & 2033
- Figure 8: North America Crop Insurance Market Revenue (Million), by Country 2025 & 2033
- Figure 9: North America Crop Insurance Market Revenue Share (%), by Country 2025 & 2033
- Figure 10: South America Crop Insurance Market Revenue (Million), by Type 2025 & 2033
- Figure 11: South America Crop Insurance Market Revenue Share (%), by Type 2025 & 2033
- Figure 12: South America Crop Insurance Market Revenue (Million), by Coverage 2025 & 2033
- Figure 13: South America Crop Insurance Market Revenue Share (%), by Coverage 2025 & 2033
- Figure 14: South America Crop Insurance Market Revenue (Million), by Distribution Channel 2025 & 2033
- Figure 15: South America Crop Insurance Market Revenue Share (%), by Distribution Channel 2025 & 2033
- Figure 16: South America Crop Insurance Market Revenue (Million), by Country 2025 & 2033
- Figure 17: South America Crop Insurance Market Revenue Share (%), by Country 2025 & 2033
- Figure 18: Europe Crop Insurance Market Revenue (Million), by Type 2025 & 2033
- Figure 19: Europe Crop Insurance Market Revenue Share (%), by Type 2025 & 2033
- Figure 20: Europe Crop Insurance Market Revenue (Million), by Coverage 2025 & 2033
- Figure 21: Europe Crop Insurance Market Revenue Share (%), by Coverage 2025 & 2033
- Figure 22: Europe Crop Insurance Market Revenue (Million), by Distribution Channel 2025 & 2033
- Figure 23: Europe Crop Insurance Market Revenue Share (%), by Distribution Channel 2025 & 2033
- Figure 24: Europe Crop Insurance Market Revenue (Million), by Country 2025 & 2033
- Figure 25: Europe Crop Insurance Market Revenue Share (%), by Country 2025 & 2033
- Figure 26: Middle East & Africa Crop Insurance Market Revenue (Million), by Type 2025 & 2033
- Figure 27: Middle East & Africa Crop Insurance Market Revenue Share (%), by Type 2025 & 2033
- Figure 28: Middle East & Africa Crop Insurance Market Revenue (Million), by Coverage 2025 & 2033
- Figure 29: Middle East & Africa Crop Insurance Market Revenue Share (%), by Coverage 2025 & 2033
- Figure 30: Middle East & Africa Crop Insurance Market Revenue (Million), by Distribution Channel 2025 & 2033
- Figure 31: Middle East & Africa Crop Insurance Market Revenue Share (%), by Distribution Channel 2025 & 2033
- Figure 32: Middle East & Africa Crop Insurance Market Revenue (Million), by Country 2025 & 2033
- Figure 33: Middle East & Africa Crop Insurance Market Revenue Share (%), by Country 2025 & 2033
- Figure 34: Asia Pacific Crop Insurance Market Revenue (Million), by Type 2025 & 2033
- Figure 35: Asia Pacific Crop Insurance Market Revenue Share (%), by Type 2025 & 2033
- Figure 36: Asia Pacific Crop Insurance Market Revenue (Million), by Coverage 2025 & 2033
- Figure 37: Asia Pacific Crop Insurance Market Revenue Share (%), by Coverage 2025 & 2033
- Figure 38: Asia Pacific Crop Insurance Market Revenue (Million), by Distribution Channel 2025 & 2033
- Figure 39: Asia Pacific Crop Insurance Market Revenue Share (%), by Distribution Channel 2025 & 2033
- Figure 40: Asia Pacific Crop Insurance Market Revenue (Million), by Country 2025 & 2033
- Figure 41: Asia Pacific Crop Insurance Market Revenue Share (%), by Country 2025 & 2033
List of Tables
- Table 1: Global Crop Insurance Market Revenue Million Forecast, by Type 2020 & 2033
- Table 2: Global Crop Insurance Market Revenue Million Forecast, by Coverage 2020 & 2033
- Table 3: Global Crop Insurance Market Revenue Million Forecast, by Distribution Channel 2020 & 2033
- Table 4: Global Crop Insurance Market Revenue Million Forecast, by Region 2020 & 2033
- Table 5: Global Crop Insurance Market Revenue Million Forecast, by Type 2020 & 2033
- Table 6: Global Crop Insurance Market Revenue Million Forecast, by Coverage 2020 & 2033
- Table 7: Global Crop Insurance Market Revenue Million Forecast, by Distribution Channel 2020 & 2033
- Table 8: Global Crop Insurance Market Revenue Million Forecast, by Country 2020 & 2033
- Table 9: United States Crop Insurance Market Revenue (Million) Forecast, by Application 2020 & 2033
- Table 10: Canada Crop Insurance Market Revenue (Million) Forecast, by Application 2020 & 2033
- Table 11: Mexico Crop Insurance Market Revenue (Million) Forecast, by Application 2020 & 2033
- Table 12: Global Crop Insurance Market Revenue Million Forecast, by Type 2020 & 2033
- Table 13: Global Crop Insurance Market Revenue Million Forecast, by Coverage 2020 & 2033
- Table 14: Global Crop Insurance Market Revenue Million Forecast, by Distribution Channel 2020 & 2033
- Table 15: Global Crop Insurance Market Revenue Million Forecast, by Country 2020 & 2033
- Table 16: Brazil Crop Insurance Market Revenue (Million) Forecast, by Application 2020 & 2033
- Table 17: Argentina Crop Insurance Market Revenue (Million) Forecast, by Application 2020 & 2033
- Table 18: Rest of South America Crop Insurance Market Revenue (Million) Forecast, by Application 2020 & 2033
- Table 19: Global Crop Insurance Market Revenue Million Forecast, by Type 2020 & 2033
- Table 20: Global Crop Insurance Market Revenue Million Forecast, by Coverage 2020 & 2033
- Table 21: Global Crop Insurance Market Revenue Million Forecast, by Distribution Channel 2020 & 2033
- Table 22: Global Crop Insurance Market Revenue Million Forecast, by Country 2020 & 2033
- Table 23: United Kingdom Crop Insurance Market Revenue (Million) Forecast, by Application 2020 & 2033
- Table 24: Germany Crop Insurance Market Revenue (Million) Forecast, by Application 2020 & 2033
- Table 25: France Crop Insurance Market Revenue (Million) Forecast, by Application 2020 & 2033
- Table 26: Italy Crop Insurance Market Revenue (Million) Forecast, by Application 2020 & 2033
- Table 27: Spain Crop Insurance Market Revenue (Million) Forecast, by Application 2020 & 2033
- Table 28: Russia Crop Insurance Market Revenue (Million) Forecast, by Application 2020 & 2033
- Table 29: Benelux Crop Insurance Market Revenue (Million) Forecast, by Application 2020 & 2033
- Table 30: Nordics Crop Insurance Market Revenue (Million) Forecast, by Application 2020 & 2033
- Table 31: Rest of Europe Crop Insurance Market Revenue (Million) Forecast, by Application 2020 & 2033
- Table 32: Global Crop Insurance Market Revenue Million Forecast, by Type 2020 & 2033
- Table 33: Global Crop Insurance Market Revenue Million Forecast, by Coverage 2020 & 2033
- Table 34: Global Crop Insurance Market Revenue Million Forecast, by Distribution Channel 2020 & 2033
- Table 35: Global Crop Insurance Market Revenue Million Forecast, by Country 2020 & 2033
- Table 36: Turkey Crop Insurance Market Revenue (Million) Forecast, by Application 2020 & 2033
- Table 37: Israel Crop Insurance Market Revenue (Million) Forecast, by Application 2020 & 2033
- Table 38: GCC Crop Insurance Market Revenue (Million) Forecast, by Application 2020 & 2033
- Table 39: North Africa Crop Insurance Market Revenue (Million) Forecast, by Application 2020 & 2033
- Table 40: South Africa Crop Insurance Market Revenue (Million) Forecast, by Application 2020 & 2033
- Table 41: Rest of Middle East & Africa Crop Insurance Market Revenue (Million) Forecast, by Application 2020 & 2033
- Table 42: Global Crop Insurance Market Revenue Million Forecast, by Type 2020 & 2033
- Table 43: Global Crop Insurance Market Revenue Million Forecast, by Coverage 2020 & 2033
- Table 44: Global Crop Insurance Market Revenue Million Forecast, by Distribution Channel 2020 & 2033
- Table 45: Global Crop Insurance Market Revenue Million Forecast, by Country 2020 & 2033
- Table 46: China Crop Insurance Market Revenue (Million) Forecast, by Application 2020 & 2033
- Table 47: India Crop Insurance Market Revenue (Million) Forecast, by Application 2020 & 2033
- Table 48: Japan Crop Insurance Market Revenue (Million) Forecast, by Application 2020 & 2033
- Table 49: South Korea Crop Insurance Market Revenue (Million) Forecast, by Application 2020 & 2033
- Table 50: ASEAN Crop Insurance Market Revenue (Million) Forecast, by Application 2020 & 2033
- Table 51: Oceania Crop Insurance Market Revenue (Million) Forecast, by Application 2020 & 2033
- Table 52: Rest of Asia Pacific Crop Insurance Market Revenue (Million) Forecast, by Application 2020 & 2033
Frequently Asked Questions
1. What is the projected Compound Annual Growth Rate (CAGR) of the Crop Insurance Market ?
The projected CAGR is approximately 5.77%.
2. Which companies are prominent players in the Crop Insurance Market ?
Key companies in the market include Sompo International Holdings Ltd, PICC, Fairfax Financial Holdings Limited, American Financial Group Inc, QBE Insurance Group Limited, ICICI Lombard General Insurance Company Limited, Zurich**List Not Exhaustive, Chubb, Tokio Marine HCC, Agriculture Insurance Company of India Limited (AIC).
3. What are the main segments of the Crop Insurance Market ?
The market segments include Type, Coverage, Distribution Channel.
4. Can you provide details about the market size?
The market size is estimated to be USD 38.10 Million as of 2022.
5. What are some drivers contributing to market growth?
Government Support. Including Subsidies and Initiatives. is a Significant Driver.
6. What are the notable trends driving market growth?
Increasing Value Crop Protection Globally.
7. Are there any restraints impacting market growth?
Instances of Fraud or Misreporting can Impact the Integrity of the Crop Insurance System.
8. Can you provide examples of recent developments in the market?
September 2023: The Shrimp Crop Insurance scheme developed by the Agricultural Insurance Company was launched in India. The insurance cover starts from the initial stage to 130 days till the shrimps are ready.
9. What pricing options are available for accessing the report?
Pricing options include single-user, multi-user, and enterprise licenses priced at USD 3800, USD 4500, and USD 5800 respectively.
10. Is the market size provided in terms of value or volume?
The market size is provided in terms of value, measured in Million.
11. Are there any specific market keywords associated with the report?
Yes, the market keyword associated with the report is "Crop Insurance Market ," which aids in identifying and referencing the specific market segment covered.
12. How do I determine which pricing option suits my needs best?
The pricing options vary based on user requirements and access needs. Individual users may opt for single-user licenses, while businesses requiring broader access may choose multi-user or enterprise licenses for cost-effective access to the report.
13. Are there any additional resources or data provided in the Crop Insurance Market report?
While the report offers comprehensive insights, it's advisable to review the specific contents or supplementary materials provided to ascertain if additional resources or data are available.
14. How can I stay updated on further developments or reports in the Crop Insurance Market ?
To stay informed about further developments, trends, and reports in the Crop Insurance Market , consider subscribing to industry newsletters, following relevant companies and organizations, or regularly checking reputable industry news sources and publications.
Methodology
Step 1 - Identification of Relevant Samples Size from Population Database


Step 2 - Approaches for Defining Global Market Size (Value, Volume* & Price*)

Note*: In applicable scenarios
Step 3 - Data Sources
Primary Research
- Web Analytics
- Survey Reports
- Research Institute
- Latest Research Reports
- Opinion Leaders
Secondary Research
- Annual Reports
- White Paper
- Latest Press Release
- Industry Association
- Paid Database
- Investor Presentations

Step 4 - Data Triangulation
Involves using different sources of information in order to increase the validity of a study
These sources are likely to be stakeholders in a program - participants, other researchers, program staff, other community members, and so on.
Then we put all data in single framework & apply various statistical tools to find out the dynamic on the market.
During the analysis stage, feedback from the stakeholder groups would be compared to determine areas of agreement as well as areas of divergence

