
Key Insights
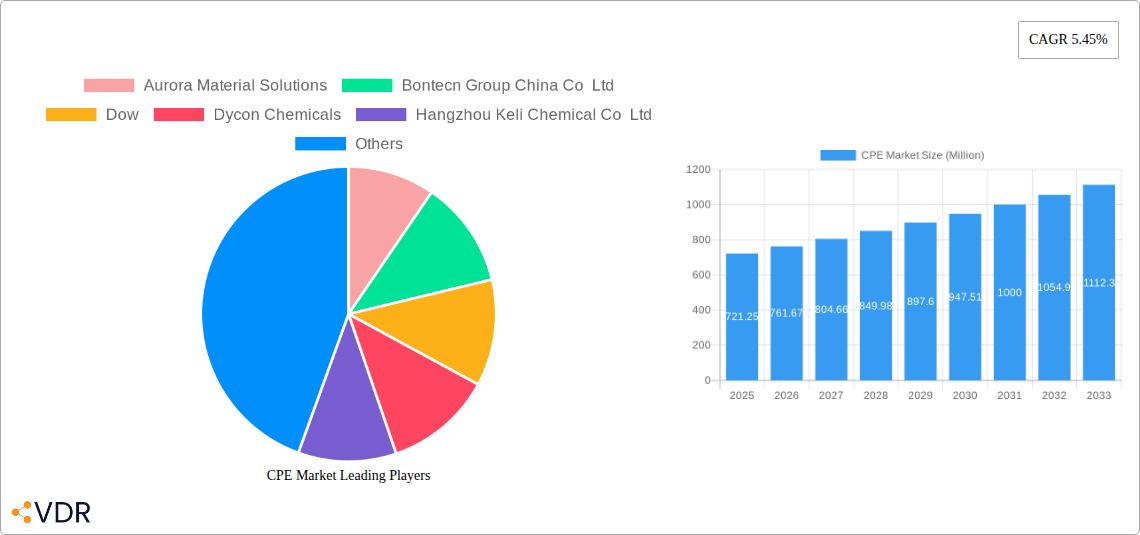
The Chlorinated Polyethylene (CPE) market, valued at $721.25 million in 2025, is projected to experience robust growth, driven by its increasing application in diverse sectors. The 5.45% CAGR from 2019 to 2033 indicates a significant expansion, fueled by rising demand from the automotive, construction, and wire & cable industries. The automotive sector's preference for CPE in applications like sealing components and fuel lines stems from its excellent resistance to chemicals, heat, and aging. Similarly, the construction industry utilizes CPE for its durability and weather resistance in profiles, pipes, and other construction materials. The wire & cable sector leverages CPE's insulation properties, contributing to its substantial market share. Growth is further propelled by ongoing advancements in CPE formulations, leading to improved performance characteristics and broadened applications. However, fluctuations in raw material prices and environmental concerns regarding the use of chlorine-containing polymers present potential restraints. This necessitates the development of more sustainable CPE alternatives and efficient production processes to mitigate these challenges. The market is fairly consolidated with key players like Dow, Resonac Holdings, and several Chinese manufacturers competing for market share, leading to ongoing innovation and price competitiveness. Future market expansion will hinge on technological advancements, regulatory changes related to environmental sustainability, and sustained growth in end-use sectors.
The CPE market's competitive landscape features a mix of global and regional players. Companies like Aurora Material Solutions, Bontecn Group, and Dow contribute significantly to the market’s production capacity and technological advancements. The concentration of several manufacturers in China highlights the region's significant role in global CPE production and supply. Future competition will likely center around innovation in CPE formulations, especially those addressing environmental sustainability concerns, and cost-effective manufacturing processes. Market segmentation by application (automotive, construction, wire & cable, etc.) and region (North America, Europe, Asia-Pacific, etc.) will provide a more detailed picture of market dynamics and growth potential within specific geographic locations and end-use applications. Further research into regional specific regulations and economic conditions is necessary for a more complete market forecast.
CPE Market: A Comprehensive Market Report (2019-2033)
This comprehensive report provides an in-depth analysis of the Chlorinated Polyethylene (CPE) market, encompassing market dynamics, growth trends, regional dominance, product landscape, key players, and future outlook. The study period covers 2019-2033, with 2025 serving as the base and estimated year. The report is crucial for industry professionals, investors, and strategists seeking to understand and capitalize on opportunities within this dynamic market. The total market size is projected to reach xx Million units by 2033.
CPE Market Market Dynamics & Structure
This section delves into the intricate structure of the CPE market, analyzing market concentration, technological advancements, regulatory landscapes, competitive substitutes, end-user demographics, and mergers & acquisitions (M&A) activities. The global CPE market is characterized by a moderately consolidated structure with several major players holding significant market share. However, the presence of numerous smaller players fosters competition and innovation.
- Market Concentration: The top 5 players account for approximately xx% of the global market share in 2025.
- Technological Innovation: Advancements in CPE production technologies, focusing on improved process efficiency and enhanced product properties, are key drivers. Innovation barriers primarily include high R&D costs and stringent regulatory requirements.
- Regulatory Frameworks: Stringent environmental regulations regarding volatile organic compound (VOC) emissions influence CPE production processes and influence market dynamics.
- Competitive Product Substitutes: The market faces competition from other polymers like ethylene propylene rubber (EPR) and thermoplastic polyolefins (TPOs) especially in specific applications.
- End-User Demographics: The major end-use sectors include automotive, building & construction, wire & cable, and packaging, with automotive expected to maintain a significant portion of market share, currently estimated at xx%.
- M&A Trends: The CPE market has witnessed a moderate level of M&A activity in recent years, with xx deals recorded between 2019 and 2024, primarily driven by the need for expansion and diversification of product portfolios. For instance, Aurora Plastics LLC's acquisition of EnCom Polymers Inc. in May 2024 significantly strengthened its position in the chlorinated polyethylene alloys segment.
CPE Market Growth Trends & Insights
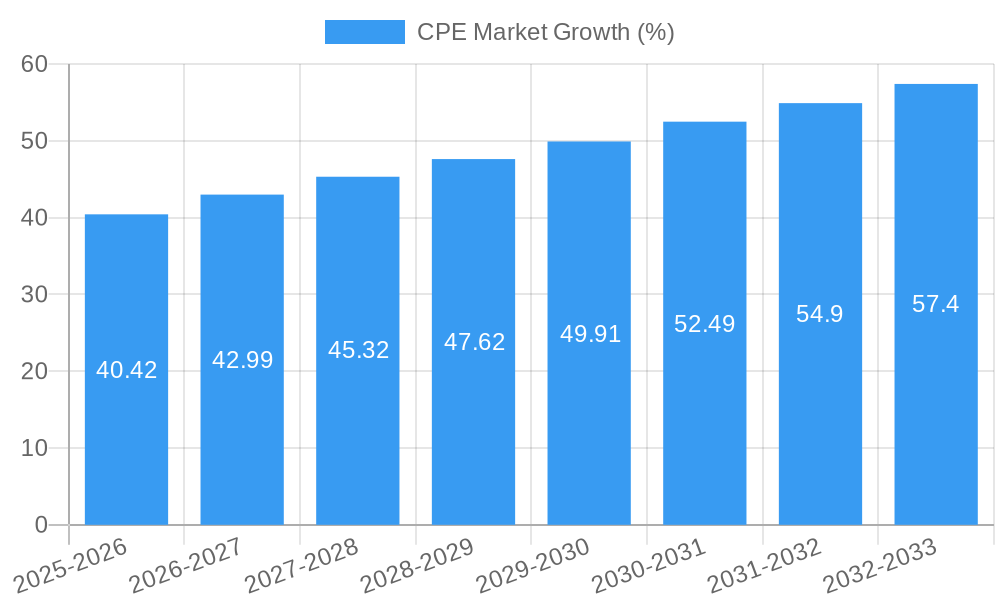
This section utilizes a robust analytical framework (XXX) to comprehensively analyze the CPE market's growth trajectory. The market size has witnessed substantial growth during the historical period (2019-2024), exhibiting a CAGR of xx%. This growth is attributed to several factors, including rising demand from key end-use industries, technological advancements in CPE production, and increasing adoption rates in emerging economies. Market penetration rates are currently estimated at xx% in mature markets and are poised for significant growth in developing regions, which are projected to drive substantial growth throughout the forecast period (2025-2033). Technological disruptions, like the development of more sustainable CPE production methods, will further fuel market expansion. Shifting consumer preferences towards environmentally friendly materials also present opportunities for market growth. The projected CAGR for the forecast period (2025-2033) is xx%.
Dominant Regions, Countries, or Segments in CPE Market
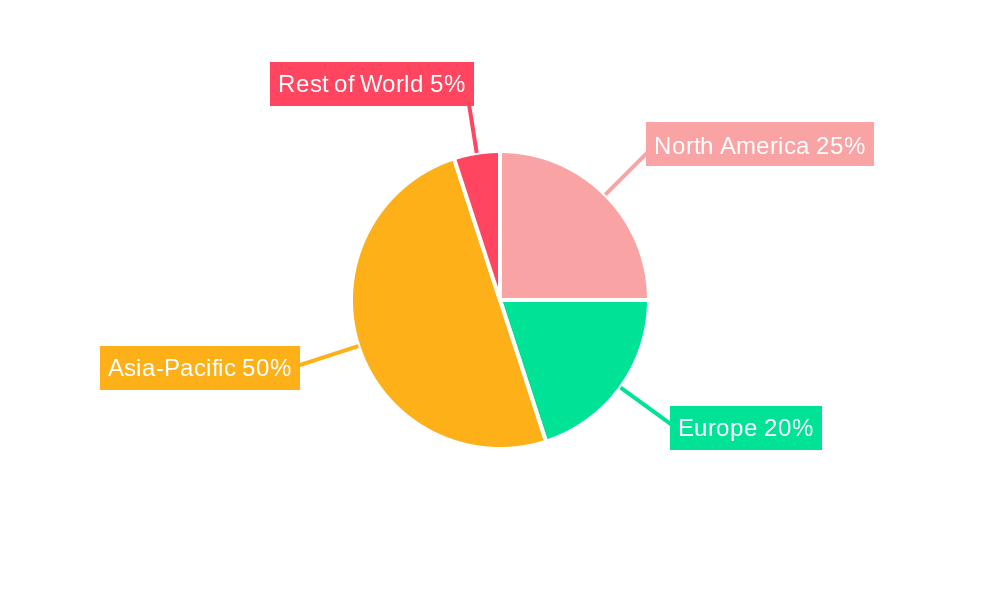
This analysis pinpoints the leading geographical regions and market segments driving CPE market expansion. Asia Pacific currently holds the largest market share, driven by robust industrial growth and rising construction activities, particularly in China and India. North America and Europe also contribute significantly, driven by established automotive and other end-use industries.
- Asia Pacific: Strong industrial growth, favorable government policies, and increasing infrastructure development are key growth drivers. China and India represent the largest individual markets within this region.
- North America: This region benefits from robust automotive and construction sectors, along with a developed infrastructure that facilitates CPE utilization.
- Europe: Established automotive and wire & cable industries support strong CPE demand, while stringent environmental regulations drive innovation in sustainable production.
Market share percentages: Asia Pacific (xx%), North America (xx%), Europe (xx%), Rest of World (xx%). Growth potential is especially high in developing economies within Asia Pacific and Latin America, driven by rising disposable incomes and urbanization.
CPE Market Product Landscape
The CPE market offers a diverse range of products tailored to specific application needs. Innovations focus on enhancing CPE's performance characteristics, such as improved flexibility, durability, and resistance to chemicals and UV radiation. Technological advancements are enabling the development of high-performance CPE grades with superior processing properties, thus catering to a wider range of applications across various industries. These advancements contribute to the unique selling propositions of CPE products, including cost-effectiveness, versatility, and enhanced material properties.
Key Drivers, Barriers & Challenges in CPE Market
Key Drivers: The CPE market is driven primarily by growing demand from the automotive industry (particularly in lightweighting initiatives), the robust building and construction sector, and the expanding wire and cable industries. Favorable government policies promoting sustainable materials also contribute significantly.
Key Challenges & Restraints: Fluctuations in raw material prices, particularly chlorine and ethylene, pose a significant challenge. Stringent environmental regulations regarding VOC emissions necessitate investments in cleaner production technologies. Intense competition from substitute materials and potential supply chain disruptions also present hurdles to market growth. These factors can impact profitability and production capabilities.
Emerging Opportunities in CPE Market
Emerging opportunities lie in expanding into untapped markets, particularly in developing economies, and in the development of specialized CPE grades for niche applications. For example, the increasing demand for sustainable materials presents a major opportunity to develop and commercialize biodegradable or recyclable CPE. Furthermore, exploring new applications in areas like 3D printing and flexible electronics could unlock further growth potential.
Growth Accelerators in the CPE Market Industry
Technological breakthroughs in CPE production processes, focusing on improving efficiency and sustainability, will significantly propel long-term market growth. Strategic partnerships between CPE manufacturers and end-users to develop customized solutions will also be a key accelerator. Expansion into new geographic regions and the exploration of innovative applications will also drive market expansion.
Key Players Shaping the CPE Market Market
- Aurora Material Solutions
- Bontecn Group China Co Ltd
- Dow
- Dycon Chemicals
- Hangzhou Keli Chemical Co Ltd
- Jiangsu Tianteng Chemical Industry Co Ltd
- Resonac Holdings Corporation
- Shandong Gaoxin Chemical Co Ltd
- Shandong Ketian Chemical Co Ltd
- Shandong Novista Chemical Ltd (Novista Group)
- Shandong Xiangsheng New Materials Technology Co Ltd
- Shandong Xuye New Materials Co Ltd
- Sundow Polymers Co Ltd
- Weifang Yaxing Chemical Co Ltd *List Not Exhaustive
Notable Milestones in CPE Market Sector
- May 2024: Aurora Plastics LLC (Aurora) announced the acquisition of EnCom Polymers Inc., expanding its product offering to include chlorinated polyethylene alloys (CPE) and strengthening its market position.
In-Depth CPE Market Market Outlook
The CPE market is poised for continued robust growth, fueled by sustained demand from key end-use industries and technological advancements enhancing product performance and sustainability. Strategic investments in R&D, expansion into new markets, and the adoption of innovative production methods will define the market's future. The potential for specialized CPE applications and the increasing focus on eco-friendly materials present significant opportunities for market players to capitalize on.
CPE Market Segmentation
-
1. Product
- 1.1. CPE 135A
- 1.2. CPA 135B
- 1.3. Other Products
-
2. Application
- 2.1. Impact Modifier
- 2.2. Wire and Cable Jacketing
- 2.3. Hose and Tubing
- 2.4. Adhesives
- 2.5. Other Applications
CPE Market Segmentation By Geography
-
1. Asia Pacific
- 1.1. China
- 1.2. India
- 1.3. Japan
- 1.4. South Korea
- 1.5. Rest of Asia Pacific
-
2. North America
- 2.1. United States
- 2.2. Canada
- 2.3. Mexico
-
3. Europe
- 3.1. Germany
- 3.2. United Kingdom
- 3.3. France
- 3.4. Italy
- 3.5. Rest of Europe
-
4. South America
- 4.1. Brazil
- 4.2. Argentina
- 4.3. Rest of South America
-
5. Middle East and Africa
- 5.1. Saudi Arabia
- 5.2. South Africa
- 5.3. Rest of Middle East and Africa
CPE Market REPORT HIGHLIGHTS
| Aspects | Details |
|---|---|
| Study Period | 2019-2033 |
| Base Year | 2024 |
| Estimated Year | 2025 |
| Forecast Period | 2025-2033 |
| Historical Period | 2019-2024 |
| Growth Rate | CAGR of 5.45% from 2019-2033 |
| Segmentation |
|
Table of Contents
- 1. Introduction
- 1.1. Research Scope
- 1.2. Market Segmentation
- 1.3. Research Methodology
- 1.4. Definitions and Assumptions
- 2. Executive Summary
- 2.1. Introduction
- 3. Market Dynamics
- 3.1. Introduction
- 3.2. Market Drivers
- 3.2.1. Rising Demand for CPE-based Impact Modifiers in PVC Products; Growing Demand for CPE-based Hoses and Tubes in the Automotive Industry
- 3.3. Market Restrains
- 3.3.1. Rising Demand for CPE-based Impact Modifiers in PVC Products; Growing Demand for CPE-based Hoses and Tubes in the Automotive Industry
- 3.4. Market Trends
- 3.4.1. Impact Modifier is Expected to Dominate the Market
- 4. Market Factor Analysis
- 4.1. Porters Five Forces
- 4.2. Supply/Value Chain
- 4.3. PESTEL analysis
- 4.4. Market Entropy
- 4.5. Patent/Trademark Analysis
- 5. Global CPE Market Analysis, Insights and Forecast, 2019-2031
- 5.1. Market Analysis, Insights and Forecast - by Product
- 5.1.1. CPE 135A
- 5.1.2. CPA 135B
- 5.1.3. Other Products
- 5.2. Market Analysis, Insights and Forecast - by Application
- 5.2.1. Impact Modifier
- 5.2.2. Wire and Cable Jacketing
- 5.2.3. Hose and Tubing
- 5.2.4. Adhesives
- 5.2.5. Other Applications
- 5.3. Market Analysis, Insights and Forecast - by Region
- 5.3.1. Asia Pacific
- 5.3.2. North America
- 5.3.3. Europe
- 5.3.4. South America
- 5.3.5. Middle East and Africa
- 5.1. Market Analysis, Insights and Forecast - by Product
- 6. Asia Pacific CPE Market Analysis, Insights and Forecast, 2019-2031
- 6.1. Market Analysis, Insights and Forecast - by Product
- 6.1.1. CPE 135A
- 6.1.2. CPA 135B
- 6.1.3. Other Products
- 6.2. Market Analysis, Insights and Forecast - by Application
- 6.2.1. Impact Modifier
- 6.2.2. Wire and Cable Jacketing
- 6.2.3. Hose and Tubing
- 6.2.4. Adhesives
- 6.2.5. Other Applications
- 6.1. Market Analysis, Insights and Forecast - by Product
- 7. North America CPE Market Analysis, Insights and Forecast, 2019-2031
- 7.1. Market Analysis, Insights and Forecast - by Product
- 7.1.1. CPE 135A
- 7.1.2. CPA 135B
- 7.1.3. Other Products
- 7.2. Market Analysis, Insights and Forecast - by Application
- 7.2.1. Impact Modifier
- 7.2.2. Wire and Cable Jacketing
- 7.2.3. Hose and Tubing
- 7.2.4. Adhesives
- 7.2.5. Other Applications
- 7.1. Market Analysis, Insights and Forecast - by Product
- 8. Europe CPE Market Analysis, Insights and Forecast, 2019-2031
- 8.1. Market Analysis, Insights and Forecast - by Product
- 8.1.1. CPE 135A
- 8.1.2. CPA 135B
- 8.1.3. Other Products
- 8.2. Market Analysis, Insights and Forecast - by Application
- 8.2.1. Impact Modifier
- 8.2.2. Wire and Cable Jacketing
- 8.2.3. Hose and Tubing
- 8.2.4. Adhesives
- 8.2.5. Other Applications
- 8.1. Market Analysis, Insights and Forecast - by Product
- 9. South America CPE Market Analysis, Insights and Forecast, 2019-2031
- 9.1. Market Analysis, Insights and Forecast - by Product
- 9.1.1. CPE 135A
- 9.1.2. CPA 135B
- 9.1.3. Other Products
- 9.2. Market Analysis, Insights and Forecast - by Application
- 9.2.1. Impact Modifier
- 9.2.2. Wire and Cable Jacketing
- 9.2.3. Hose and Tubing
- 9.2.4. Adhesives
- 9.2.5. Other Applications
- 9.1. Market Analysis, Insights and Forecast - by Product
- 10. Middle East and Africa CPE Market Analysis, Insights and Forecast, 2019-2031
- 10.1. Market Analysis, Insights and Forecast - by Product
- 10.1.1. CPE 135A
- 10.1.2. CPA 135B
- 10.1.3. Other Products
- 10.2. Market Analysis, Insights and Forecast - by Application
- 10.2.1. Impact Modifier
- 10.2.2. Wire and Cable Jacketing
- 10.2.3. Hose and Tubing
- 10.2.4. Adhesives
- 10.2.5. Other Applications
- 10.1. Market Analysis, Insights and Forecast - by Product
- 11. Competitive Analysis
- 11.1. Global Market Share Analysis 2024
- 11.2. Company Profiles
- 11.2.1 Aurora Material Solutions
- 11.2.1.1. Overview
- 11.2.1.2. Products
- 11.2.1.3. SWOT Analysis
- 11.2.1.4. Recent Developments
- 11.2.1.5. Financials (Based on Availability)
- 11.2.2 Bontecn Group China Co Ltd
- 11.2.2.1. Overview
- 11.2.2.2. Products
- 11.2.2.3. SWOT Analysis
- 11.2.2.4. Recent Developments
- 11.2.2.5. Financials (Based on Availability)
- 11.2.3 Dow
- 11.2.3.1. Overview
- 11.2.3.2. Products
- 11.2.3.3. SWOT Analysis
- 11.2.3.4. Recent Developments
- 11.2.3.5. Financials (Based on Availability)
- 11.2.4 Dycon Chemicals
- 11.2.4.1. Overview
- 11.2.4.2. Products
- 11.2.4.3. SWOT Analysis
- 11.2.4.4. Recent Developments
- 11.2.4.5. Financials (Based on Availability)
- 11.2.5 Hangzhou Keli Chemical Co Ltd
- 11.2.5.1. Overview
- 11.2.5.2. Products
- 11.2.5.3. SWOT Analysis
- 11.2.5.4. Recent Developments
- 11.2.5.5. Financials (Based on Availability)
- 11.2.6 Jiangsu Tianteng Chemical Industry Co Ltd
- 11.2.6.1. Overview
- 11.2.6.2. Products
- 11.2.6.3. SWOT Analysis
- 11.2.6.4. Recent Developments
- 11.2.6.5. Financials (Based on Availability)
- 11.2.7 Resonac Holdings Corporation
- 11.2.7.1. Overview
- 11.2.7.2. Products
- 11.2.7.3. SWOT Analysis
- 11.2.7.4. Recent Developments
- 11.2.7.5. Financials (Based on Availability)
- 11.2.8 Shandong Gaoxin Chemical Co Ltd
- 11.2.8.1. Overview
- 11.2.8.2. Products
- 11.2.8.3. SWOT Analysis
- 11.2.8.4. Recent Developments
- 11.2.8.5. Financials (Based on Availability)
- 11.2.9 Shandong Ketian Chemical Co Ltd
- 11.2.9.1. Overview
- 11.2.9.2. Products
- 11.2.9.3. SWOT Analysis
- 11.2.9.4. Recent Developments
- 11.2.9.5. Financials (Based on Availability)
- 11.2.10 Shandong Novista Chemical Ltd (Novista Group)
- 11.2.10.1. Overview
- 11.2.10.2. Products
- 11.2.10.3. SWOT Analysis
- 11.2.10.4. Recent Developments
- 11.2.10.5. Financials (Based on Availability)
- 11.2.11 Shandong Xiangsheng New Materials Technology Co Ltd
- 11.2.11.1. Overview
- 11.2.11.2. Products
- 11.2.11.3. SWOT Analysis
- 11.2.11.4. Recent Developments
- 11.2.11.5. Financials (Based on Availability)
- 11.2.12 Shandong Xuye New Materials Co Ltd
- 11.2.12.1. Overview
- 11.2.12.2. Products
- 11.2.12.3. SWOT Analysis
- 11.2.12.4. Recent Developments
- 11.2.12.5. Financials (Based on Availability)
- 11.2.13 Sundow Polymers Co Ltd
- 11.2.13.1. Overview
- 11.2.13.2. Products
- 11.2.13.3. SWOT Analysis
- 11.2.13.4. Recent Developments
- 11.2.13.5. Financials (Based on Availability)
- 11.2.14 Weifang Yaxing Chemical Co Ltd*List Not Exhaustive
- 11.2.14.1. Overview
- 11.2.14.2. Products
- 11.2.14.3. SWOT Analysis
- 11.2.14.4. Recent Developments
- 11.2.14.5. Financials (Based on Availability)
- 11.2.1 Aurora Material Solutions
List of Figures
- Figure 1: Global CPE Market Revenue Breakdown (Million, %) by Region 2024 & 2032
- Figure 2: Global CPE Market Volume Breakdown (Million, %) by Region 2024 & 2032
- Figure 3: Asia Pacific CPE Market Revenue (Million), by Product 2024 & 2032
- Figure 4: Asia Pacific CPE Market Volume (Million), by Product 2024 & 2032
- Figure 5: Asia Pacific CPE Market Revenue Share (%), by Product 2024 & 2032
- Figure 6: Asia Pacific CPE Market Volume Share (%), by Product 2024 & 2032
- Figure 7: Asia Pacific CPE Market Revenue (Million), by Application 2024 & 2032
- Figure 8: Asia Pacific CPE Market Volume (Million), by Application 2024 & 2032
- Figure 9: Asia Pacific CPE Market Revenue Share (%), by Application 2024 & 2032
- Figure 10: Asia Pacific CPE Market Volume Share (%), by Application 2024 & 2032
- Figure 11: Asia Pacific CPE Market Revenue (Million), by Country 2024 & 2032
- Figure 12: Asia Pacific CPE Market Volume (Million), by Country 2024 & 2032
- Figure 13: Asia Pacific CPE Market Revenue Share (%), by Country 2024 & 2032
- Figure 14: Asia Pacific CPE Market Volume Share (%), by Country 2024 & 2032
- Figure 15: North America CPE Market Revenue (Million), by Product 2024 & 2032
- Figure 16: North America CPE Market Volume (Million), by Product 2024 & 2032
- Figure 17: North America CPE Market Revenue Share (%), by Product 2024 & 2032
- Figure 18: North America CPE Market Volume Share (%), by Product 2024 & 2032
- Figure 19: North America CPE Market Revenue (Million), by Application 2024 & 2032
- Figure 20: North America CPE Market Volume (Million), by Application 2024 & 2032
- Figure 21: North America CPE Market Revenue Share (%), by Application 2024 & 2032
- Figure 22: North America CPE Market Volume Share (%), by Application 2024 & 2032
- Figure 23: North America CPE Market Revenue (Million), by Country 2024 & 2032
- Figure 24: North America CPE Market Volume (Million), by Country 2024 & 2032
- Figure 25: North America CPE Market Revenue Share (%), by Country 2024 & 2032
- Figure 26: North America CPE Market Volume Share (%), by Country 2024 & 2032
- Figure 27: Europe CPE Market Revenue (Million), by Product 2024 & 2032
- Figure 28: Europe CPE Market Volume (Million), by Product 2024 & 2032
- Figure 29: Europe CPE Market Revenue Share (%), by Product 2024 & 2032
- Figure 30: Europe CPE Market Volume Share (%), by Product 2024 & 2032
- Figure 31: Europe CPE Market Revenue (Million), by Application 2024 & 2032
- Figure 32: Europe CPE Market Volume (Million), by Application 2024 & 2032
- Figure 33: Europe CPE Market Revenue Share (%), by Application 2024 & 2032
- Figure 34: Europe CPE Market Volume Share (%), by Application 2024 & 2032
- Figure 35: Europe CPE Market Revenue (Million), by Country 2024 & 2032
- Figure 36: Europe CPE Market Volume (Million), by Country 2024 & 2032
- Figure 37: Europe CPE Market Revenue Share (%), by Country 2024 & 2032
- Figure 38: Europe CPE Market Volume Share (%), by Country 2024 & 2032
- Figure 39: South America CPE Market Revenue (Million), by Product 2024 & 2032
- Figure 40: South America CPE Market Volume (Million), by Product 2024 & 2032
- Figure 41: South America CPE Market Revenue Share (%), by Product 2024 & 2032
- Figure 42: South America CPE Market Volume Share (%), by Product 2024 & 2032
- Figure 43: South America CPE Market Revenue (Million), by Application 2024 & 2032
- Figure 44: South America CPE Market Volume (Million), by Application 2024 & 2032
- Figure 45: South America CPE Market Revenue Share (%), by Application 2024 & 2032
- Figure 46: South America CPE Market Volume Share (%), by Application 2024 & 2032
- Figure 47: South America CPE Market Revenue (Million), by Country 2024 & 2032
- Figure 48: South America CPE Market Volume (Million), by Country 2024 & 2032
- Figure 49: South America CPE Market Revenue Share (%), by Country 2024 & 2032
- Figure 50: South America CPE Market Volume Share (%), by Country 2024 & 2032
- Figure 51: Middle East and Africa CPE Market Revenue (Million), by Product 2024 & 2032
- Figure 52: Middle East and Africa CPE Market Volume (Million), by Product 2024 & 2032
- Figure 53: Middle East and Africa CPE Market Revenue Share (%), by Product 2024 & 2032
- Figure 54: Middle East and Africa CPE Market Volume Share (%), by Product 2024 & 2032
- Figure 55: Middle East and Africa CPE Market Revenue (Million), by Application 2024 & 2032
- Figure 56: Middle East and Africa CPE Market Volume (Million), by Application 2024 & 2032
- Figure 57: Middle East and Africa CPE Market Revenue Share (%), by Application 2024 & 2032
- Figure 58: Middle East and Africa CPE Market Volume Share (%), by Application 2024 & 2032
- Figure 59: Middle East and Africa CPE Market Revenue (Million), by Country 2024 & 2032
- Figure 60: Middle East and Africa CPE Market Volume (Million), by Country 2024 & 2032
- Figure 61: Middle East and Africa CPE Market Revenue Share (%), by Country 2024 & 2032
- Figure 62: Middle East and Africa CPE Market Volume Share (%), by Country 2024 & 2032
List of Tables
- Table 1: Global CPE Market Revenue Million Forecast, by Region 2019 & 2032
- Table 2: Global CPE Market Volume Million Forecast, by Region 2019 & 2032
- Table 3: Global CPE Market Revenue Million Forecast, by Product 2019 & 2032
- Table 4: Global CPE Market Volume Million Forecast, by Product 2019 & 2032
- Table 5: Global CPE Market Revenue Million Forecast, by Application 2019 & 2032
- Table 6: Global CPE Market Volume Million Forecast, by Application 2019 & 2032
- Table 7: Global CPE Market Revenue Million Forecast, by Region 2019 & 2032
- Table 8: Global CPE Market Volume Million Forecast, by Region 2019 & 2032
- Table 9: Global CPE Market Revenue Million Forecast, by Product 2019 & 2032
- Table 10: Global CPE Market Volume Million Forecast, by Product 2019 & 2032
- Table 11: Global CPE Market Revenue Million Forecast, by Application 2019 & 2032
- Table 12: Global CPE Market Volume Million Forecast, by Application 2019 & 2032
- Table 13: Global CPE Market Revenue Million Forecast, by Country 2019 & 2032
- Table 14: Global CPE Market Volume Million Forecast, by Country 2019 & 2032
- Table 15: China CPE Market Revenue (Million) Forecast, by Application 2019 & 2032
- Table 16: China CPE Market Volume (Million) Forecast, by Application 2019 & 2032
- Table 17: India CPE Market Revenue (Million) Forecast, by Application 2019 & 2032
- Table 18: India CPE Market Volume (Million) Forecast, by Application 2019 & 2032
- Table 19: Japan CPE Market Revenue (Million) Forecast, by Application 2019 & 2032
- Table 20: Japan CPE Market Volume (Million) Forecast, by Application 2019 & 2032
- Table 21: South Korea CPE Market Revenue (Million) Forecast, by Application 2019 & 2032
- Table 22: South Korea CPE Market Volume (Million) Forecast, by Application 2019 & 2032
- Table 23: Rest of Asia Pacific CPE Market Revenue (Million) Forecast, by Application 2019 & 2032
- Table 24: Rest of Asia Pacific CPE Market Volume (Million) Forecast, by Application 2019 & 2032
- Table 25: Global CPE Market Revenue Million Forecast, by Product 2019 & 2032
- Table 26: Global CPE Market Volume Million Forecast, by Product 2019 & 2032
- Table 27: Global CPE Market Revenue Million Forecast, by Application 2019 & 2032
- Table 28: Global CPE Market Volume Million Forecast, by Application 2019 & 2032
- Table 29: Global CPE Market Revenue Million Forecast, by Country 2019 & 2032
- Table 30: Global CPE Market Volume Million Forecast, by Country 2019 & 2032
- Table 31: United States CPE Market Revenue (Million) Forecast, by Application 2019 & 2032
- Table 32: United States CPE Market Volume (Million) Forecast, by Application 2019 & 2032
- Table 33: Canada CPE Market Revenue (Million) Forecast, by Application 2019 & 2032
- Table 34: Canada CPE Market Volume (Million) Forecast, by Application 2019 & 2032
- Table 35: Mexico CPE Market Revenue (Million) Forecast, by Application 2019 & 2032
- Table 36: Mexico CPE Market Volume (Million) Forecast, by Application 2019 & 2032
- Table 37: Global CPE Market Revenue Million Forecast, by Product 2019 & 2032
- Table 38: Global CPE Market Volume Million Forecast, by Product 2019 & 2032
- Table 39: Global CPE Market Revenue Million Forecast, by Application 2019 & 2032
- Table 40: Global CPE Market Volume Million Forecast, by Application 2019 & 2032
- Table 41: Global CPE Market Revenue Million Forecast, by Country 2019 & 2032
- Table 42: Global CPE Market Volume Million Forecast, by Country 2019 & 2032
- Table 43: Germany CPE Market Revenue (Million) Forecast, by Application 2019 & 2032
- Table 44: Germany CPE Market Volume (Million) Forecast, by Application 2019 & 2032
- Table 45: United Kingdom CPE Market Revenue (Million) Forecast, by Application 2019 & 2032
- Table 46: United Kingdom CPE Market Volume (Million) Forecast, by Application 2019 & 2032
- Table 47: France CPE Market Revenue (Million) Forecast, by Application 2019 & 2032
- Table 48: France CPE Market Volume (Million) Forecast, by Application 2019 & 2032
- Table 49: Italy CPE Market Revenue (Million) Forecast, by Application 2019 & 2032
- Table 50: Italy CPE Market Volume (Million) Forecast, by Application 2019 & 2032
- Table 51: Rest of Europe CPE Market Revenue (Million) Forecast, by Application 2019 & 2032
- Table 52: Rest of Europe CPE Market Volume (Million) Forecast, by Application 2019 & 2032
- Table 53: Global CPE Market Revenue Million Forecast, by Product 2019 & 2032
- Table 54: Global CPE Market Volume Million Forecast, by Product 2019 & 2032
- Table 55: Global CPE Market Revenue Million Forecast, by Application 2019 & 2032
- Table 56: Global CPE Market Volume Million Forecast, by Application 2019 & 2032
- Table 57: Global CPE Market Revenue Million Forecast, by Country 2019 & 2032
- Table 58: Global CPE Market Volume Million Forecast, by Country 2019 & 2032
- Table 59: Brazil CPE Market Revenue (Million) Forecast, by Application 2019 & 2032
- Table 60: Brazil CPE Market Volume (Million) Forecast, by Application 2019 & 2032
- Table 61: Argentina CPE Market Revenue (Million) Forecast, by Application 2019 & 2032
- Table 62: Argentina CPE Market Volume (Million) Forecast, by Application 2019 & 2032
- Table 63: Rest of South America CPE Market Revenue (Million) Forecast, by Application 2019 & 2032
- Table 64: Rest of South America CPE Market Volume (Million) Forecast, by Application 2019 & 2032
- Table 65: Global CPE Market Revenue Million Forecast, by Product 2019 & 2032
- Table 66: Global CPE Market Volume Million Forecast, by Product 2019 & 2032
- Table 67: Global CPE Market Revenue Million Forecast, by Application 2019 & 2032
- Table 68: Global CPE Market Volume Million Forecast, by Application 2019 & 2032
- Table 69: Global CPE Market Revenue Million Forecast, by Country 2019 & 2032
- Table 70: Global CPE Market Volume Million Forecast, by Country 2019 & 2032
- Table 71: Saudi Arabia CPE Market Revenue (Million) Forecast, by Application 2019 & 2032
- Table 72: Saudi Arabia CPE Market Volume (Million) Forecast, by Application 2019 & 2032
- Table 73: South Africa CPE Market Revenue (Million) Forecast, by Application 2019 & 2032
- Table 74: South Africa CPE Market Volume (Million) Forecast, by Application 2019 & 2032
- Table 75: Rest of Middle East and Africa CPE Market Revenue (Million) Forecast, by Application 2019 & 2032
- Table 76: Rest of Middle East and Africa CPE Market Volume (Million) Forecast, by Application 2019 & 2032
Frequently Asked Questions
1. What is the projected Compound Annual Growth Rate (CAGR) of the CPE Market?
The projected CAGR is approximately 5.45%.
2. Which companies are prominent players in the CPE Market?
Key companies in the market include Aurora Material Solutions, Bontecn Group China Co Ltd, Dow, Dycon Chemicals, Hangzhou Keli Chemical Co Ltd, Jiangsu Tianteng Chemical Industry Co Ltd, Resonac Holdings Corporation, Shandong Gaoxin Chemical Co Ltd, Shandong Ketian Chemical Co Ltd, Shandong Novista Chemical Ltd (Novista Group), Shandong Xiangsheng New Materials Technology Co Ltd, Shandong Xuye New Materials Co Ltd, Sundow Polymers Co Ltd, Weifang Yaxing Chemical Co Ltd*List Not Exhaustive.
3. What are the main segments of the CPE Market?
The market segments include Product, Application.
4. Can you provide details about the market size?
The market size is estimated to be USD 721.25 Million as of 2022.
5. What are some drivers contributing to market growth?
Rising Demand for CPE-based Impact Modifiers in PVC Products; Growing Demand for CPE-based Hoses and Tubes in the Automotive Industry.
6. What are the notable trends driving market growth?
Impact Modifier is Expected to Dominate the Market.
7. Are there any restraints impacting market growth?
Rising Demand for CPE-based Impact Modifiers in PVC Products; Growing Demand for CPE-based Hoses and Tubes in the Automotive Industry.
8. Can you provide examples of recent developments in the market?
May 2024: Aurora Plastics LLC (Aurora) announced the acquisition of EnCom Polymers Inc., extending its product offering to include chlorinated polyethylene alloys (CPE). This acquisition strengthened Aurora Plastics LLC's product portfolio.
9. What pricing options are available for accessing the report?
Pricing options include single-user, multi-user, and enterprise licenses priced at USD 4750, USD 5250, and USD 8750 respectively.
10. Is the market size provided in terms of value or volume?
The market size is provided in terms of value, measured in Million and volume, measured in Million.
11. Are there any specific market keywords associated with the report?
Yes, the market keyword associated with the report is "CPE Market," which aids in identifying and referencing the specific market segment covered.
12. How do I determine which pricing option suits my needs best?
The pricing options vary based on user requirements and access needs. Individual users may opt for single-user licenses, while businesses requiring broader access may choose multi-user or enterprise licenses for cost-effective access to the report.
13. Are there any additional resources or data provided in the CPE Market report?
While the report offers comprehensive insights, it's advisable to review the specific contents or supplementary materials provided to ascertain if additional resources or data are available.
14. How can I stay updated on further developments or reports in the CPE Market?
To stay informed about further developments, trends, and reports in the CPE Market, consider subscribing to industry newsletters, following relevant companies and organizations, or regularly checking reputable industry news sources and publications.
Methodology
Step 1 - Identification of Relevant Samples Size from Population Database


Step 2 - Approaches for Defining Global Market Size (Value, Volume* & Price*)

Note*: In applicable scenarios
Step 3 - Data Sources
Primary Research
- Web Analytics
- Survey Reports
- Research Institute
- Latest Research Reports
- Opinion Leaders
Secondary Research
- Annual Reports
- White Paper
- Latest Press Release
- Industry Association
- Paid Database
- Investor Presentations

Step 4 - Data Triangulation
Involves using different sources of information in order to increase the validity of a study
These sources are likely to be stakeholders in a program - participants, other researchers, program staff, other community members, and so on.
Then we put all data in single framework & apply various statistical tools to find out the dynamic on the market.
During the analysis stage, feedback from the stakeholder groups would be compared to determine areas of agreement as well as areas of divergence


