
Key Insights
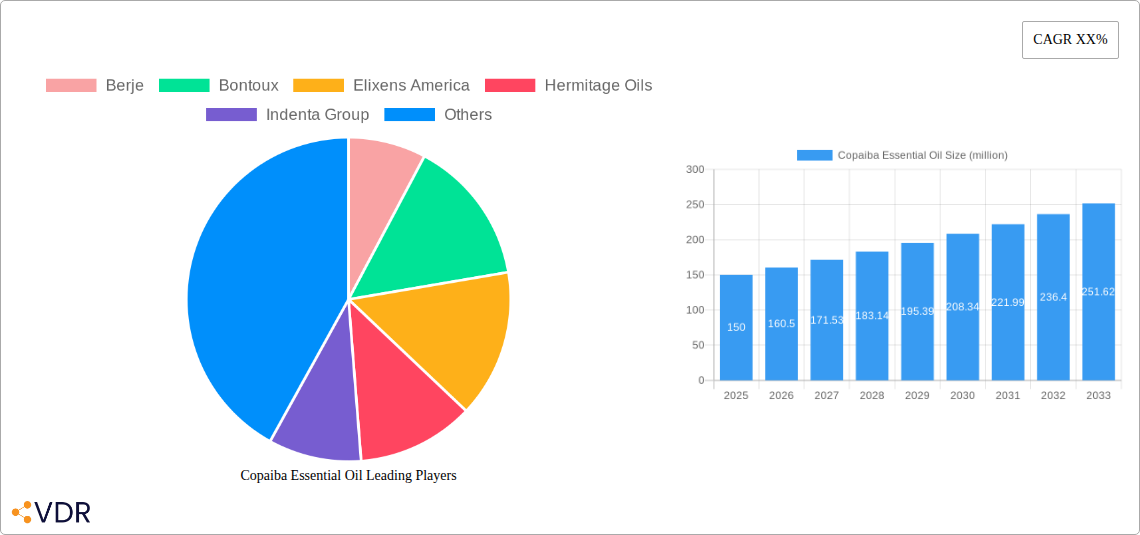
The global Copaiba essential oil market is experiencing robust growth, driven by increasing consumer awareness of its therapeutic benefits and applications in aromatherapy, cosmetics, and pharmaceuticals. The market, estimated at $150 million in 2025, is projected to exhibit a Compound Annual Growth Rate (CAGR) of 7% from 2025 to 2033, reaching an estimated value of $250 million by 2033. This expansion is fueled by several key factors. Growing demand for natural and organic products is a significant driver, with consumers increasingly seeking alternatives to synthetic ingredients in personal care and wellness applications. The rising popularity of aromatherapy and its perceived efficacy in stress reduction and mood enhancement further contribute to market growth. Furthermore, Copaiba oil's purported anti-inflammatory and analgesic properties are driving its adoption in the pharmaceutical sector, fostering innovation in topical pain relief formulations and other therapeutic applications. Key players like doTERRA International, Young Living Essential Oils, and Berje are actively shaping the market through product diversification, strategic partnerships, and expansion into new geographical territories.
However, the market faces certain restraints. Price volatility due to fluctuating raw material availability and production challenges in certain regions can impact market expansion. Moreover, stringent regulations surrounding the use of essential oils in pharmaceuticals and cosmetics in some countries create hurdles for market penetration. Nonetheless, the overall market outlook remains positive, propelled by burgeoning consumer demand, continued research into the therapeutic benefits of Copaiba oil, and the efforts of key market participants to overcome existing challenges. Segmentation within the market includes various forms (e.g., pure oil, blends), application areas (e.g., aromatherapy, cosmetics, pharmaceuticals), and distribution channels (e.g., online retailers, specialized stores). Geographical expansion, particularly into emerging markets in Asia and Latin America, offers significant growth opportunities.
Copaiba Essential Oil Market Report: 2019-2033
This comprehensive report provides an in-depth analysis of the global Copaiba Essential Oil market, offering invaluable insights for industry professionals, investors, and stakeholders. Covering the period 2019-2033, with a focus on 2025, this report unravels market dynamics, growth trends, and future opportunities within the essential oils and aromatherapy sectors. The report uses million units as the unit for all values.
Copaiba Essential Oil Market Dynamics & Structure
The global Copaiba Essential Oil market, valued at xx million units in 2024, exhibits a moderately concentrated structure. Key players like Berje, Bontoux, Elixens America, Hermitage Oils, Indenta Group, Indukern S.A, Jiangyin Healthway, doTERRA International, Aromatics International, Young Living Essential Oils, and Barefut hold significant market share, though the exact percentage varies. Technological innovation, particularly in extraction methods and quality control, is a major driver. Stringent regulatory frameworks concerning purity and labeling influence market operations. Competitive substitutes, such as other anti-inflammatory essential oils, exist, posing a challenge. The end-user demographics are largely focused on the aromatherapy, personal care, and pharmaceutical sectors. M&A activity in the sector has been relatively moderate (xx deals in the historical period), with larger players strategically acquiring smaller companies for access to unique extraction methods or distribution networks.
- Market Concentration: Moderately concentrated, with top players holding xx% market share in 2024.
- Technological Innovation: Focus on sustainable extraction and quality control.
- Regulatory Frameworks: Stringent regulations on purity and labeling.
- Competitive Substitutes: Other anti-inflammatory essential oils.
- End-User Demographics: Aromatherapy, personal care, pharmaceuticals.
- M&A Activity: xx deals between 2019-2024, primarily for supply chain consolidation.
- Innovation Barriers: High initial investment costs for advanced extraction technologies.
Copaiba Essential Oil Growth Trends & Insights
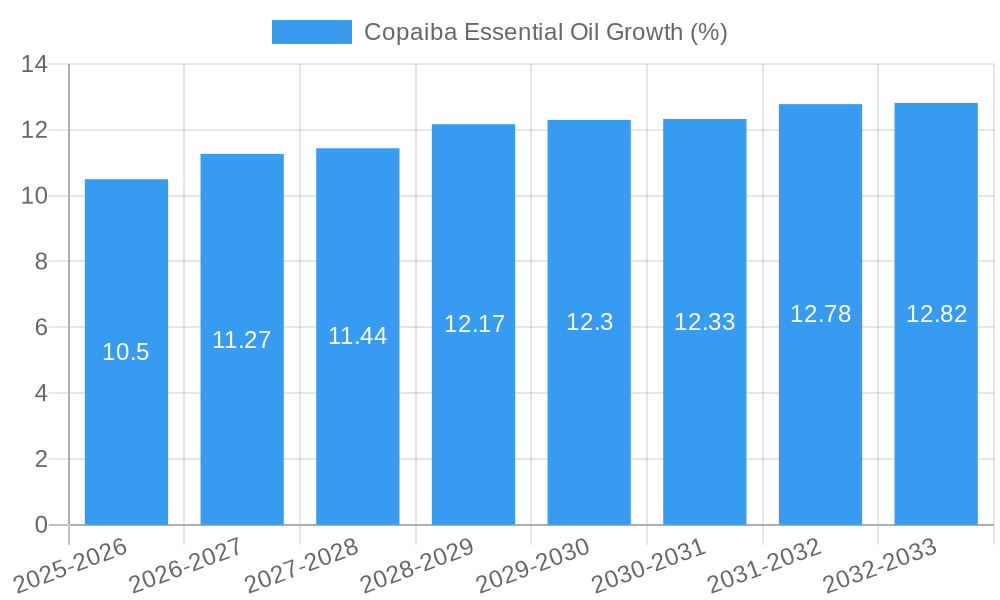
The Copaiba Essential Oil market experienced a CAGR of xx% during the historical period (2019-2024), reaching xx million units in 2024. This growth is primarily driven by increasing consumer awareness of the oil's therapeutic benefits and its growing adoption in various applications. Technological advancements in extraction and purification processes have further improved the quality and availability of the oil. Consumer behavior shifts towards natural and organic products have significantly boosted market demand. The forecast period (2025-2033) projects continued growth, with a projected CAGR of xx%, driven by expanding applications in personal care, cosmetics, and pharmaceuticals, as well as growing demand from emerging markets. Market penetration in key regions is expected to increase to xx% by 2033, indicating significant growth potential. Technological disruptions, such as the development of more efficient extraction methods, are expected to further accelerate growth.
Dominant Regions, Countries, or Segments in Copaiba Essential Oil
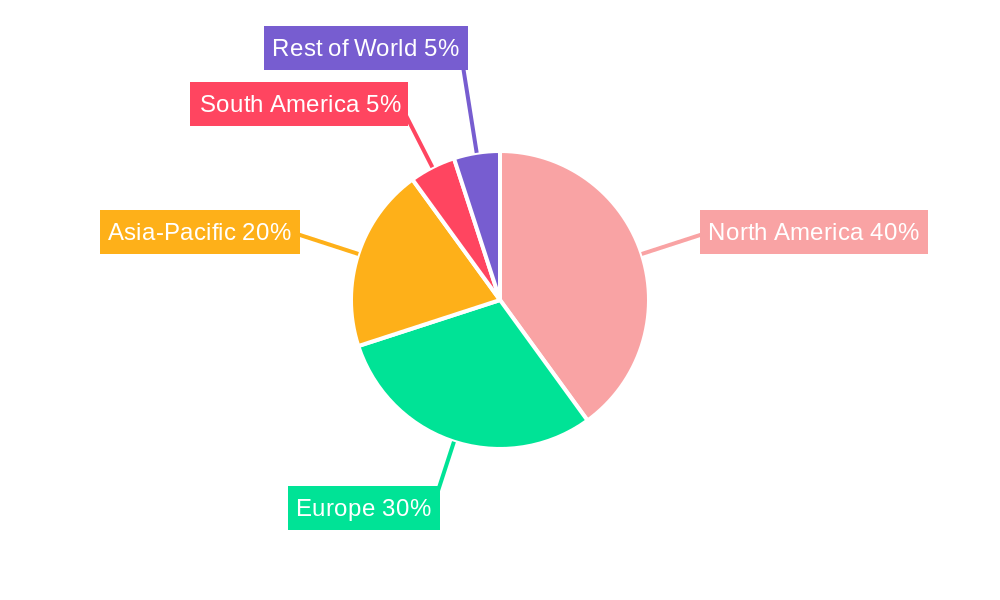
South America, particularly Brazil, is currently the dominant region for Copaiba Essential Oil production and export, driven by the extensive availability of the Copaiba tree. This dominance is due to favorable climatic conditions, established cultivation practices, and lower production costs. The region holds approximately xx% of the global market share in 2024. Key drivers include supportive government policies promoting sustainable harvesting and export incentives. North America and Europe show significant growth potential due to high consumer demand for natural health and wellness products. The aromatherapy segment represents the largest application area, contributing to xx% of total market value in 2024.
- Key Drivers in South America: Favorable climate, established cultivation, low production costs, supportive government policies.
- Growth Potential: North America and Europe driven by increasing demand for natural products.
- Dominant Segment: Aromatherapy, followed by personal care and pharmaceuticals.
Copaiba Essential Oil Product Landscape
The Copaiba Essential Oil market offers a range of products, varying in purity, extraction methods, and packaging. Recent innovations focus on developing standardized extraction processes to ensure consistent quality and purity. The unique selling proposition lies in its potent anti-inflammatory and analgesic properties, leading to various applications across personal care, aromatherapy, and pharmaceutical industries. Technological advancements include using supercritical CO2 extraction to preserve the oil's delicate components, improving its overall quality and efficacy.
Key Drivers, Barriers & Challenges in Copaiba Essential Oil
Key Drivers: Growing demand for natural remedies, increasing awareness of therapeutic benefits, expanding applications in diverse industries, technological advancements in extraction, and supportive government policies in key producing regions.
Challenges: Supply chain vulnerability due to reliance on wild harvesting, fluctuating prices due to seasonal variations in production, potential for adulteration and inconsistent quality, and stringent regulatory compliance requirements. These challenges could restrict market growth by approximately xx% in the forecast period if not addressed effectively.
Emerging Opportunities in Copaiba Essential Oil
Emerging opportunities include tapping into untapped markets in Asia and Africa, developing new applications in the food and beverage industry, and leveraging the growing popularity of personalized wellness solutions. Furthermore, exploring innovative delivery systems, such as topical patches or capsules, could enhance the oil's efficacy and appeal.
Growth Accelerators in the Copaiba Essential Oil Industry
Strategic partnerships between producers and manufacturers, investments in research and development to improve extraction methods and standardize quality, and expansion into new geographical markets will significantly accelerate market growth in the long term. Technological breakthroughs in sustainable and efficient extraction techniques will further contribute to the industry’s expansion.
Key Players Shaping the Copaiba Essential Oil Market
- Berje
- Bontoux
- Elixens America
- Hermitage Oils
- Indenta Group
- Indukern S.A
- Jiangyin Healthway
- doTERRA International
- Aromatics International
- Young Living Essential Oils
- Barefut
Notable Milestones in Copaiba Essential Oil Sector
- 2020: Increased regulatory scrutiny on the labeling and marketing of Copaiba essential oil in the EU.
- 2022: Launch of a new sustainable harvesting initiative by a major Brazilian producer.
- 2023: Introduction of a novel extraction method by a leading essential oil manufacturer, resulting in a higher yield and improved purity.
In-Depth Copaiba Essential Oil Market Outlook
The Copaiba Essential Oil market exhibits substantial growth potential, driven by the increasing global demand for natural health and wellness solutions. Strategic investments in sustainable harvesting practices, technological advancements, and market expansion will be crucial for capturing this potential. The market is expected to witness substantial expansion in the forecast period, with opportunities for innovation and growth across various applications and regions.
Copaiba Essential Oil Segmentation
-
1. Application
- 1.1. Cosmetics
- 1.2. Pharmaceuticals
- 1.3. Aromatherapy
- 1.4. Household
- 1.5. Personal Care
- 1.6. Other
-
2. Types
- 2.1. Moisturizer
- 2.2. Modifier
- 2.3. Blender
- 2.4. Fixative
Copaiba Essential Oil Segmentation By Geography
-
1. North America
- 1.1. United States
- 1.2. Canada
- 1.3. Mexico
-
2. South America
- 2.1. Brazil
- 2.2. Argentina
- 2.3. Rest of South America
-
3. Europe
- 3.1. United Kingdom
- 3.2. Germany
- 3.3. France
- 3.4. Italy
- 3.5. Spain
- 3.6. Russia
- 3.7. Benelux
- 3.8. Nordics
- 3.9. Rest of Europe
-
4. Middle East & Africa
- 4.1. Turkey
- 4.2. Israel
- 4.3. GCC
- 4.4. North Africa
- 4.5. South Africa
- 4.6. Rest of Middle East & Africa
-
5. Asia Pacific
- 5.1. China
- 5.2. India
- 5.3. Japan
- 5.4. South Korea
- 5.5. ASEAN
- 5.6. Oceania
- 5.7. Rest of Asia Pacific
Copaiba Essential Oil REPORT HIGHLIGHTS
| Aspects | Details |
|---|---|
| Study Period | 2019-2033 |
| Base Year | 2024 |
| Estimated Year | 2025 |
| Forecast Period | 2025-2033 |
| Historical Period | 2019-2024 |
| Growth Rate | CAGR of XX% from 2019-2033 |
| Segmentation |
|
Table of Contents
- 1. Introduction
- 1.1. Research Scope
- 1.2. Market Segmentation
- 1.3. Research Methodology
- 1.4. Definitions and Assumptions
- 2. Executive Summary
- 2.1. Introduction
- 3. Market Dynamics
- 3.1. Introduction
- 3.2. Market Drivers
- 3.3. Market Restrains
- 3.4. Market Trends
- 4. Market Factor Analysis
- 4.1. Porters Five Forces
- 4.2. Supply/Value Chain
- 4.3. PESTEL analysis
- 4.4. Market Entropy
- 4.5. Patent/Trademark Analysis
- 5. Global Copaiba Essential Oil Analysis, Insights and Forecast, 2019-2031
- 5.1. Market Analysis, Insights and Forecast - by Application
- 5.1.1. Cosmetics
- 5.1.2. Pharmaceuticals
- 5.1.3. Aromatherapy
- 5.1.4. Household
- 5.1.5. Personal Care
- 5.1.6. Other
- 5.2. Market Analysis, Insights and Forecast - by Types
- 5.2.1. Moisturizer
- 5.2.2. Modifier
- 5.2.3. Blender
- 5.2.4. Fixative
- 5.3. Market Analysis, Insights and Forecast - by Region
- 5.3.1. North America
- 5.3.2. South America
- 5.3.3. Europe
- 5.3.4. Middle East & Africa
- 5.3.5. Asia Pacific
- 5.1. Market Analysis, Insights and Forecast - by Application
- 6. North America Copaiba Essential Oil Analysis, Insights and Forecast, 2019-2031
- 6.1. Market Analysis, Insights and Forecast - by Application
- 6.1.1. Cosmetics
- 6.1.2. Pharmaceuticals
- 6.1.3. Aromatherapy
- 6.1.4. Household
- 6.1.5. Personal Care
- 6.1.6. Other
- 6.2. Market Analysis, Insights and Forecast - by Types
- 6.2.1. Moisturizer
- 6.2.2. Modifier
- 6.2.3. Blender
- 6.2.4. Fixative
- 6.1. Market Analysis, Insights and Forecast - by Application
- 7. South America Copaiba Essential Oil Analysis, Insights and Forecast, 2019-2031
- 7.1. Market Analysis, Insights and Forecast - by Application
- 7.1.1. Cosmetics
- 7.1.2. Pharmaceuticals
- 7.1.3. Aromatherapy
- 7.1.4. Household
- 7.1.5. Personal Care
- 7.1.6. Other
- 7.2. Market Analysis, Insights and Forecast - by Types
- 7.2.1. Moisturizer
- 7.2.2. Modifier
- 7.2.3. Blender
- 7.2.4. Fixative
- 7.1. Market Analysis, Insights and Forecast - by Application
- 8. Europe Copaiba Essential Oil Analysis, Insights and Forecast, 2019-2031
- 8.1. Market Analysis, Insights and Forecast - by Application
- 8.1.1. Cosmetics
- 8.1.2. Pharmaceuticals
- 8.1.3. Aromatherapy
- 8.1.4. Household
- 8.1.5. Personal Care
- 8.1.6. Other
- 8.2. Market Analysis, Insights and Forecast - by Types
- 8.2.1. Moisturizer
- 8.2.2. Modifier
- 8.2.3. Blender
- 8.2.4. Fixative
- 8.1. Market Analysis, Insights and Forecast - by Application
- 9. Middle East & Africa Copaiba Essential Oil Analysis, Insights and Forecast, 2019-2031
- 9.1. Market Analysis, Insights and Forecast - by Application
- 9.1.1. Cosmetics
- 9.1.2. Pharmaceuticals
- 9.1.3. Aromatherapy
- 9.1.4. Household
- 9.1.5. Personal Care
- 9.1.6. Other
- 9.2. Market Analysis, Insights and Forecast - by Types
- 9.2.1. Moisturizer
- 9.2.2. Modifier
- 9.2.3. Blender
- 9.2.4. Fixative
- 9.1. Market Analysis, Insights and Forecast - by Application
- 10. Asia Pacific Copaiba Essential Oil Analysis, Insights and Forecast, 2019-2031
- 10.1. Market Analysis, Insights and Forecast - by Application
- 10.1.1. Cosmetics
- 10.1.2. Pharmaceuticals
- 10.1.3. Aromatherapy
- 10.1.4. Household
- 10.1.5. Personal Care
- 10.1.6. Other
- 10.2. Market Analysis, Insights and Forecast - by Types
- 10.2.1. Moisturizer
- 10.2.2. Modifier
- 10.2.3. Blender
- 10.2.4. Fixative
- 10.1. Market Analysis, Insights and Forecast - by Application
- 11. Competitive Analysis
- 11.1. Global Market Share Analysis 2024
- 11.2. Company Profiles
- 11.2.1 Berje
- 11.2.1.1. Overview
- 11.2.1.2. Products
- 11.2.1.3. SWOT Analysis
- 11.2.1.4. Recent Developments
- 11.2.1.5. Financials (Based on Availability)
- 11.2.2 Bontoux
- 11.2.2.1. Overview
- 11.2.2.2. Products
- 11.2.2.3. SWOT Analysis
- 11.2.2.4. Recent Developments
- 11.2.2.5. Financials (Based on Availability)
- 11.2.3 Elixens America
- 11.2.3.1. Overview
- 11.2.3.2. Products
- 11.2.3.3. SWOT Analysis
- 11.2.3.4. Recent Developments
- 11.2.3.5. Financials (Based on Availability)
- 11.2.4 Hermitage Oils
- 11.2.4.1. Overview
- 11.2.4.2. Products
- 11.2.4.3. SWOT Analysis
- 11.2.4.4. Recent Developments
- 11.2.4.5. Financials (Based on Availability)
- 11.2.5 Indenta Group
- 11.2.5.1. Overview
- 11.2.5.2. Products
- 11.2.5.3. SWOT Analysis
- 11.2.5.4. Recent Developments
- 11.2.5.5. Financials (Based on Availability)
- 11.2.6 Indukern S A
- 11.2.6.1. Overview
- 11.2.6.2. Products
- 11.2.6.3. SWOT Analysis
- 11.2.6.4. Recent Developments
- 11.2.6.5. Financials (Based on Availability)
- 11.2.7 Jiangyin Healthway
- 11.2.7.1. Overview
- 11.2.7.2. Products
- 11.2.7.3. SWOT Analysis
- 11.2.7.4. Recent Developments
- 11.2.7.5. Financials (Based on Availability)
- 11.2.8 doTERRA International
- 11.2.8.1. Overview
- 11.2.8.2. Products
- 11.2.8.3. SWOT Analysis
- 11.2.8.4. Recent Developments
- 11.2.8.5. Financials (Based on Availability)
- 11.2.9 Aromatics International
- 11.2.9.1. Overview
- 11.2.9.2. Products
- 11.2.9.3. SWOT Analysis
- 11.2.9.4. Recent Developments
- 11.2.9.5. Financials (Based on Availability)
- 11.2.10 Young Living Essential Oils
- 11.2.10.1. Overview
- 11.2.10.2. Products
- 11.2.10.3. SWOT Analysis
- 11.2.10.4. Recent Developments
- 11.2.10.5. Financials (Based on Availability)
- 11.2.11 Barefut
- 11.2.11.1. Overview
- 11.2.11.2. Products
- 11.2.11.3. SWOT Analysis
- 11.2.11.4. Recent Developments
- 11.2.11.5. Financials (Based on Availability)
- 11.2.1 Berje
List of Figures
- Figure 1: Global Copaiba Essential Oil Revenue Breakdown (million, %) by Region 2024 & 2032
- Figure 2: Global Copaiba Essential Oil Volume Breakdown (K, %) by Region 2024 & 2032
- Figure 3: North America Copaiba Essential Oil Revenue (million), by Application 2024 & 2032
- Figure 4: North America Copaiba Essential Oil Volume (K), by Application 2024 & 2032
- Figure 5: North America Copaiba Essential Oil Revenue Share (%), by Application 2024 & 2032
- Figure 6: North America Copaiba Essential Oil Volume Share (%), by Application 2024 & 2032
- Figure 7: North America Copaiba Essential Oil Revenue (million), by Types 2024 & 2032
- Figure 8: North America Copaiba Essential Oil Volume (K), by Types 2024 & 2032
- Figure 9: North America Copaiba Essential Oil Revenue Share (%), by Types 2024 & 2032
- Figure 10: North America Copaiba Essential Oil Volume Share (%), by Types 2024 & 2032
- Figure 11: North America Copaiba Essential Oil Revenue (million), by Country 2024 & 2032
- Figure 12: North America Copaiba Essential Oil Volume (K), by Country 2024 & 2032
- Figure 13: North America Copaiba Essential Oil Revenue Share (%), by Country 2024 & 2032
- Figure 14: North America Copaiba Essential Oil Volume Share (%), by Country 2024 & 2032
- Figure 15: South America Copaiba Essential Oil Revenue (million), by Application 2024 & 2032
- Figure 16: South America Copaiba Essential Oil Volume (K), by Application 2024 & 2032
- Figure 17: South America Copaiba Essential Oil Revenue Share (%), by Application 2024 & 2032
- Figure 18: South America Copaiba Essential Oil Volume Share (%), by Application 2024 & 2032
- Figure 19: South America Copaiba Essential Oil Revenue (million), by Types 2024 & 2032
- Figure 20: South America Copaiba Essential Oil Volume (K), by Types 2024 & 2032
- Figure 21: South America Copaiba Essential Oil Revenue Share (%), by Types 2024 & 2032
- Figure 22: South America Copaiba Essential Oil Volume Share (%), by Types 2024 & 2032
- Figure 23: South America Copaiba Essential Oil Revenue (million), by Country 2024 & 2032
- Figure 24: South America Copaiba Essential Oil Volume (K), by Country 2024 & 2032
- Figure 25: South America Copaiba Essential Oil Revenue Share (%), by Country 2024 & 2032
- Figure 26: South America Copaiba Essential Oil Volume Share (%), by Country 2024 & 2032
- Figure 27: Europe Copaiba Essential Oil Revenue (million), by Application 2024 & 2032
- Figure 28: Europe Copaiba Essential Oil Volume (K), by Application 2024 & 2032
- Figure 29: Europe Copaiba Essential Oil Revenue Share (%), by Application 2024 & 2032
- Figure 30: Europe Copaiba Essential Oil Volume Share (%), by Application 2024 & 2032
- Figure 31: Europe Copaiba Essential Oil Revenue (million), by Types 2024 & 2032
- Figure 32: Europe Copaiba Essential Oil Volume (K), by Types 2024 & 2032
- Figure 33: Europe Copaiba Essential Oil Revenue Share (%), by Types 2024 & 2032
- Figure 34: Europe Copaiba Essential Oil Volume Share (%), by Types 2024 & 2032
- Figure 35: Europe Copaiba Essential Oil Revenue (million), by Country 2024 & 2032
- Figure 36: Europe Copaiba Essential Oil Volume (K), by Country 2024 & 2032
- Figure 37: Europe Copaiba Essential Oil Revenue Share (%), by Country 2024 & 2032
- Figure 38: Europe Copaiba Essential Oil Volume Share (%), by Country 2024 & 2032
- Figure 39: Middle East & Africa Copaiba Essential Oil Revenue (million), by Application 2024 & 2032
- Figure 40: Middle East & Africa Copaiba Essential Oil Volume (K), by Application 2024 & 2032
- Figure 41: Middle East & Africa Copaiba Essential Oil Revenue Share (%), by Application 2024 & 2032
- Figure 42: Middle East & Africa Copaiba Essential Oil Volume Share (%), by Application 2024 & 2032
- Figure 43: Middle East & Africa Copaiba Essential Oil Revenue (million), by Types 2024 & 2032
- Figure 44: Middle East & Africa Copaiba Essential Oil Volume (K), by Types 2024 & 2032
- Figure 45: Middle East & Africa Copaiba Essential Oil Revenue Share (%), by Types 2024 & 2032
- Figure 46: Middle East & Africa Copaiba Essential Oil Volume Share (%), by Types 2024 & 2032
- Figure 47: Middle East & Africa Copaiba Essential Oil Revenue (million), by Country 2024 & 2032
- Figure 48: Middle East & Africa Copaiba Essential Oil Volume (K), by Country 2024 & 2032
- Figure 49: Middle East & Africa Copaiba Essential Oil Revenue Share (%), by Country 2024 & 2032
- Figure 50: Middle East & Africa Copaiba Essential Oil Volume Share (%), by Country 2024 & 2032
- Figure 51: Asia Pacific Copaiba Essential Oil Revenue (million), by Application 2024 & 2032
- Figure 52: Asia Pacific Copaiba Essential Oil Volume (K), by Application 2024 & 2032
- Figure 53: Asia Pacific Copaiba Essential Oil Revenue Share (%), by Application 2024 & 2032
- Figure 54: Asia Pacific Copaiba Essential Oil Volume Share (%), by Application 2024 & 2032
- Figure 55: Asia Pacific Copaiba Essential Oil Revenue (million), by Types 2024 & 2032
- Figure 56: Asia Pacific Copaiba Essential Oil Volume (K), by Types 2024 & 2032
- Figure 57: Asia Pacific Copaiba Essential Oil Revenue Share (%), by Types 2024 & 2032
- Figure 58: Asia Pacific Copaiba Essential Oil Volume Share (%), by Types 2024 & 2032
- Figure 59: Asia Pacific Copaiba Essential Oil Revenue (million), by Country 2024 & 2032
- Figure 60: Asia Pacific Copaiba Essential Oil Volume (K), by Country 2024 & 2032
- Figure 61: Asia Pacific Copaiba Essential Oil Revenue Share (%), by Country 2024 & 2032
- Figure 62: Asia Pacific Copaiba Essential Oil Volume Share (%), by Country 2024 & 2032
List of Tables
- Table 1: Global Copaiba Essential Oil Revenue million Forecast, by Region 2019 & 2032
- Table 2: Global Copaiba Essential Oil Volume K Forecast, by Region 2019 & 2032
- Table 3: Global Copaiba Essential Oil Revenue million Forecast, by Application 2019 & 2032
- Table 4: Global Copaiba Essential Oil Volume K Forecast, by Application 2019 & 2032
- Table 5: Global Copaiba Essential Oil Revenue million Forecast, by Types 2019 & 2032
- Table 6: Global Copaiba Essential Oil Volume K Forecast, by Types 2019 & 2032
- Table 7: Global Copaiba Essential Oil Revenue million Forecast, by Region 2019 & 2032
- Table 8: Global Copaiba Essential Oil Volume K Forecast, by Region 2019 & 2032
- Table 9: Global Copaiba Essential Oil Revenue million Forecast, by Application 2019 & 2032
- Table 10: Global Copaiba Essential Oil Volume K Forecast, by Application 2019 & 2032
- Table 11: Global Copaiba Essential Oil Revenue million Forecast, by Types 2019 & 2032
- Table 12: Global Copaiba Essential Oil Volume K Forecast, by Types 2019 & 2032
- Table 13: Global Copaiba Essential Oil Revenue million Forecast, by Country 2019 & 2032
- Table 14: Global Copaiba Essential Oil Volume K Forecast, by Country 2019 & 2032
- Table 15: United States Copaiba Essential Oil Revenue (million) Forecast, by Application 2019 & 2032
- Table 16: United States Copaiba Essential Oil Volume (K) Forecast, by Application 2019 & 2032
- Table 17: Canada Copaiba Essential Oil Revenue (million) Forecast, by Application 2019 & 2032
- Table 18: Canada Copaiba Essential Oil Volume (K) Forecast, by Application 2019 & 2032
- Table 19: Mexico Copaiba Essential Oil Revenue (million) Forecast, by Application 2019 & 2032
- Table 20: Mexico Copaiba Essential Oil Volume (K) Forecast, by Application 2019 & 2032
- Table 21: Global Copaiba Essential Oil Revenue million Forecast, by Application 2019 & 2032
- Table 22: Global Copaiba Essential Oil Volume K Forecast, by Application 2019 & 2032
- Table 23: Global Copaiba Essential Oil Revenue million Forecast, by Types 2019 & 2032
- Table 24: Global Copaiba Essential Oil Volume K Forecast, by Types 2019 & 2032
- Table 25: Global Copaiba Essential Oil Revenue million Forecast, by Country 2019 & 2032
- Table 26: Global Copaiba Essential Oil Volume K Forecast, by Country 2019 & 2032
- Table 27: Brazil Copaiba Essential Oil Revenue (million) Forecast, by Application 2019 & 2032
- Table 28: Brazil Copaiba Essential Oil Volume (K) Forecast, by Application 2019 & 2032
- Table 29: Argentina Copaiba Essential Oil Revenue (million) Forecast, by Application 2019 & 2032
- Table 30: Argentina Copaiba Essential Oil Volume (K) Forecast, by Application 2019 & 2032
- Table 31: Rest of South America Copaiba Essential Oil Revenue (million) Forecast, by Application 2019 & 2032
- Table 32: Rest of South America Copaiba Essential Oil Volume (K) Forecast, by Application 2019 & 2032
- Table 33: Global Copaiba Essential Oil Revenue million Forecast, by Application 2019 & 2032
- Table 34: Global Copaiba Essential Oil Volume K Forecast, by Application 2019 & 2032
- Table 35: Global Copaiba Essential Oil Revenue million Forecast, by Types 2019 & 2032
- Table 36: Global Copaiba Essential Oil Volume K Forecast, by Types 2019 & 2032
- Table 37: Global Copaiba Essential Oil Revenue million Forecast, by Country 2019 & 2032
- Table 38: Global Copaiba Essential Oil Volume K Forecast, by Country 2019 & 2032
- Table 39: United Kingdom Copaiba Essential Oil Revenue (million) Forecast, by Application 2019 & 2032
- Table 40: United Kingdom Copaiba Essential Oil Volume (K) Forecast, by Application 2019 & 2032
- Table 41: Germany Copaiba Essential Oil Revenue (million) Forecast, by Application 2019 & 2032
- Table 42: Germany Copaiba Essential Oil Volume (K) Forecast, by Application 2019 & 2032
- Table 43: France Copaiba Essential Oil Revenue (million) Forecast, by Application 2019 & 2032
- Table 44: France Copaiba Essential Oil Volume (K) Forecast, by Application 2019 & 2032
- Table 45: Italy Copaiba Essential Oil Revenue (million) Forecast, by Application 2019 & 2032
- Table 46: Italy Copaiba Essential Oil Volume (K) Forecast, by Application 2019 & 2032
- Table 47: Spain Copaiba Essential Oil Revenue (million) Forecast, by Application 2019 & 2032
- Table 48: Spain Copaiba Essential Oil Volume (K) Forecast, by Application 2019 & 2032
- Table 49: Russia Copaiba Essential Oil Revenue (million) Forecast, by Application 2019 & 2032
- Table 50: Russia Copaiba Essential Oil Volume (K) Forecast, by Application 2019 & 2032
- Table 51: Benelux Copaiba Essential Oil Revenue (million) Forecast, by Application 2019 & 2032
- Table 52: Benelux Copaiba Essential Oil Volume (K) Forecast, by Application 2019 & 2032
- Table 53: Nordics Copaiba Essential Oil Revenue (million) Forecast, by Application 2019 & 2032
- Table 54: Nordics Copaiba Essential Oil Volume (K) Forecast, by Application 2019 & 2032
- Table 55: Rest of Europe Copaiba Essential Oil Revenue (million) Forecast, by Application 2019 & 2032
- Table 56: Rest of Europe Copaiba Essential Oil Volume (K) Forecast, by Application 2019 & 2032
- Table 57: Global Copaiba Essential Oil Revenue million Forecast, by Application 2019 & 2032
- Table 58: Global Copaiba Essential Oil Volume K Forecast, by Application 2019 & 2032
- Table 59: Global Copaiba Essential Oil Revenue million Forecast, by Types 2019 & 2032
- Table 60: Global Copaiba Essential Oil Volume K Forecast, by Types 2019 & 2032
- Table 61: Global Copaiba Essential Oil Revenue million Forecast, by Country 2019 & 2032
- Table 62: Global Copaiba Essential Oil Volume K Forecast, by Country 2019 & 2032
- Table 63: Turkey Copaiba Essential Oil Revenue (million) Forecast, by Application 2019 & 2032
- Table 64: Turkey Copaiba Essential Oil Volume (K) Forecast, by Application 2019 & 2032
- Table 65: Israel Copaiba Essential Oil Revenue (million) Forecast, by Application 2019 & 2032
- Table 66: Israel Copaiba Essential Oil Volume (K) Forecast, by Application 2019 & 2032
- Table 67: GCC Copaiba Essential Oil Revenue (million) Forecast, by Application 2019 & 2032
- Table 68: GCC Copaiba Essential Oil Volume (K) Forecast, by Application 2019 & 2032
- Table 69: North Africa Copaiba Essential Oil Revenue (million) Forecast, by Application 2019 & 2032
- Table 70: North Africa Copaiba Essential Oil Volume (K) Forecast, by Application 2019 & 2032
- Table 71: South Africa Copaiba Essential Oil Revenue (million) Forecast, by Application 2019 & 2032
- Table 72: South Africa Copaiba Essential Oil Volume (K) Forecast, by Application 2019 & 2032
- Table 73: Rest of Middle East & Africa Copaiba Essential Oil Revenue (million) Forecast, by Application 2019 & 2032
- Table 74: Rest of Middle East & Africa Copaiba Essential Oil Volume (K) Forecast, by Application 2019 & 2032
- Table 75: Global Copaiba Essential Oil Revenue million Forecast, by Application 2019 & 2032
- Table 76: Global Copaiba Essential Oil Volume K Forecast, by Application 2019 & 2032
- Table 77: Global Copaiba Essential Oil Revenue million Forecast, by Types 2019 & 2032
- Table 78: Global Copaiba Essential Oil Volume K Forecast, by Types 2019 & 2032
- Table 79: Global Copaiba Essential Oil Revenue million Forecast, by Country 2019 & 2032
- Table 80: Global Copaiba Essential Oil Volume K Forecast, by Country 2019 & 2032
- Table 81: China Copaiba Essential Oil Revenue (million) Forecast, by Application 2019 & 2032
- Table 82: China Copaiba Essential Oil Volume (K) Forecast, by Application 2019 & 2032
- Table 83: India Copaiba Essential Oil Revenue (million) Forecast, by Application 2019 & 2032
- Table 84: India Copaiba Essential Oil Volume (K) Forecast, by Application 2019 & 2032
- Table 85: Japan Copaiba Essential Oil Revenue (million) Forecast, by Application 2019 & 2032
- Table 86: Japan Copaiba Essential Oil Volume (K) Forecast, by Application 2019 & 2032
- Table 87: South Korea Copaiba Essential Oil Revenue (million) Forecast, by Application 2019 & 2032
- Table 88: South Korea Copaiba Essential Oil Volume (K) Forecast, by Application 2019 & 2032
- Table 89: ASEAN Copaiba Essential Oil Revenue (million) Forecast, by Application 2019 & 2032
- Table 90: ASEAN Copaiba Essential Oil Volume (K) Forecast, by Application 2019 & 2032
- Table 91: Oceania Copaiba Essential Oil Revenue (million) Forecast, by Application 2019 & 2032
- Table 92: Oceania Copaiba Essential Oil Volume (K) Forecast, by Application 2019 & 2032
- Table 93: Rest of Asia Pacific Copaiba Essential Oil Revenue (million) Forecast, by Application 2019 & 2032
- Table 94: Rest of Asia Pacific Copaiba Essential Oil Volume (K) Forecast, by Application 2019 & 2032
Frequently Asked Questions
1. What is the projected Compound Annual Growth Rate (CAGR) of the Copaiba Essential Oil?
The projected CAGR is approximately XX%.
2. Which companies are prominent players in the Copaiba Essential Oil?
Key companies in the market include Berje, Bontoux, Elixens America, Hermitage Oils, Indenta Group, Indukern S A, Jiangyin Healthway, doTERRA International, Aromatics International, Young Living Essential Oils, Barefut.
3. What are the main segments of the Copaiba Essential Oil?
The market segments include Application, Types.
4. Can you provide details about the market size?
The market size is estimated to be USD XXX million as of 2022.
5. What are some drivers contributing to market growth?
N/A
6. What are the notable trends driving market growth?
N/A
7. Are there any restraints impacting market growth?
N/A
8. Can you provide examples of recent developments in the market?
N/A
9. What pricing options are available for accessing the report?
Pricing options include single-user, multi-user, and enterprise licenses priced at USD 3350.00, USD 5025.00, and USD 6700.00 respectively.
10. Is the market size provided in terms of value or volume?
The market size is provided in terms of value, measured in million and volume, measured in K.
11. Are there any specific market keywords associated with the report?
Yes, the market keyword associated with the report is "Copaiba Essential Oil," which aids in identifying and referencing the specific market segment covered.
12. How do I determine which pricing option suits my needs best?
The pricing options vary based on user requirements and access needs. Individual users may opt for single-user licenses, while businesses requiring broader access may choose multi-user or enterprise licenses for cost-effective access to the report.
13. Are there any additional resources or data provided in the Copaiba Essential Oil report?
While the report offers comprehensive insights, it's advisable to review the specific contents or supplementary materials provided to ascertain if additional resources or data are available.
14. How can I stay updated on further developments or reports in the Copaiba Essential Oil?
To stay informed about further developments, trends, and reports in the Copaiba Essential Oil, consider subscribing to industry newsletters, following relevant companies and organizations, or regularly checking reputable industry news sources and publications.
Methodology
Step 1 - Identification of Relevant Samples Size from Population Database


Step 2 - Approaches for Defining Global Market Size (Value, Volume* & Price*)

Note*: In applicable scenarios
Step 3 - Data Sources
Primary Research
- Web Analytics
- Survey Reports
- Research Institute
- Latest Research Reports
- Opinion Leaders
Secondary Research
- Annual Reports
- White Paper
- Latest Press Release
- Industry Association
- Paid Database
- Investor Presentations

Step 4 - Data Triangulation
Involves using different sources of information in order to increase the validity of a study
These sources are likely to be stakeholders in a program - participants, other researchers, program staff, other community members, and so on.
Then we put all data in single framework & apply various statistical tools to find out the dynamic on the market.
During the analysis stage, feedback from the stakeholder groups would be compared to determine areas of agreement as well as areas of divergence


