
Key Insights
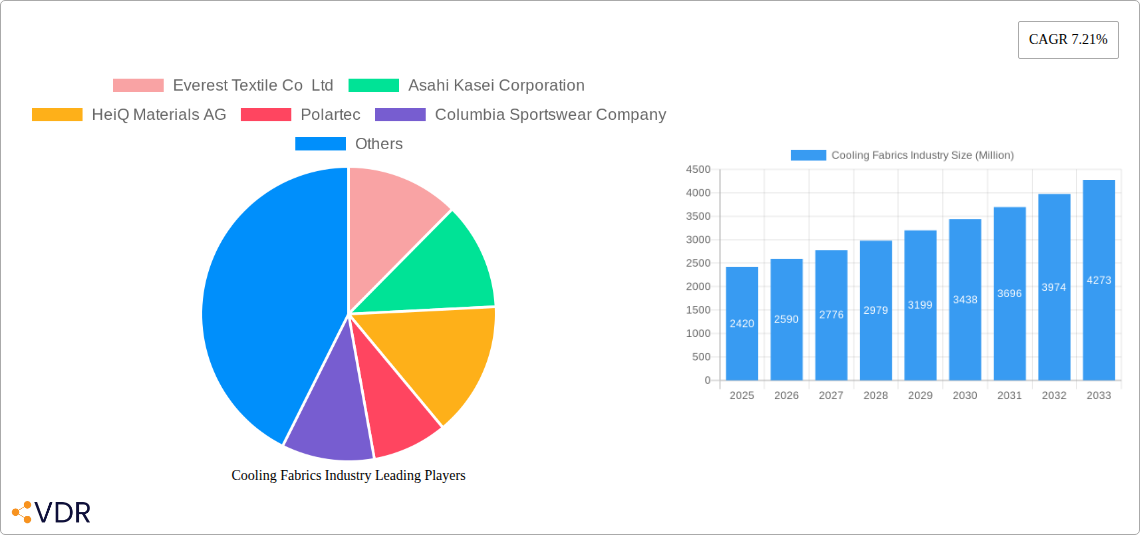
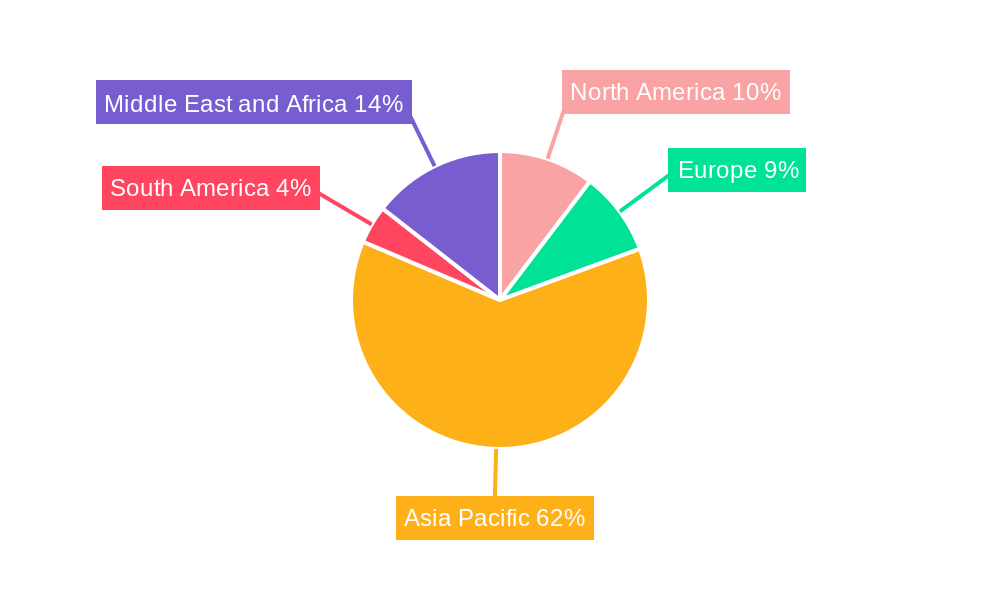
The global cooling fabrics market, valued at $2.42 billion in 2025, is projected to experience robust growth, driven by rising demand for athletic apparel, protective workwear, and medical textiles. A compound annual growth rate (CAGR) of 7.21% from 2025 to 2033 indicates a significant market expansion, fueled by several key factors. The increasing popularity of outdoor activities and athletic pursuits is a major driver, alongside growing awareness of the health benefits of temperature regulation during physical exertion. Technological advancements in fabric manufacturing are leading to the development of innovative cooling materials with enhanced breathability, moisture-wicking properties, and durability. The market segmentation reveals a diverse landscape, with sportswear dominating application-based segments, while natural and synthetic fibers compete within the material type category. The knitted fabric type is expected to witness significant growth, thanks to its comfort and flexibility. Geographically, the Asia-Pacific region, particularly China and India, holds a substantial market share due to expanding manufacturing capacities and rising consumer demand. North America and Europe, however, will also experience healthy growth driven by high disposable incomes and a strong preference for high-performance apparel. The market faces some challenges, including the fluctuating prices of raw materials and the potential for synthetic fabrics to have a negative environmental impact. However, the continued innovation in sustainable and eco-friendly cooling fabrics is mitigating these concerns and ensuring long-term market viability.
The competitive landscape is marked by both established players like Everest Textile Co Ltd and Asahi Kasei Corporation, and innovative startups focused on specialized cooling technologies. These companies are actively investing in research and development to enhance fabric performance, explore new material compositions, and cater to the diverse needs of various industry segments. The presence of both large multinational corporations and smaller, specialized firms suggests a dynamic market environment with opportunities for both established players and newcomers. The market’s future trajectory hinges on the successful adoption of innovative cooling technologies, sustainable manufacturing practices, and the ongoing consumer demand for improved comfort and performance in apparel and other textiles. The strategic partnerships and collaborations between companies across the value chain will also be critical in driving innovation and penetration into newer markets.
Cooling Fabrics Industry Market Report: 2019-2033
This comprehensive report provides a detailed analysis of the Cooling Fabrics Industry, encompassing market dynamics, growth trends, dominant segments, and key players. With a study period spanning 2019-2033, a base year of 2025, and a forecast period of 2025-2033, this report offers invaluable insights for industry professionals, investors, and strategic decision-makers. The market is segmented by application (sportswear, protective wear, apparels, others), type (natural, synthetic), and fabric type (woven, non-woven, knitted). The report’s quantitative analysis incorporates data in Million units.
Cooling Fabrics Industry Market Dynamics & Structure
The Cooling Fabrics market, valued at xx Million units in 2024, is characterized by moderate concentration, with key players holding significant market share. Technological innovation, driven by advancements in material science and textile engineering, is a primary growth driver. Stringent environmental regulations and growing consumer awareness of sustainability are also shaping industry practices. Competition from traditional fabrics and emerging substitutes necessitates continuous product innovation. The market exhibits diverse end-user demographics, with significant demand from sportswear, protective wear, and apparel sectors. M&A activity within the industry has been moderate (xx deals in the last 5 years), primarily focused on expanding product portfolios and geographical reach.
- Market Concentration: Moderately concentrated, with top 5 players holding approximately xx% market share.
- Technological Innovation: Focus on breathability, moisture-wicking, and UV protection.
- Regulatory Frameworks: Increasing emphasis on sustainability and ethical sourcing.
- Competitive Substitutes: Traditional fabrics and emerging materials like graphene-based fabrics.
- End-User Demographics: Strong demand from athletes, outdoor enthusiasts, and the general population.
- M&A Trends: Moderate activity, driven by expansion and diversification strategies.
Cooling Fabrics Industry Growth Trends & Insights
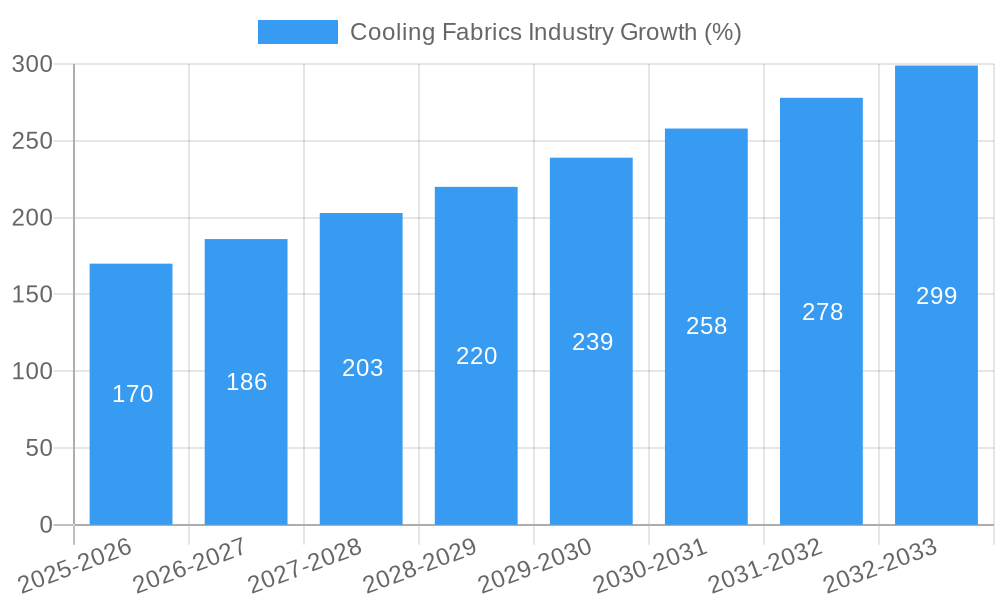
The Cooling Fabrics market has witnessed consistent growth during the historical period (2019-2024), exhibiting a CAGR of xx%. This growth is fueled by increasing consumer demand for comfort and performance apparel, particularly in warmer climates and among active individuals. Technological disruptions, such as the introduction of innovative cooling technologies and sustainable materials, are further driving market expansion. Consumer behavior shifts towards eco-friendly and ethically sourced products are also influencing market trends. Market penetration of cooling fabrics in various apparel segments is expected to increase significantly during the forecast period (2025-2033), with a projected CAGR of xx%. The rising popularity of athleisure and outdoor activities will continue to boost demand. Increased awareness of the benefits of cooling fabrics in medical applications presents a new avenue for growth.
Dominant Regions, Countries, or Segments in Cooling Fabrics Industry
North America currently holds the largest market share in the cooling fabrics industry, driven by high consumer spending on sportswear and outdoor apparel. Within applications, Sportswear exhibits the highest growth potential, fueled by the increasing popularity of fitness and athletic activities. The synthetic segment dominates due to its performance advantages, while the knitted fabric type leads in terms of production and application versatility. Key growth drivers in North America include a strong focus on technological advancement and a significant base of key players. Europe and Asia-Pacific are also experiencing robust growth, though at a slightly slower rate.
- Key Drivers in North America: Strong consumer demand, technological innovation, and established manufacturing base.
- Sportswear Segment: Highest growth potential due to rising participation in sports and fitness activities.
- Synthetic Segment: Dominates due to superior performance characteristics.
- Knitted Fabric Type: Leading in terms of production volume and application versatility.
Cooling Fabrics Industry Product Landscape
The Cooling Fabrics market showcases a diverse range of products, characterized by continuous innovation in material composition, weave structures, and finishing techniques. Key features include enhanced breathability, superior moisture-wicking properties, and UV protection. Manufacturers are actively developing fabrics with improved durability, comfort, and sustainability features. The focus on eco-friendly materials, such as recycled nylon and natural fibers, is gaining momentum. Unique selling propositions are centered around performance enhancement, comfort, and environmental responsibility.
Key Drivers, Barriers & Challenges in Cooling Fabrics Industry
Key Drivers:
- Rising demand for performance apparel in sports and outdoor activities.
- Growing awareness of the health benefits of regulating body temperature.
- Technological advancements in fabric design and manufacturing.
- Increased focus on sustainable and eco-friendly materials.
Challenges & Restraints:
- High production costs for certain high-performance cooling fabrics.
- Fluctuations in raw material prices impacting profitability.
- Intense competition from existing and emerging players.
- Regulatory compliance and adherence to sustainability standards.
Emerging Opportunities in Cooling Fabrics Industry
- Expansion into new applications, such as medical textiles and protective gear.
- Development of personalized cooling solutions based on individual needs.
- Increased use of smart textiles and integrated sensors for enhanced performance monitoring.
- Growing demand for sustainable and ethically sourced cooling fabrics.
Growth Accelerators in the Cooling Fabrics Industry
Technological advancements, particularly in material science and nanotechnology, are driving significant growth. Strategic partnerships between textile manufacturers and apparel brands are also accelerating market penetration. Expansion into new geographical markets, such as emerging economies with growing middle classes, is presenting significant opportunities. Focus on sustainable practices and circular economy principles is fostering long-term growth.
Key Players Shaping the Cooling Fabrics Industry Market
- Everest Textile Co Ltd
- Asahi Kasei Corporation
- HeiQ Materials AG
- Polartec
- Columbia Sportswear Company
- Formosa Taffeta Co Ltd
- NILIT
- Coolcore
- NAN YA PLASTICS CORPORATION
- Burlington
- Wilson Fabrics
- Balavigna Weaving Mills Pvt Ltd
Notable Milestones in Cooling Fabrics Industry Sector
- January 2023: NILIT launched a new version of SENSIL EcoCare recycled Nylon 6.6 manufactured completely from US materials at its North American facility in Martinsville, VA.
- March 2023: NILIT earned the International Sustainability and Carbon Certification Plus system (ISCC+) accreditation for its primary brand SENSIL ByNature, which manufactures cooling fabrics.
In-Depth Cooling Fabrics Industry Market Outlook
The Cooling Fabrics market is poised for significant growth in the coming years, driven by continued innovation, expanding applications, and growing consumer demand. Strategic partnerships, mergers and acquisitions, and investments in research and development will further accelerate market expansion. The focus on sustainability and ethical sourcing will increasingly shape industry practices. Untapped market potential in emerging economies and niche applications presents significant opportunities for growth.
Cooling Fabrics Industry Segmentation
-
1. Type
- 1.1. Natural
- 1.2. Synthetic
-
2. Fabric Type
- 2.1. Woven
- 2.2. Non-woven
- 2.3. Knitted
-
3. Application
- 3.1. Sportswear
- 3.2. Protective Wear
- 3.3. Apparels
- 3.4. Others (Medical, etc.)
Cooling Fabrics Industry Segmentation By Geography
-
1. Asia Pacific
- 1.1. China
- 1.2. India
- 1.3. Japan
- 1.4. South Korea
- 1.5. Rest of Asia Pacific
-
2. North America
- 2.1. United States
- 2.2. Canada
- 2.3. Mexico
-
3. Europe
- 3.1. Germany
- 3.2. United Kingdom
- 3.3. Italy
- 3.4. France
- 3.5. Rest of Europe
-
4. South America
- 4.1. Brazil
- 4.2. Argentina
- 4.3. Rest of South America
-
5. Middle East and Africa
- 5.1. Saudi Arabia
- 5.2. South Africa
- 5.3. Rest of Middle East and Africa
Cooling Fabrics Industry REPORT HIGHLIGHTS
| Aspects | Details |
|---|---|
| Study Period | 2019-2033 |
| Base Year | 2024 |
| Estimated Year | 2025 |
| Forecast Period | 2025-2033 |
| Historical Period | 2019-2024 |
| Growth Rate | CAGR of 7.21% from 2019-2033 |
| Segmentation |
|
Table of Contents
- 1. Introduction
- 1.1. Research Scope
- 1.2. Market Segmentation
- 1.3. Research Methodology
- 1.4. Definitions and Assumptions
- 2. Executive Summary
- 2.1. Introduction
- 3. Market Dynamics
- 3.1. Introduction
- 3.2. Market Drivers
- 3.2.1. Growing Demand for Synthetic Fabrics; Increasing Demand for Sportwear Fabrics; Other Drivers
- 3.3. Market Restrains
- 3.3.1. High Cost of Cooling Fabrics; Other Restraints
- 3.4. Market Trends
- 3.4.1. Increasing Demand from Sportswear Application
- 4. Market Factor Analysis
- 4.1. Porters Five Forces
- 4.2. Supply/Value Chain
- 4.3. PESTEL analysis
- 4.4. Market Entropy
- 4.5. Patent/Trademark Analysis
- 5. Global Cooling Fabrics Industry Analysis, Insights and Forecast, 2019-2031
- 5.1. Market Analysis, Insights and Forecast - by Type
- 5.1.1. Natural
- 5.1.2. Synthetic
- 5.2. Market Analysis, Insights and Forecast - by Fabric Type
- 5.2.1. Woven
- 5.2.2. Non-woven
- 5.2.3. Knitted
- 5.3. Market Analysis, Insights and Forecast - by Application
- 5.3.1. Sportswear
- 5.3.2. Protective Wear
- 5.3.3. Apparels
- 5.3.4. Others (Medical, etc.)
- 5.4. Market Analysis, Insights and Forecast - by Region
- 5.4.1. Asia Pacific
- 5.4.2. North America
- 5.4.3. Europe
- 5.4.4. South America
- 5.4.5. Middle East and Africa
- 5.1. Market Analysis, Insights and Forecast - by Type
- 6. Asia Pacific Cooling Fabrics Industry Analysis, Insights and Forecast, 2019-2031
- 6.1. Market Analysis, Insights and Forecast - by Type
- 6.1.1. Natural
- 6.1.2. Synthetic
- 6.2. Market Analysis, Insights and Forecast - by Fabric Type
- 6.2.1. Woven
- 6.2.2. Non-woven
- 6.2.3. Knitted
- 6.3. Market Analysis, Insights and Forecast - by Application
- 6.3.1. Sportswear
- 6.3.2. Protective Wear
- 6.3.3. Apparels
- 6.3.4. Others (Medical, etc.)
- 6.1. Market Analysis, Insights and Forecast - by Type
- 7. North America Cooling Fabrics Industry Analysis, Insights and Forecast, 2019-2031
- 7.1. Market Analysis, Insights and Forecast - by Type
- 7.1.1. Natural
- 7.1.2. Synthetic
- 7.2. Market Analysis, Insights and Forecast - by Fabric Type
- 7.2.1. Woven
- 7.2.2. Non-woven
- 7.2.3. Knitted
- 7.3. Market Analysis, Insights and Forecast - by Application
- 7.3.1. Sportswear
- 7.3.2. Protective Wear
- 7.3.3. Apparels
- 7.3.4. Others (Medical, etc.)
- 7.1. Market Analysis, Insights and Forecast - by Type
- 8. Europe Cooling Fabrics Industry Analysis, Insights and Forecast, 2019-2031
- 8.1. Market Analysis, Insights and Forecast - by Type
- 8.1.1. Natural
- 8.1.2. Synthetic
- 8.2. Market Analysis, Insights and Forecast - by Fabric Type
- 8.2.1. Woven
- 8.2.2. Non-woven
- 8.2.3. Knitted
- 8.3. Market Analysis, Insights and Forecast - by Application
- 8.3.1. Sportswear
- 8.3.2. Protective Wear
- 8.3.3. Apparels
- 8.3.4. Others (Medical, etc.)
- 8.1. Market Analysis, Insights and Forecast - by Type
- 9. South America Cooling Fabrics Industry Analysis, Insights and Forecast, 2019-2031
- 9.1. Market Analysis, Insights and Forecast - by Type
- 9.1.1. Natural
- 9.1.2. Synthetic
- 9.2. Market Analysis, Insights and Forecast - by Fabric Type
- 9.2.1. Woven
- 9.2.2. Non-woven
- 9.2.3. Knitted
- 9.3. Market Analysis, Insights and Forecast - by Application
- 9.3.1. Sportswear
- 9.3.2. Protective Wear
- 9.3.3. Apparels
- 9.3.4. Others (Medical, etc.)
- 9.1. Market Analysis, Insights and Forecast - by Type
- 10. Middle East and Africa Cooling Fabrics Industry Analysis, Insights and Forecast, 2019-2031
- 10.1. Market Analysis, Insights and Forecast - by Type
- 10.1.1. Natural
- 10.1.2. Synthetic
- 10.2. Market Analysis, Insights and Forecast - by Fabric Type
- 10.2.1. Woven
- 10.2.2. Non-woven
- 10.2.3. Knitted
- 10.3. Market Analysis, Insights and Forecast - by Application
- 10.3.1. Sportswear
- 10.3.2. Protective Wear
- 10.3.3. Apparels
- 10.3.4. Others (Medical, etc.)
- 10.1. Market Analysis, Insights and Forecast - by Type
- 11. Asia Pacific Cooling Fabrics Industry Analysis, Insights and Forecast, 2019-2031
- 11.1. Market Analysis, Insights and Forecast - By Country/Sub-region
- 11.1.1 China
- 11.1.2 India
- 11.1.3 Japan
- 11.1.4 South Korea
- 11.1.5 Rest of Asia Pacific
- 12. North America Cooling Fabrics Industry Analysis, Insights and Forecast, 2019-2031
- 12.1. Market Analysis, Insights and Forecast - By Country/Sub-region
- 12.1.1 United States
- 12.1.2 Canada
- 12.1.3 Mexico
- 13. Europe Cooling Fabrics Industry Analysis, Insights and Forecast, 2019-2031
- 13.1. Market Analysis, Insights and Forecast - By Country/Sub-region
- 13.1.1 Germany
- 13.1.2 United Kingdom
- 13.1.3 Italy
- 13.1.4 France
- 13.1.5 Rest of Europe
- 14. South America Cooling Fabrics Industry Analysis, Insights and Forecast, 2019-2031
- 14.1. Market Analysis, Insights and Forecast - By Country/Sub-region
- 14.1.1 Brazil
- 14.1.2 Argentina
- 14.1.3 Rest of South America
- 15. Middle East and Africa Cooling Fabrics Industry Analysis, Insights and Forecast, 2019-2031
- 15.1. Market Analysis, Insights and Forecast - By Country/Sub-region
- 15.1.1 Saudi Arabia
- 15.1.2 South Africa
- 15.1.3 Rest of Middle East and Africa
- 16. Competitive Analysis
- 16.1. Global Market Share Analysis 2024
- 16.2. Company Profiles
- 16.2.1 Everest Textile Co Ltd
- 16.2.1.1. Overview
- 16.2.1.2. Products
- 16.2.1.3. SWOT Analysis
- 16.2.1.4. Recent Developments
- 16.2.1.5. Financials (Based on Availability)
- 16.2.2 Asahi Kasei Corporation
- 16.2.2.1. Overview
- 16.2.2.2. Products
- 16.2.2.3. SWOT Analysis
- 16.2.2.4. Recent Developments
- 16.2.2.5. Financials (Based on Availability)
- 16.2.3 HeiQ Materials AG
- 16.2.3.1. Overview
- 16.2.3.2. Products
- 16.2.3.3. SWOT Analysis
- 16.2.3.4. Recent Developments
- 16.2.3.5. Financials (Based on Availability)
- 16.2.4 Polartec
- 16.2.4.1. Overview
- 16.2.4.2. Products
- 16.2.4.3. SWOT Analysis
- 16.2.4.4. Recent Developments
- 16.2.4.5. Financials (Based on Availability)
- 16.2.5 Columbia Sportswear Company
- 16.2.5.1. Overview
- 16.2.5.2. Products
- 16.2.5.3. SWOT Analysis
- 16.2.5.4. Recent Developments
- 16.2.5.5. Financials (Based on Availability)
- 16.2.6 Formosa Taffeta Co Ltd
- 16.2.6.1. Overview
- 16.2.6.2. Products
- 16.2.6.3. SWOT Analysis
- 16.2.6.4. Recent Developments
- 16.2.6.5. Financials (Based on Availability)
- 16.2.7 NILIT
- 16.2.7.1. Overview
- 16.2.7.2. Products
- 16.2.7.3. SWOT Analysis
- 16.2.7.4. Recent Developments
- 16.2.7.5. Financials (Based on Availability)
- 16.2.8 Coolcore
- 16.2.8.1. Overview
- 16.2.8.2. Products
- 16.2.8.3. SWOT Analysis
- 16.2.8.4. Recent Developments
- 16.2.8.5. Financials (Based on Availability)
- 16.2.9 NAN YA PLASTICS CORPORATION
- 16.2.9.1. Overview
- 16.2.9.2. Products
- 16.2.9.3. SWOT Analysis
- 16.2.9.4. Recent Developments
- 16.2.9.5. Financials (Based on Availability)
- 16.2.10 Burlington
- 16.2.10.1. Overview
- 16.2.10.2. Products
- 16.2.10.3. SWOT Analysis
- 16.2.10.4. Recent Developments
- 16.2.10.5. Financials (Based on Availability)
- 16.2.11 Wilson Fabrics
- 16.2.11.1. Overview
- 16.2.11.2. Products
- 16.2.11.3. SWOT Analysis
- 16.2.11.4. Recent Developments
- 16.2.11.5. Financials (Based on Availability)
- 16.2.12 Balavigna Weaving Mills Pvt Ltd
- 16.2.12.1. Overview
- 16.2.12.2. Products
- 16.2.12.3. SWOT Analysis
- 16.2.12.4. Recent Developments
- 16.2.12.5. Financials (Based on Availability)
- 16.2.1 Everest Textile Co Ltd
List of Figures
- Figure 1: Global Cooling Fabrics Industry Revenue Breakdown (Million, %) by Region 2024 & 2032
- Figure 2: Global Cooling Fabrics Industry Volume Breakdown (K Tons, %) by Region 2024 & 2032
- Figure 3: Asia Pacific Cooling Fabrics Industry Revenue (Million), by Country 2024 & 2032
- Figure 4: Asia Pacific Cooling Fabrics Industry Volume (K Tons), by Country 2024 & 2032
- Figure 5: Asia Pacific Cooling Fabrics Industry Revenue Share (%), by Country 2024 & 2032
- Figure 6: Asia Pacific Cooling Fabrics Industry Volume Share (%), by Country 2024 & 2032
- Figure 7: North America Cooling Fabrics Industry Revenue (Million), by Country 2024 & 2032
- Figure 8: North America Cooling Fabrics Industry Volume (K Tons), by Country 2024 & 2032
- Figure 9: North America Cooling Fabrics Industry Revenue Share (%), by Country 2024 & 2032
- Figure 10: North America Cooling Fabrics Industry Volume Share (%), by Country 2024 & 2032
- Figure 11: Europe Cooling Fabrics Industry Revenue (Million), by Country 2024 & 2032
- Figure 12: Europe Cooling Fabrics Industry Volume (K Tons), by Country 2024 & 2032
- Figure 13: Europe Cooling Fabrics Industry Revenue Share (%), by Country 2024 & 2032
- Figure 14: Europe Cooling Fabrics Industry Volume Share (%), by Country 2024 & 2032
- Figure 15: South America Cooling Fabrics Industry Revenue (Million), by Country 2024 & 2032
- Figure 16: South America Cooling Fabrics Industry Volume (K Tons), by Country 2024 & 2032
- Figure 17: South America Cooling Fabrics Industry Revenue Share (%), by Country 2024 & 2032
- Figure 18: South America Cooling Fabrics Industry Volume Share (%), by Country 2024 & 2032
- Figure 19: Middle East and Africa Cooling Fabrics Industry Revenue (Million), by Country 2024 & 2032
- Figure 20: Middle East and Africa Cooling Fabrics Industry Volume (K Tons), by Country 2024 & 2032
- Figure 21: Middle East and Africa Cooling Fabrics Industry Revenue Share (%), by Country 2024 & 2032
- Figure 22: Middle East and Africa Cooling Fabrics Industry Volume Share (%), by Country 2024 & 2032
- Figure 23: Asia Pacific Cooling Fabrics Industry Revenue (Million), by Type 2024 & 2032
- Figure 24: Asia Pacific Cooling Fabrics Industry Volume (K Tons), by Type 2024 & 2032
- Figure 25: Asia Pacific Cooling Fabrics Industry Revenue Share (%), by Type 2024 & 2032
- Figure 26: Asia Pacific Cooling Fabrics Industry Volume Share (%), by Type 2024 & 2032
- Figure 27: Asia Pacific Cooling Fabrics Industry Revenue (Million), by Fabric Type 2024 & 2032
- Figure 28: Asia Pacific Cooling Fabrics Industry Volume (K Tons), by Fabric Type 2024 & 2032
- Figure 29: Asia Pacific Cooling Fabrics Industry Revenue Share (%), by Fabric Type 2024 & 2032
- Figure 30: Asia Pacific Cooling Fabrics Industry Volume Share (%), by Fabric Type 2024 & 2032
- Figure 31: Asia Pacific Cooling Fabrics Industry Revenue (Million), by Application 2024 & 2032
- Figure 32: Asia Pacific Cooling Fabrics Industry Volume (K Tons), by Application 2024 & 2032
- Figure 33: Asia Pacific Cooling Fabrics Industry Revenue Share (%), by Application 2024 & 2032
- Figure 34: Asia Pacific Cooling Fabrics Industry Volume Share (%), by Application 2024 & 2032
- Figure 35: Asia Pacific Cooling Fabrics Industry Revenue (Million), by Country 2024 & 2032
- Figure 36: Asia Pacific Cooling Fabrics Industry Volume (K Tons), by Country 2024 & 2032
- Figure 37: Asia Pacific Cooling Fabrics Industry Revenue Share (%), by Country 2024 & 2032
- Figure 38: Asia Pacific Cooling Fabrics Industry Volume Share (%), by Country 2024 & 2032
- Figure 39: North America Cooling Fabrics Industry Revenue (Million), by Type 2024 & 2032
- Figure 40: North America Cooling Fabrics Industry Volume (K Tons), by Type 2024 & 2032
- Figure 41: North America Cooling Fabrics Industry Revenue Share (%), by Type 2024 & 2032
- Figure 42: North America Cooling Fabrics Industry Volume Share (%), by Type 2024 & 2032
- Figure 43: North America Cooling Fabrics Industry Revenue (Million), by Fabric Type 2024 & 2032
- Figure 44: North America Cooling Fabrics Industry Volume (K Tons), by Fabric Type 2024 & 2032
- Figure 45: North America Cooling Fabrics Industry Revenue Share (%), by Fabric Type 2024 & 2032
- Figure 46: North America Cooling Fabrics Industry Volume Share (%), by Fabric Type 2024 & 2032
- Figure 47: North America Cooling Fabrics Industry Revenue (Million), by Application 2024 & 2032
- Figure 48: North America Cooling Fabrics Industry Volume (K Tons), by Application 2024 & 2032
- Figure 49: North America Cooling Fabrics Industry Revenue Share (%), by Application 2024 & 2032
- Figure 50: North America Cooling Fabrics Industry Volume Share (%), by Application 2024 & 2032
- Figure 51: North America Cooling Fabrics Industry Revenue (Million), by Country 2024 & 2032
- Figure 52: North America Cooling Fabrics Industry Volume (K Tons), by Country 2024 & 2032
- Figure 53: North America Cooling Fabrics Industry Revenue Share (%), by Country 2024 & 2032
- Figure 54: North America Cooling Fabrics Industry Volume Share (%), by Country 2024 & 2032
- Figure 55: Europe Cooling Fabrics Industry Revenue (Million), by Type 2024 & 2032
- Figure 56: Europe Cooling Fabrics Industry Volume (K Tons), by Type 2024 & 2032
- Figure 57: Europe Cooling Fabrics Industry Revenue Share (%), by Type 2024 & 2032
- Figure 58: Europe Cooling Fabrics Industry Volume Share (%), by Type 2024 & 2032
- Figure 59: Europe Cooling Fabrics Industry Revenue (Million), by Fabric Type 2024 & 2032
- Figure 60: Europe Cooling Fabrics Industry Volume (K Tons), by Fabric Type 2024 & 2032
- Figure 61: Europe Cooling Fabrics Industry Revenue Share (%), by Fabric Type 2024 & 2032
- Figure 62: Europe Cooling Fabrics Industry Volume Share (%), by Fabric Type 2024 & 2032
- Figure 63: Europe Cooling Fabrics Industry Revenue (Million), by Application 2024 & 2032
- Figure 64: Europe Cooling Fabrics Industry Volume (K Tons), by Application 2024 & 2032
- Figure 65: Europe Cooling Fabrics Industry Revenue Share (%), by Application 2024 & 2032
- Figure 66: Europe Cooling Fabrics Industry Volume Share (%), by Application 2024 & 2032
- Figure 67: Europe Cooling Fabrics Industry Revenue (Million), by Country 2024 & 2032
- Figure 68: Europe Cooling Fabrics Industry Volume (K Tons), by Country 2024 & 2032
- Figure 69: Europe Cooling Fabrics Industry Revenue Share (%), by Country 2024 & 2032
- Figure 70: Europe Cooling Fabrics Industry Volume Share (%), by Country 2024 & 2032
- Figure 71: South America Cooling Fabrics Industry Revenue (Million), by Type 2024 & 2032
- Figure 72: South America Cooling Fabrics Industry Volume (K Tons), by Type 2024 & 2032
- Figure 73: South America Cooling Fabrics Industry Revenue Share (%), by Type 2024 & 2032
- Figure 74: South America Cooling Fabrics Industry Volume Share (%), by Type 2024 & 2032
- Figure 75: South America Cooling Fabrics Industry Revenue (Million), by Fabric Type 2024 & 2032
- Figure 76: South America Cooling Fabrics Industry Volume (K Tons), by Fabric Type 2024 & 2032
- Figure 77: South America Cooling Fabrics Industry Revenue Share (%), by Fabric Type 2024 & 2032
- Figure 78: South America Cooling Fabrics Industry Volume Share (%), by Fabric Type 2024 & 2032
- Figure 79: South America Cooling Fabrics Industry Revenue (Million), by Application 2024 & 2032
- Figure 80: South America Cooling Fabrics Industry Volume (K Tons), by Application 2024 & 2032
- Figure 81: South America Cooling Fabrics Industry Revenue Share (%), by Application 2024 & 2032
- Figure 82: South America Cooling Fabrics Industry Volume Share (%), by Application 2024 & 2032
- Figure 83: South America Cooling Fabrics Industry Revenue (Million), by Country 2024 & 2032
- Figure 84: South America Cooling Fabrics Industry Volume (K Tons), by Country 2024 & 2032
- Figure 85: South America Cooling Fabrics Industry Revenue Share (%), by Country 2024 & 2032
- Figure 86: South America Cooling Fabrics Industry Volume Share (%), by Country 2024 & 2032
- Figure 87: Middle East and Africa Cooling Fabrics Industry Revenue (Million), by Type 2024 & 2032
- Figure 88: Middle East and Africa Cooling Fabrics Industry Volume (K Tons), by Type 2024 & 2032
- Figure 89: Middle East and Africa Cooling Fabrics Industry Revenue Share (%), by Type 2024 & 2032
- Figure 90: Middle East and Africa Cooling Fabrics Industry Volume Share (%), by Type 2024 & 2032
- Figure 91: Middle East and Africa Cooling Fabrics Industry Revenue (Million), by Fabric Type 2024 & 2032
- Figure 92: Middle East and Africa Cooling Fabrics Industry Volume (K Tons), by Fabric Type 2024 & 2032
- Figure 93: Middle East and Africa Cooling Fabrics Industry Revenue Share (%), by Fabric Type 2024 & 2032
- Figure 94: Middle East and Africa Cooling Fabrics Industry Volume Share (%), by Fabric Type 2024 & 2032
- Figure 95: Middle East and Africa Cooling Fabrics Industry Revenue (Million), by Application 2024 & 2032
- Figure 96: Middle East and Africa Cooling Fabrics Industry Volume (K Tons), by Application 2024 & 2032
- Figure 97: Middle East and Africa Cooling Fabrics Industry Revenue Share (%), by Application 2024 & 2032
- Figure 98: Middle East and Africa Cooling Fabrics Industry Volume Share (%), by Application 2024 & 2032
- Figure 99: Middle East and Africa Cooling Fabrics Industry Revenue (Million), by Country 2024 & 2032
- Figure 100: Middle East and Africa Cooling Fabrics Industry Volume (K Tons), by Country 2024 & 2032
- Figure 101: Middle East and Africa Cooling Fabrics Industry Revenue Share (%), by Country 2024 & 2032
- Figure 102: Middle East and Africa Cooling Fabrics Industry Volume Share (%), by Country 2024 & 2032
List of Tables
- Table 1: Global Cooling Fabrics Industry Revenue Million Forecast, by Region 2019 & 2032
- Table 2: Global Cooling Fabrics Industry Volume K Tons Forecast, by Region 2019 & 2032
- Table 3: Global Cooling Fabrics Industry Revenue Million Forecast, by Type 2019 & 2032
- Table 4: Global Cooling Fabrics Industry Volume K Tons Forecast, by Type 2019 & 2032
- Table 5: Global Cooling Fabrics Industry Revenue Million Forecast, by Fabric Type 2019 & 2032
- Table 6: Global Cooling Fabrics Industry Volume K Tons Forecast, by Fabric Type 2019 & 2032
- Table 7: Global Cooling Fabrics Industry Revenue Million Forecast, by Application 2019 & 2032
- Table 8: Global Cooling Fabrics Industry Volume K Tons Forecast, by Application 2019 & 2032
- Table 9: Global Cooling Fabrics Industry Revenue Million Forecast, by Region 2019 & 2032
- Table 10: Global Cooling Fabrics Industry Volume K Tons Forecast, by Region 2019 & 2032
- Table 11: Global Cooling Fabrics Industry Revenue Million Forecast, by Country 2019 & 2032
- Table 12: Global Cooling Fabrics Industry Volume K Tons Forecast, by Country 2019 & 2032
- Table 13: China Cooling Fabrics Industry Revenue (Million) Forecast, by Application 2019 & 2032
- Table 14: China Cooling Fabrics Industry Volume (K Tons) Forecast, by Application 2019 & 2032
- Table 15: India Cooling Fabrics Industry Revenue (Million) Forecast, by Application 2019 & 2032
- Table 16: India Cooling Fabrics Industry Volume (K Tons) Forecast, by Application 2019 & 2032
- Table 17: Japan Cooling Fabrics Industry Revenue (Million) Forecast, by Application 2019 & 2032
- Table 18: Japan Cooling Fabrics Industry Volume (K Tons) Forecast, by Application 2019 & 2032
- Table 19: South Korea Cooling Fabrics Industry Revenue (Million) Forecast, by Application 2019 & 2032
- Table 20: South Korea Cooling Fabrics Industry Volume (K Tons) Forecast, by Application 2019 & 2032
- Table 21: Rest of Asia Pacific Cooling Fabrics Industry Revenue (Million) Forecast, by Application 2019 & 2032
- Table 22: Rest of Asia Pacific Cooling Fabrics Industry Volume (K Tons) Forecast, by Application 2019 & 2032
- Table 23: Global Cooling Fabrics Industry Revenue Million Forecast, by Country 2019 & 2032
- Table 24: Global Cooling Fabrics Industry Volume K Tons Forecast, by Country 2019 & 2032
- Table 25: United States Cooling Fabrics Industry Revenue (Million) Forecast, by Application 2019 & 2032
- Table 26: United States Cooling Fabrics Industry Volume (K Tons) Forecast, by Application 2019 & 2032
- Table 27: Canada Cooling Fabrics Industry Revenue (Million) Forecast, by Application 2019 & 2032
- Table 28: Canada Cooling Fabrics Industry Volume (K Tons) Forecast, by Application 2019 & 2032
- Table 29: Mexico Cooling Fabrics Industry Revenue (Million) Forecast, by Application 2019 & 2032
- Table 30: Mexico Cooling Fabrics Industry Volume (K Tons) Forecast, by Application 2019 & 2032
- Table 31: Global Cooling Fabrics Industry Revenue Million Forecast, by Country 2019 & 2032
- Table 32: Global Cooling Fabrics Industry Volume K Tons Forecast, by Country 2019 & 2032
- Table 33: Germany Cooling Fabrics Industry Revenue (Million) Forecast, by Application 2019 & 2032
- Table 34: Germany Cooling Fabrics Industry Volume (K Tons) Forecast, by Application 2019 & 2032
- Table 35: United Kingdom Cooling Fabrics Industry Revenue (Million) Forecast, by Application 2019 & 2032
- Table 36: United Kingdom Cooling Fabrics Industry Volume (K Tons) Forecast, by Application 2019 & 2032
- Table 37: Italy Cooling Fabrics Industry Revenue (Million) Forecast, by Application 2019 & 2032
- Table 38: Italy Cooling Fabrics Industry Volume (K Tons) Forecast, by Application 2019 & 2032
- Table 39: France Cooling Fabrics Industry Revenue (Million) Forecast, by Application 2019 & 2032
- Table 40: France Cooling Fabrics Industry Volume (K Tons) Forecast, by Application 2019 & 2032
- Table 41: Rest of Europe Cooling Fabrics Industry Revenue (Million) Forecast, by Application 2019 & 2032
- Table 42: Rest of Europe Cooling Fabrics Industry Volume (K Tons) Forecast, by Application 2019 & 2032
- Table 43: Global Cooling Fabrics Industry Revenue Million Forecast, by Country 2019 & 2032
- Table 44: Global Cooling Fabrics Industry Volume K Tons Forecast, by Country 2019 & 2032
- Table 45: Brazil Cooling Fabrics Industry Revenue (Million) Forecast, by Application 2019 & 2032
- Table 46: Brazil Cooling Fabrics Industry Volume (K Tons) Forecast, by Application 2019 & 2032
- Table 47: Argentina Cooling Fabrics Industry Revenue (Million) Forecast, by Application 2019 & 2032
- Table 48: Argentina Cooling Fabrics Industry Volume (K Tons) Forecast, by Application 2019 & 2032
- Table 49: Rest of South America Cooling Fabrics Industry Revenue (Million) Forecast, by Application 2019 & 2032
- Table 50: Rest of South America Cooling Fabrics Industry Volume (K Tons) Forecast, by Application 2019 & 2032
- Table 51: Global Cooling Fabrics Industry Revenue Million Forecast, by Country 2019 & 2032
- Table 52: Global Cooling Fabrics Industry Volume K Tons Forecast, by Country 2019 & 2032
- Table 53: Saudi Arabia Cooling Fabrics Industry Revenue (Million) Forecast, by Application 2019 & 2032
- Table 54: Saudi Arabia Cooling Fabrics Industry Volume (K Tons) Forecast, by Application 2019 & 2032
- Table 55: South Africa Cooling Fabrics Industry Revenue (Million) Forecast, by Application 2019 & 2032
- Table 56: South Africa Cooling Fabrics Industry Volume (K Tons) Forecast, by Application 2019 & 2032
- Table 57: Rest of Middle East and Africa Cooling Fabrics Industry Revenue (Million) Forecast, by Application 2019 & 2032
- Table 58: Rest of Middle East and Africa Cooling Fabrics Industry Volume (K Tons) Forecast, by Application 2019 & 2032
- Table 59: Global Cooling Fabrics Industry Revenue Million Forecast, by Type 2019 & 2032
- Table 60: Global Cooling Fabrics Industry Volume K Tons Forecast, by Type 2019 & 2032
- Table 61: Global Cooling Fabrics Industry Revenue Million Forecast, by Fabric Type 2019 & 2032
- Table 62: Global Cooling Fabrics Industry Volume K Tons Forecast, by Fabric Type 2019 & 2032
- Table 63: Global Cooling Fabrics Industry Revenue Million Forecast, by Application 2019 & 2032
- Table 64: Global Cooling Fabrics Industry Volume K Tons Forecast, by Application 2019 & 2032
- Table 65: Global Cooling Fabrics Industry Revenue Million Forecast, by Country 2019 & 2032
- Table 66: Global Cooling Fabrics Industry Volume K Tons Forecast, by Country 2019 & 2032
- Table 67: China Cooling Fabrics Industry Revenue (Million) Forecast, by Application 2019 & 2032
- Table 68: China Cooling Fabrics Industry Volume (K Tons) Forecast, by Application 2019 & 2032
- Table 69: India Cooling Fabrics Industry Revenue (Million) Forecast, by Application 2019 & 2032
- Table 70: India Cooling Fabrics Industry Volume (K Tons) Forecast, by Application 2019 & 2032
- Table 71: Japan Cooling Fabrics Industry Revenue (Million) Forecast, by Application 2019 & 2032
- Table 72: Japan Cooling Fabrics Industry Volume (K Tons) Forecast, by Application 2019 & 2032
- Table 73: South Korea Cooling Fabrics Industry Revenue (Million) Forecast, by Application 2019 & 2032
- Table 74: South Korea Cooling Fabrics Industry Volume (K Tons) Forecast, by Application 2019 & 2032
- Table 75: Rest of Asia Pacific Cooling Fabrics Industry Revenue (Million) Forecast, by Application 2019 & 2032
- Table 76: Rest of Asia Pacific Cooling Fabrics Industry Volume (K Tons) Forecast, by Application 2019 & 2032
- Table 77: Global Cooling Fabrics Industry Revenue Million Forecast, by Type 2019 & 2032
- Table 78: Global Cooling Fabrics Industry Volume K Tons Forecast, by Type 2019 & 2032
- Table 79: Global Cooling Fabrics Industry Revenue Million Forecast, by Fabric Type 2019 & 2032
- Table 80: Global Cooling Fabrics Industry Volume K Tons Forecast, by Fabric Type 2019 & 2032
- Table 81: Global Cooling Fabrics Industry Revenue Million Forecast, by Application 2019 & 2032
- Table 82: Global Cooling Fabrics Industry Volume K Tons Forecast, by Application 2019 & 2032
- Table 83: Global Cooling Fabrics Industry Revenue Million Forecast, by Country 2019 & 2032
- Table 84: Global Cooling Fabrics Industry Volume K Tons Forecast, by Country 2019 & 2032
- Table 85: United States Cooling Fabrics Industry Revenue (Million) Forecast, by Application 2019 & 2032
- Table 86: United States Cooling Fabrics Industry Volume (K Tons) Forecast, by Application 2019 & 2032
- Table 87: Canada Cooling Fabrics Industry Revenue (Million) Forecast, by Application 2019 & 2032
- Table 88: Canada Cooling Fabrics Industry Volume (K Tons) Forecast, by Application 2019 & 2032
- Table 89: Mexico Cooling Fabrics Industry Revenue (Million) Forecast, by Application 2019 & 2032
- Table 90: Mexico Cooling Fabrics Industry Volume (K Tons) Forecast, by Application 2019 & 2032
- Table 91: Global Cooling Fabrics Industry Revenue Million Forecast, by Type 2019 & 2032
- Table 92: Global Cooling Fabrics Industry Volume K Tons Forecast, by Type 2019 & 2032
- Table 93: Global Cooling Fabrics Industry Revenue Million Forecast, by Fabric Type 2019 & 2032
- Table 94: Global Cooling Fabrics Industry Volume K Tons Forecast, by Fabric Type 2019 & 2032
- Table 95: Global Cooling Fabrics Industry Revenue Million Forecast, by Application 2019 & 2032
- Table 96: Global Cooling Fabrics Industry Volume K Tons Forecast, by Application 2019 & 2032
- Table 97: Global Cooling Fabrics Industry Revenue Million Forecast, by Country 2019 & 2032
- Table 98: Global Cooling Fabrics Industry Volume K Tons Forecast, by Country 2019 & 2032
- Table 99: Germany Cooling Fabrics Industry Revenue (Million) Forecast, by Application 2019 & 2032
- Table 100: Germany Cooling Fabrics Industry Volume (K Tons) Forecast, by Application 2019 & 2032
- Table 101: United Kingdom Cooling Fabrics Industry Revenue (Million) Forecast, by Application 2019 & 2032
- Table 102: United Kingdom Cooling Fabrics Industry Volume (K Tons) Forecast, by Application 2019 & 2032
- Table 103: Italy Cooling Fabrics Industry Revenue (Million) Forecast, by Application 2019 & 2032
- Table 104: Italy Cooling Fabrics Industry Volume (K Tons) Forecast, by Application 2019 & 2032
- Table 105: France Cooling Fabrics Industry Revenue (Million) Forecast, by Application 2019 & 2032
- Table 106: France Cooling Fabrics Industry Volume (K Tons) Forecast, by Application 2019 & 2032
- Table 107: Rest of Europe Cooling Fabrics Industry Revenue (Million) Forecast, by Application 2019 & 2032
- Table 108: Rest of Europe Cooling Fabrics Industry Volume (K Tons) Forecast, by Application 2019 & 2032
- Table 109: Global Cooling Fabrics Industry Revenue Million Forecast, by Type 2019 & 2032
- Table 110: Global Cooling Fabrics Industry Volume K Tons Forecast, by Type 2019 & 2032
- Table 111: Global Cooling Fabrics Industry Revenue Million Forecast, by Fabric Type 2019 & 2032
- Table 112: Global Cooling Fabrics Industry Volume K Tons Forecast, by Fabric Type 2019 & 2032
- Table 113: Global Cooling Fabrics Industry Revenue Million Forecast, by Application 2019 & 2032
- Table 114: Global Cooling Fabrics Industry Volume K Tons Forecast, by Application 2019 & 2032
- Table 115: Global Cooling Fabrics Industry Revenue Million Forecast, by Country 2019 & 2032
- Table 116: Global Cooling Fabrics Industry Volume K Tons Forecast, by Country 2019 & 2032
- Table 117: Brazil Cooling Fabrics Industry Revenue (Million) Forecast, by Application 2019 & 2032
- Table 118: Brazil Cooling Fabrics Industry Volume (K Tons) Forecast, by Application 2019 & 2032
- Table 119: Argentina Cooling Fabrics Industry Revenue (Million) Forecast, by Application 2019 & 2032
- Table 120: Argentina Cooling Fabrics Industry Volume (K Tons) Forecast, by Application 2019 & 2032
- Table 121: Rest of South America Cooling Fabrics Industry Revenue (Million) Forecast, by Application 2019 & 2032
- Table 122: Rest of South America Cooling Fabrics Industry Volume (K Tons) Forecast, by Application 2019 & 2032
- Table 123: Global Cooling Fabrics Industry Revenue Million Forecast, by Type 2019 & 2032
- Table 124: Global Cooling Fabrics Industry Volume K Tons Forecast, by Type 2019 & 2032
- Table 125: Global Cooling Fabrics Industry Revenue Million Forecast, by Fabric Type 2019 & 2032
- Table 126: Global Cooling Fabrics Industry Volume K Tons Forecast, by Fabric Type 2019 & 2032
- Table 127: Global Cooling Fabrics Industry Revenue Million Forecast, by Application 2019 & 2032
- Table 128: Global Cooling Fabrics Industry Volume K Tons Forecast, by Application 2019 & 2032
- Table 129: Global Cooling Fabrics Industry Revenue Million Forecast, by Country 2019 & 2032
- Table 130: Global Cooling Fabrics Industry Volume K Tons Forecast, by Country 2019 & 2032
- Table 131: Saudi Arabia Cooling Fabrics Industry Revenue (Million) Forecast, by Application 2019 & 2032
- Table 132: Saudi Arabia Cooling Fabrics Industry Volume (K Tons) Forecast, by Application 2019 & 2032
- Table 133: South Africa Cooling Fabrics Industry Revenue (Million) Forecast, by Application 2019 & 2032
- Table 134: South Africa Cooling Fabrics Industry Volume (K Tons) Forecast, by Application 2019 & 2032
- Table 135: Rest of Middle East and Africa Cooling Fabrics Industry Revenue (Million) Forecast, by Application 2019 & 2032
- Table 136: Rest of Middle East and Africa Cooling Fabrics Industry Volume (K Tons) Forecast, by Application 2019 & 2032
Frequently Asked Questions
1. What is the projected Compound Annual Growth Rate (CAGR) of the Cooling Fabrics Industry?
The projected CAGR is approximately 7.21%.
2. Which companies are prominent players in the Cooling Fabrics Industry?
Key companies in the market include Everest Textile Co Ltd, Asahi Kasei Corporation, HeiQ Materials AG, Polartec, Columbia Sportswear Company, Formosa Taffeta Co Ltd, NILIT, Coolcore, NAN YA PLASTICS CORPORATION, Burlington, Wilson Fabrics, Balavigna Weaving Mills Pvt Ltd.
3. What are the main segments of the Cooling Fabrics Industry?
The market segments include Type, Fabric Type, Application.
4. Can you provide details about the market size?
The market size is estimated to be USD 2.42 Million as of 2022.
5. What are some drivers contributing to market growth?
Growing Demand for Synthetic Fabrics; Increasing Demand for Sportwear Fabrics; Other Drivers.
6. What are the notable trends driving market growth?
Increasing Demand from Sportswear Application.
7. Are there any restraints impacting market growth?
High Cost of Cooling Fabrics; Other Restraints.
8. Can you provide examples of recent developments in the market?
January 2023: NILIT launched a new version of SENSIL EcoCare recycled Nylon 6.6 manufactured completely from US materials at its North American facility in Martinsville, VA.
9. What pricing options are available for accessing the report?
Pricing options include single-user, multi-user, and enterprise licenses priced at USD 4750, USD 5250, and USD 8750 respectively.
10. Is the market size provided in terms of value or volume?
The market size is provided in terms of value, measured in Million and volume, measured in K Tons.
11. Are there any specific market keywords associated with the report?
Yes, the market keyword associated with the report is "Cooling Fabrics Industry," which aids in identifying and referencing the specific market segment covered.
12. How do I determine which pricing option suits my needs best?
The pricing options vary based on user requirements and access needs. Individual users may opt for single-user licenses, while businesses requiring broader access may choose multi-user or enterprise licenses for cost-effective access to the report.
13. Are there any additional resources or data provided in the Cooling Fabrics Industry report?
While the report offers comprehensive insights, it's advisable to review the specific contents or supplementary materials provided to ascertain if additional resources or data are available.
14. How can I stay updated on further developments or reports in the Cooling Fabrics Industry?
To stay informed about further developments, trends, and reports in the Cooling Fabrics Industry, consider subscribing to industry newsletters, following relevant companies and organizations, or regularly checking reputable industry news sources and publications.
Methodology
Step 1 - Identification of Relevant Samples Size from Population Database


Step 2 - Approaches for Defining Global Market Size (Value, Volume* & Price*)

Note*: In applicable scenarios
Step 3 - Data Sources
Primary Research
- Web Analytics
- Survey Reports
- Research Institute
- Latest Research Reports
- Opinion Leaders
Secondary Research
- Annual Reports
- White Paper
- Latest Press Release
- Industry Association
- Paid Database
- Investor Presentations

Step 4 - Data Triangulation
Involves using different sources of information in order to increase the validity of a study
These sources are likely to be stakeholders in a program - participants, other researchers, program staff, other community members, and so on.
Then we put all data in single framework & apply various statistical tools to find out the dynamic on the market.
During the analysis stage, feedback from the stakeholder groups would be compared to determine areas of agreement as well as areas of divergence


