Key Insights
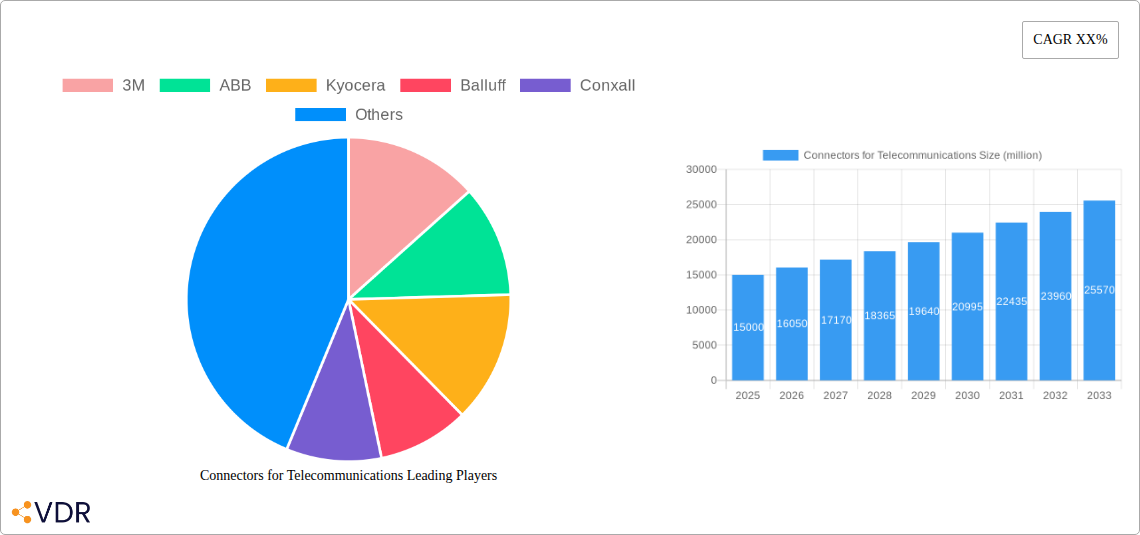
The telecommunications connectors market is experiencing robust growth, driven by the expanding global telecommunications infrastructure and the increasing demand for high-speed data transmission. The market, estimated at $15 billion in 2025, is projected to maintain a healthy Compound Annual Growth Rate (CAGR) of 7% from 2025 to 2033, reaching an estimated $25 billion by 2033. Key drivers include the widespread adoption of 5G technology, the growth of cloud computing and data centers, and the increasing reliance on connected devices. Trends such as miniaturization, the development of high-speed connectors, and the integration of advanced functionalities (like power over data lines) are shaping market dynamics. While challenges exist, such as supply chain disruptions and the potential for price volatility in raw materials, the overall market outlook remains positive due to the continuous expansion of global internet penetration and the ongoing need for improved connectivity solutions. Major players like 3M, ABB, and TE Connectivity are investing heavily in research and development, leading to innovative product offerings and enhancing their market positions. Segmentation within the market is significant, with variations in connector types (fiber optic, coaxial, etc.) and applications within telecom infrastructure (base stations, data centers, etc.).
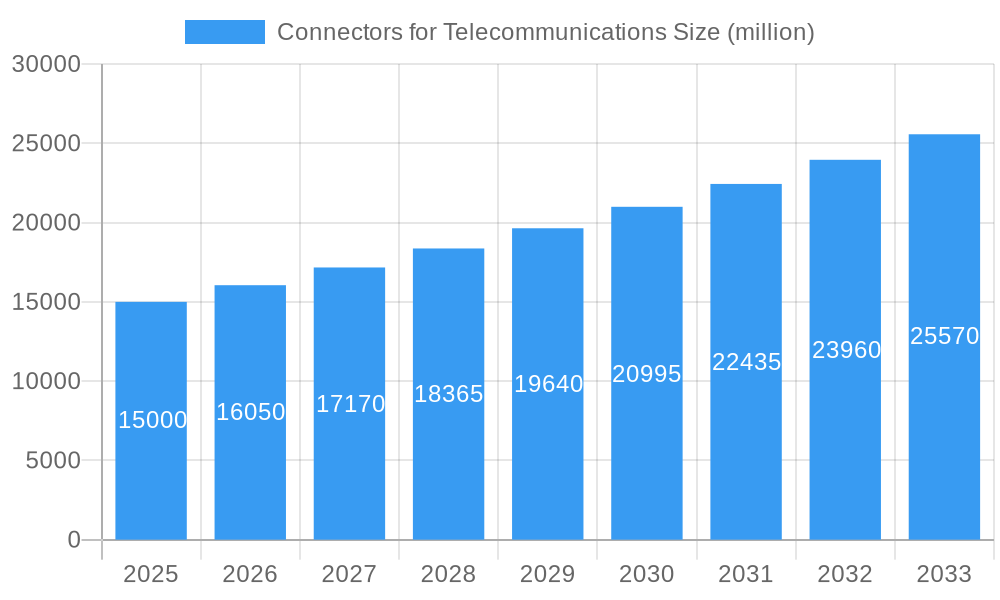
Connectors for Telecommunications Market Size (In Billion)
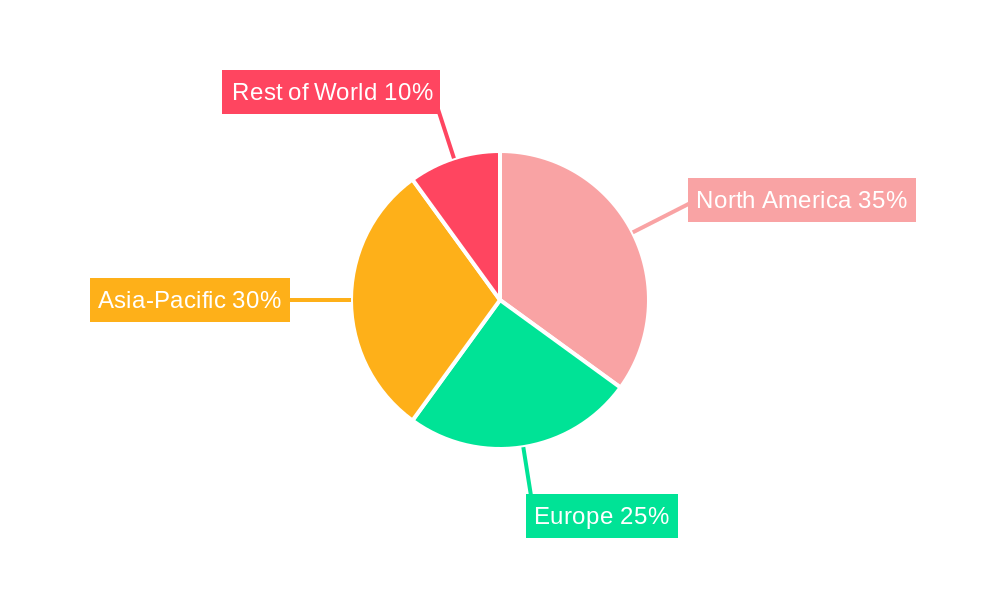
The competitive landscape is intense, with numerous established players and emerging companies vying for market share. Strategic partnerships and mergers and acquisitions are prevalent strategies to gain a competitive edge. Regional variations exist, with North America and Asia-Pacific expected to be significant contributors to market growth, driven by factors like robust technological advancements and significant investments in network infrastructure. Europe and other regions will also witness considerable growth, although at potentially slightly slower paces. The forecast period considers potential future disruptions, such as economic downturns and technological shifts, and projects a conservative yet optimistic growth trajectory for the telecommunications connectors market, highlighting its continued relevance in the ever-evolving digital landscape.
Connectors for Telecommunications Company Market Share
This comprehensive report provides an in-depth analysis of the Connectors for Telecommunications market, encompassing market dynamics, growth trends, regional segmentation, product landscape, key players, and future outlook. The study period spans from 2019 to 2033, with 2025 serving as the base and estimated year. The forecast period covers 2025-2033, and the historical period encompasses 2019-2024. The report analyzes the parent market of Electronic Components and the child market of Telecommunication Connectors, providing a granular view of market size (in million units) and key trends.
Parent Market: Electronic Components Child Market: Telecommunication Connectors
Connectors for Telecommunications Market Dynamics & Structure
This section analyzes the competitive landscape of the telecommunications connectors market, exploring market concentration, technological advancements, regulatory influences, and industry trends. The report quantifies market share among key players and examines the impact of mergers and acquisitions (M&A) activity. Qualitative aspects, such as barriers to innovation and emerging technological disruptions, are also explored.
- Market Concentration: The market exhibits a moderately concentrated structure with the top 5 players holding approximately xx% market share in 2025.
- Technological Innovation: 5G deployment and the rise of fiber optics are key drivers, pushing demand for high-speed, reliable connectors.
- Regulatory Framework: Government regulations concerning data security and network reliability impact connector standards and adoption.
- Competitive Substitutes: Wireless technologies pose a competitive threat, while advancements in connector technology offer performance improvements.
- M&A Activity: The past five years witnessed xx M&A deals, primarily driven by companies seeking to expand their product portfolio and market reach. These deals have resulted in a xx% increase in market consolidation.
- End-user Demographics: The growth is largely fueled by the increasing adoption of telecommunication services across residential and enterprise sectors, particularly in developing economies.
Connectors for Telecommunications Growth Trends & Insights
This section offers a detailed analysis of market size evolution, adoption rates, technological disruptions, and changing consumer behavior. Leveraging advanced analytical techniques, the report provides precise figures on Compound Annual Growth Rate (CAGR) and market penetration rates. The analysis incorporates the impact of technological advancements, such as the expansion of 5G networks, and evolving consumer preferences for high-bandwidth connectivity.
- Market Size Evolution: The market size increased from xx million units in 2019 to xx million units in 2024, projecting a further growth to xx million units by 2033.
- CAGR (2025-2033): The market is expected to experience a CAGR of xx% during the forecast period.
- Market Penetration: Market penetration in key regions is analyzed, highlighting areas with significant growth potential.
- Technological Disruptions: The impact of emerging technologies like IoT and AI on connector demand is assessed.
Dominant Regions, Countries, or Segments in Connectors for Telecommunications
This section identifies leading regions, countries, and market segments driving growth. Analysis includes key drivers such as economic policies, infrastructure development, and technological advancements. The report offers insights into market share and growth potential for each region, enabling informed strategic decision-making.
- Dominant Region: North America is projected to hold the largest market share in 2025, driven by robust 5G infrastructure development and strong demand from the telecommunications sector.
- Key Drivers: Government investments in digital infrastructure, rising smartphone penetration, and the increasing adoption of cloud-based services are key growth drivers.
- Growth Potential: Asia-Pacific is poised for significant growth due to expanding telecommunication networks and rising disposable incomes.
Connectors for Telecommunications Product Landscape
This section details product innovations, applications, and performance metrics. It highlights the unique selling propositions (USPs) of various connectors and showcases technological advancements driving market evolution. The emphasis is on advancements in materials, miniaturization, and increased bandwidth capacity. Specific examples of innovative connector types and their applications are discussed.
Key Drivers, Barriers & Challenges in Connectors for Telecommunications
This section outlines the primary growth drivers and challenges faced by the telecommunications connectors market. It covers technological, economic, and policy-related factors. Supply chain disruptions, regulatory hurdles, and competitive pressures are analyzed, along with their quantifiable impacts on market growth.
- Key Drivers: 5G expansion, IoT growth, and rising demand for high-speed data transmission.
- Challenges: Supply chain vulnerabilities, fluctuating raw material prices, and intense competition.
Emerging Opportunities in Connectors for Telecommunications
This section highlights emerging trends and opportunities, including untapped markets, innovative applications, and evolving consumer preferences. Specific examples of emerging applications in areas like autonomous vehicles and industrial automation are explored.
- Untapped Markets: Expansion into developing economies presents significant growth opportunities.
- Innovative Applications: The integration of connectors in new technologies like augmented and virtual reality holds immense potential.
Growth Accelerators in the Connectors for Telecommunications Industry
This section discusses catalysts driving long-term market growth, emphasizing technological breakthroughs, strategic partnerships, and market expansion strategies. The focus is on long-term market potential and sustainable growth drivers.
- Technological Advancements: Advancements in materials science and miniaturization technologies drive product innovation and efficiency gains.
Key Players Shaping the Connectors for Telecommunications Market
Notable Milestones in Connectors for Telecommunications Sector
- 2020: Introduction of a new high-speed connector by Molex, increasing data transfer rates by xx%.
- 2022: Strategic partnership between TE Connectivity and a major telecommunications provider to develop customized connectors for 5G infrastructure.
- 2023: Acquisition of a smaller connector manufacturer by Siemens, expanding their product portfolio.
- 2024: Launch of a new miniaturized connector by JAE Electronics, improving space efficiency in mobile devices.
In-Depth Connectors for Telecommunications Market Outlook
The telecommunications connectors market is poised for sustained growth driven by ongoing 5G deployments, the proliferation of IoT devices, and the increasing demand for high-bandwidth connectivity. Strategic partnerships and technological innovations will play a key role in shaping the market landscape. The focus on miniaturization, enhanced performance, and improved reliability will remain paramount. The market presents significant opportunities for established players and new entrants alike, particularly in the rapidly expanding sectors of 5G infrastructure and smart devices.
Connectors for Telecommunications Segmentation
-
1. Application
- 1.1. General Communications
- 1.2. Industrial Automation
- 1.3. Military
- 1.4. Others
-
2. Types
- 2.1. CAT3
- 2.2. CAT4
- 2.3. CAT5
- 2.4. CAT6
- 2.5. Others
Connectors for Telecommunications Segmentation By Geography
-
1. North America
- 1.1. United States
- 1.2. Canada
- 1.3. Mexico
-
2. South America
- 2.1. Brazil
- 2.2. Argentina
- 2.3. Rest of South America
-
3. Europe
- 3.1. United Kingdom
- 3.2. Germany
- 3.3. France
- 3.4. Italy
- 3.5. Spain
- 3.6. Russia
- 3.7. Benelux
- 3.8. Nordics
- 3.9. Rest of Europe
-
4. Middle East & Africa
- 4.1. Turkey
- 4.2. Israel
- 4.3. GCC
- 4.4. North Africa
- 4.5. South Africa
- 4.6. Rest of Middle East & Africa
-
5. Asia Pacific
- 5.1. China
- 5.2. India
- 5.3. Japan
- 5.4. South Korea
- 5.5. ASEAN
- 5.6. Oceania
- 5.7. Rest of Asia Pacific
Connectors for Telecommunications Regional Market Share
Geographic Coverage of Connectors for Telecommunications
Connectors for Telecommunications REPORT HIGHLIGHTS
| Aspects | Details |
|---|---|
| Study Period | 2020-2034 |
| Base Year | 2025 |
| Estimated Year | 2026 |
| Forecast Period | 2026-2034 |
| Historical Period | 2020-2025 |
| Growth Rate | CAGR of 7.7% from 2020-2034 |
| Segmentation |
|
Table of Contents
- 1. Introduction
- 1.1. Research Scope
- 1.2. Market Segmentation
- 1.3. Research Objective
- 1.4. Definitions and Assumptions
- 2. Executive Summary
- 2.1. Market Snapshot
- 3. Market Dynamics
- 3.1. Market Drivers
- 3.2. Market Restrains
- 3.3. Market Trends
- 3.4. Market Opportunities
- 4. Market Factor Analysis
- 4.1. Porters Five Forces
- 4.1.1. Bargaining Power of Suppliers
- 4.1.2. Bargaining Power of Buyers
- 4.1.3. Threat of New Entrants
- 4.1.4. Threat of Substitutes
- 4.1.5. Competitive Rivalry
- 4.2. PESTEL analysis
- 4.3. BCG Analysis
- 4.3.1. Stars (High Growth, High Market Share)
- 4.3.2. Cash Cows (Low Growth, High Market Share)
- 4.3.3. Question Mark (High Growth, Low Market Share)
- 4.3.4. Dogs (Low Growth, Low Market Share)
- 4.4. Ansoff Matrix Analysis
- 4.5. Supply Chain Analysis
- 4.6. Regulatory Landscape
- 4.7. Current Market Potential and Opportunity Assessment (TAM–SAM–SOM Framework)
- 4.8. VDR Analyst Note
- 4.1. Porters Five Forces
- 5. Market Analysis, Insights and Forecast 2021-2033
- 5.1. Market Analysis, Insights and Forecast - by Application
- 5.1.1. General Communications
- 5.1.2. Industrial Automation
- 5.1.3. Military
- 5.1.4. Others
- 5.2. Market Analysis, Insights and Forecast - by Types
- 5.2.1. CAT3
- 5.2.2. CAT4
- 5.2.3. CAT5
- 5.2.4. CAT6
- 5.2.5. Others
- 5.3. Market Analysis, Insights and Forecast - by Region
- 5.3.1. North America
- 5.3.2. South America
- 5.3.3. Europe
- 5.3.4. Middle East & Africa
- 5.3.5. Asia Pacific
- 5.1. Market Analysis, Insights and Forecast - by Application
- 6. Global Connectors for Telecommunications Analysis, Insights and Forecast, 2021-2033
- 6.1. Market Analysis, Insights and Forecast - by Application
- 6.1.1. General Communications
- 6.1.2. Industrial Automation
- 6.1.3. Military
- 6.1.4. Others
- 6.2. Market Analysis, Insights and Forecast - by Types
- 6.2.1. CAT3
- 6.2.2. CAT4
- 6.2.3. CAT5
- 6.2.4. CAT6
- 6.2.5. Others
- 6.1. Market Analysis, Insights and Forecast - by Application
- 7. North America Connectors for Telecommunications Analysis, Insights and Forecast, 2021-2033
- 7.1. Market Analysis, Insights and Forecast - by Application
- 7.1.1. General Communications
- 7.1.2. Industrial Automation
- 7.1.3. Military
- 7.1.4. Others
- 7.2. Market Analysis, Insights and Forecast - by Types
- 7.2.1. CAT3
- 7.2.2. CAT4
- 7.2.3. CAT5
- 7.2.4. CAT6
- 7.2.5. Others
- 7.1. Market Analysis, Insights and Forecast - by Application
- 8. South America Connectors for Telecommunications Analysis, Insights and Forecast, 2021-2033
- 8.1. Market Analysis, Insights and Forecast - by Application
- 8.1.1. General Communications
- 8.1.2. Industrial Automation
- 8.1.3. Military
- 8.1.4. Others
- 8.2. Market Analysis, Insights and Forecast - by Types
- 8.2.1. CAT3
- 8.2.2. CAT4
- 8.2.3. CAT5
- 8.2.4. CAT6
- 8.2.5. Others
- 8.1. Market Analysis, Insights and Forecast - by Application
- 9. Europe Connectors for Telecommunications Analysis, Insights and Forecast, 2021-2033
- 9.1. Market Analysis, Insights and Forecast - by Application
- 9.1.1. General Communications
- 9.1.2. Industrial Automation
- 9.1.3. Military
- 9.1.4. Others
- 9.2. Market Analysis, Insights and Forecast - by Types
- 9.2.1. CAT3
- 9.2.2. CAT4
- 9.2.3. CAT5
- 9.2.4. CAT6
- 9.2.5. Others
- 9.1. Market Analysis, Insights and Forecast - by Application
- 10. Middle East & Africa Connectors for Telecommunications Analysis, Insights and Forecast, 2021-2033
- 10.1. Market Analysis, Insights and Forecast - by Application
- 10.1.1. General Communications
- 10.1.2. Industrial Automation
- 10.1.3. Military
- 10.1.4. Others
- 10.2. Market Analysis, Insights and Forecast - by Types
- 10.2.1. CAT3
- 10.2.2. CAT4
- 10.2.3. CAT5
- 10.2.4. CAT6
- 10.2.5. Others
- 10.1. Market Analysis, Insights and Forecast - by Application
- 11. Asia Pacific Connectors for Telecommunications Analysis, Insights and Forecast, 2021-2033
- 11.1. Market Analysis, Insights and Forecast - by Application
- 11.1.1. General Communications
- 11.1.2. Industrial Automation
- 11.1.3. Military
- 11.1.4. Others
- 11.2. Market Analysis, Insights and Forecast - by Types
- 11.2.1. CAT3
- 11.2.2. CAT4
- 11.2.3. CAT5
- 11.2.4. CAT6
- 11.2.5. Others
- 11.1. Market Analysis, Insights and Forecast - by Application
- 12. Competitive Analysis
- 12.1. Company Profiles
- 12.1.1 3M
- 12.1.1.1. Company Overview
- 12.1.1.2. Products
- 12.1.1.3. Company Financials
- 12.1.1.4. SWOT Analysis
- 12.1.2 ABB
- 12.1.2.1. Company Overview
- 12.1.2.2. Products
- 12.1.2.3. Company Financials
- 12.1.2.4. SWOT Analysis
- 12.1.3 Kyocera
- 12.1.3.1. Company Overview
- 12.1.3.2. Products
- 12.1.3.3. Company Financials
- 12.1.3.4. SWOT Analysis
- 12.1.4 Balluff
- 12.1.4.1. Company Overview
- 12.1.4.2. Products
- 12.1.4.3. Company Financials
- 12.1.4.4. SWOT Analysis
- 12.1.5 Conxall
- 12.1.5.1. Company Overview
- 12.1.5.2. Products
- 12.1.5.3. Company Financials
- 12.1.5.4. SWOT Analysis
- 12.1.6 Bulgin
- 12.1.6.1. Company Overview
- 12.1.6.2. Products
- 12.1.6.3. Company Financials
- 12.1.6.4. SWOT Analysis
- 12.1.7 Eaton
- 12.1.7.1. Company Overview
- 12.1.7.2. Products
- 12.1.7.3. Company Financials
- 12.1.7.4. SWOT Analysis
- 12.1.8 Harting
- 12.1.8.1. Company Overview
- 12.1.8.2. Products
- 12.1.8.3. Company Financials
- 12.1.8.4. SWOT Analysis
- 12.1.9 Hubbell
- 12.1.9.1. Company Overview
- 12.1.9.2. Products
- 12.1.9.3. Company Financials
- 12.1.9.4. SWOT Analysis
- 12.1.10 IDEC Corporation
- 12.1.10.1. Company Overview
- 12.1.10.2. Products
- 12.1.10.3. Company Financials
- 12.1.10.4. SWOT Analysis
- 12.1.11 JAE Electronics
- 12.1.11.1. Company Overview
- 12.1.11.2. Products
- 12.1.11.3. Company Financials
- 12.1.11.4. SWOT Analysis
- 12.1.12 LAPP
- 12.1.12.1. Company Overview
- 12.1.12.2. Products
- 12.1.12.3. Company Financials
- 12.1.12.4. SWOT Analysis
- 12.1.13 Keystone Electronics
- 12.1.13.1. Company Overview
- 12.1.13.2. Products
- 12.1.13.3. Company Financials
- 12.1.13.4. SWOT Analysis
- 12.1.14 Leviton
- 12.1.14.1. Company Overview
- 12.1.14.2. Products
- 12.1.14.3. Company Financials
- 12.1.14.4. SWOT Analysis
- 12.1.15 Lumberg
- 12.1.15.1. Company Overview
- 12.1.15.2. Products
- 12.1.15.3. Company Financials
- 12.1.15.4. SWOT Analysis
- 12.1.16 Molex
- 12.1.16.1. Company Overview
- 12.1.16.2. Products
- 12.1.16.3. Company Financials
- 12.1.16.4. SWOT Analysis
- 12.1.17 Neutrik
- 12.1.17.1. Company Overview
- 12.1.17.2. Products
- 12.1.17.3. Company Financials
- 12.1.17.4. SWOT Analysis
- 12.1.18 MOXA
- 12.1.18.1. Company Overview
- 12.1.18.2. Products
- 12.1.18.3. Company Financials
- 12.1.18.4. SWOT Analysis
- 12.1.19 Omron
- 12.1.19.1. Company Overview
- 12.1.19.2. Products
- 12.1.19.3. Company Financials
- 12.1.19.4. SWOT Analysis
- 12.1.20 Panduit
- 12.1.20.1. Company Overview
- 12.1.20.2. Products
- 12.1.20.3. Company Financials
- 12.1.20.4. SWOT Analysis
- 12.1.21 Phoenix Contact
- 12.1.21.1. Company Overview
- 12.1.21.2. Products
- 12.1.21.3. Company Financials
- 12.1.21.4. SWOT Analysis
- 12.1.22 Siemens
- 12.1.22.1. Company Overview
- 12.1.22.2. Products
- 12.1.22.3. Company Financials
- 12.1.22.4. SWOT Analysis
- 12.1.23 TE Connectivity
- 12.1.23.1. Company Overview
- 12.1.23.2. Products
- 12.1.23.3. Company Financials
- 12.1.23.4. SWOT Analysis
- 12.1.24 Truck
- 12.1.24.1. Company Overview
- 12.1.24.2. Products
- 12.1.24.3. Company Financials
- 12.1.24.4. SWOT Analysis
- 12.1.25 Belden
- 12.1.25.1. Company Overview
- 12.1.25.2. Products
- 12.1.25.3. Company Financials
- 12.1.25.4. SWOT Analysis
- 12.1.26 Murrelektronik
- 12.1.26.1. Company Overview
- 12.1.26.2. Products
- 12.1.26.3. Company Financials
- 12.1.26.4. SWOT Analysis
- 12.1.1 3M
- 12.2. Market Entropy
- 12.2.1 Company's Key Areas Served
- 12.2.2 Recent Developments
- 12.3. Company Market Share Analysis 2025
- 12.3.1 Top 5 Companies Market Share Analysis
- 12.3.2 Top 3 Companies Market Share Analysis
- 12.4. List of Potential Customers
- 13. Research Methodology
List of Figures
- Figure 1: Global Connectors for Telecommunications Revenue Breakdown (undefined, %) by Region 2025 & 2033
- Figure 2: Global Connectors for Telecommunications Volume Breakdown (K, %) by Region 2025 & 2033
- Figure 3: North America Connectors for Telecommunications Revenue (undefined), by Application 2025 & 2033
- Figure 4: North America Connectors for Telecommunications Volume (K), by Application 2025 & 2033
- Figure 5: North America Connectors for Telecommunications Revenue Share (%), by Application 2025 & 2033
- Figure 6: North America Connectors for Telecommunications Volume Share (%), by Application 2025 & 2033
- Figure 7: North America Connectors for Telecommunications Revenue (undefined), by Types 2025 & 2033
- Figure 8: North America Connectors for Telecommunications Volume (K), by Types 2025 & 2033
- Figure 9: North America Connectors for Telecommunications Revenue Share (%), by Types 2025 & 2033
- Figure 10: North America Connectors for Telecommunications Volume Share (%), by Types 2025 & 2033
- Figure 11: North America Connectors for Telecommunications Revenue (undefined), by Country 2025 & 2033
- Figure 12: North America Connectors for Telecommunications Volume (K), by Country 2025 & 2033
- Figure 13: North America Connectors for Telecommunications Revenue Share (%), by Country 2025 & 2033
- Figure 14: North America Connectors for Telecommunications Volume Share (%), by Country 2025 & 2033
- Figure 15: South America Connectors for Telecommunications Revenue (undefined), by Application 2025 & 2033
- Figure 16: South America Connectors for Telecommunications Volume (K), by Application 2025 & 2033
- Figure 17: South America Connectors for Telecommunications Revenue Share (%), by Application 2025 & 2033
- Figure 18: South America Connectors for Telecommunications Volume Share (%), by Application 2025 & 2033
- Figure 19: South America Connectors for Telecommunications Revenue (undefined), by Types 2025 & 2033
- Figure 20: South America Connectors for Telecommunications Volume (K), by Types 2025 & 2033
- Figure 21: South America Connectors for Telecommunications Revenue Share (%), by Types 2025 & 2033
- Figure 22: South America Connectors for Telecommunications Volume Share (%), by Types 2025 & 2033
- Figure 23: South America Connectors for Telecommunications Revenue (undefined), by Country 2025 & 2033
- Figure 24: South America Connectors for Telecommunications Volume (K), by Country 2025 & 2033
- Figure 25: South America Connectors for Telecommunications Revenue Share (%), by Country 2025 & 2033
- Figure 26: South America Connectors for Telecommunications Volume Share (%), by Country 2025 & 2033
- Figure 27: Europe Connectors for Telecommunications Revenue (undefined), by Application 2025 & 2033
- Figure 28: Europe Connectors for Telecommunications Volume (K), by Application 2025 & 2033
- Figure 29: Europe Connectors for Telecommunications Revenue Share (%), by Application 2025 & 2033
- Figure 30: Europe Connectors for Telecommunications Volume Share (%), by Application 2025 & 2033
- Figure 31: Europe Connectors for Telecommunications Revenue (undefined), by Types 2025 & 2033
- Figure 32: Europe Connectors for Telecommunications Volume (K), by Types 2025 & 2033
- Figure 33: Europe Connectors for Telecommunications Revenue Share (%), by Types 2025 & 2033
- Figure 34: Europe Connectors for Telecommunications Volume Share (%), by Types 2025 & 2033
- Figure 35: Europe Connectors for Telecommunications Revenue (undefined), by Country 2025 & 2033
- Figure 36: Europe Connectors for Telecommunications Volume (K), by Country 2025 & 2033
- Figure 37: Europe Connectors for Telecommunications Revenue Share (%), by Country 2025 & 2033
- Figure 38: Europe Connectors for Telecommunications Volume Share (%), by Country 2025 & 2033
- Figure 39: Middle East & Africa Connectors for Telecommunications Revenue (undefined), by Application 2025 & 2033
- Figure 40: Middle East & Africa Connectors for Telecommunications Volume (K), by Application 2025 & 2033
- Figure 41: Middle East & Africa Connectors for Telecommunications Revenue Share (%), by Application 2025 & 2033
- Figure 42: Middle East & Africa Connectors for Telecommunications Volume Share (%), by Application 2025 & 2033
- Figure 43: Middle East & Africa Connectors for Telecommunications Revenue (undefined), by Types 2025 & 2033
- Figure 44: Middle East & Africa Connectors for Telecommunications Volume (K), by Types 2025 & 2033
- Figure 45: Middle East & Africa Connectors for Telecommunications Revenue Share (%), by Types 2025 & 2033
- Figure 46: Middle East & Africa Connectors for Telecommunications Volume Share (%), by Types 2025 & 2033
- Figure 47: Middle East & Africa Connectors for Telecommunications Revenue (undefined), by Country 2025 & 2033
- Figure 48: Middle East & Africa Connectors for Telecommunications Volume (K), by Country 2025 & 2033
- Figure 49: Middle East & Africa Connectors for Telecommunications Revenue Share (%), by Country 2025 & 2033
- Figure 50: Middle East & Africa Connectors for Telecommunications Volume Share (%), by Country 2025 & 2033
- Figure 51: Asia Pacific Connectors for Telecommunications Revenue (undefined), by Application 2025 & 2033
- Figure 52: Asia Pacific Connectors for Telecommunications Volume (K), by Application 2025 & 2033
- Figure 53: Asia Pacific Connectors for Telecommunications Revenue Share (%), by Application 2025 & 2033
- Figure 54: Asia Pacific Connectors for Telecommunications Volume Share (%), by Application 2025 & 2033
- Figure 55: Asia Pacific Connectors for Telecommunications Revenue (undefined), by Types 2025 & 2033
- Figure 56: Asia Pacific Connectors for Telecommunications Volume (K), by Types 2025 & 2033
- Figure 57: Asia Pacific Connectors for Telecommunications Revenue Share (%), by Types 2025 & 2033
- Figure 58: Asia Pacific Connectors for Telecommunications Volume Share (%), by Types 2025 & 2033
- Figure 59: Asia Pacific Connectors for Telecommunications Revenue (undefined), by Country 2025 & 2033
- Figure 60: Asia Pacific Connectors for Telecommunications Volume (K), by Country 2025 & 2033
- Figure 61: Asia Pacific Connectors for Telecommunications Revenue Share (%), by Country 2025 & 2033
- Figure 62: Asia Pacific Connectors for Telecommunications Volume Share (%), by Country 2025 & 2033
List of Tables
- Table 1: Global Connectors for Telecommunications Revenue undefined Forecast, by Application 2020 & 2033
- Table 2: Global Connectors for Telecommunications Volume K Forecast, by Application 2020 & 2033
- Table 3: Global Connectors for Telecommunications Revenue undefined Forecast, by Types 2020 & 2033
- Table 4: Global Connectors for Telecommunications Volume K Forecast, by Types 2020 & 2033
- Table 5: Global Connectors for Telecommunications Revenue undefined Forecast, by Region 2020 & 2033
- Table 6: Global Connectors for Telecommunications Volume K Forecast, by Region 2020 & 2033
- Table 7: Global Connectors for Telecommunications Revenue undefined Forecast, by Application 2020 & 2033
- Table 8: Global Connectors for Telecommunications Volume K Forecast, by Application 2020 & 2033
- Table 9: Global Connectors for Telecommunications Revenue undefined Forecast, by Types 2020 & 2033
- Table 10: Global Connectors for Telecommunications Volume K Forecast, by Types 2020 & 2033
- Table 11: Global Connectors for Telecommunications Revenue undefined Forecast, by Country 2020 & 2033
- Table 12: Global Connectors for Telecommunications Volume K Forecast, by Country 2020 & 2033
- Table 13: United States Connectors for Telecommunications Revenue (undefined) Forecast, by Application 2020 & 2033
- Table 14: United States Connectors for Telecommunications Volume (K) Forecast, by Application 2020 & 2033
- Table 15: Canada Connectors for Telecommunications Revenue (undefined) Forecast, by Application 2020 & 2033
- Table 16: Canada Connectors for Telecommunications Volume (K) Forecast, by Application 2020 & 2033
- Table 17: Mexico Connectors for Telecommunications Revenue (undefined) Forecast, by Application 2020 & 2033
- Table 18: Mexico Connectors for Telecommunications Volume (K) Forecast, by Application 2020 & 2033
- Table 19: Global Connectors for Telecommunications Revenue undefined Forecast, by Application 2020 & 2033
- Table 20: Global Connectors for Telecommunications Volume K Forecast, by Application 2020 & 2033
- Table 21: Global Connectors for Telecommunications Revenue undefined Forecast, by Types 2020 & 2033
- Table 22: Global Connectors for Telecommunications Volume K Forecast, by Types 2020 & 2033
- Table 23: Global Connectors for Telecommunications Revenue undefined Forecast, by Country 2020 & 2033
- Table 24: Global Connectors for Telecommunications Volume K Forecast, by Country 2020 & 2033
- Table 25: Brazil Connectors for Telecommunications Revenue (undefined) Forecast, by Application 2020 & 2033
- Table 26: Brazil Connectors for Telecommunications Volume (K) Forecast, by Application 2020 & 2033
- Table 27: Argentina Connectors for Telecommunications Revenue (undefined) Forecast, by Application 2020 & 2033
- Table 28: Argentina Connectors for Telecommunications Volume (K) Forecast, by Application 2020 & 2033
- Table 29: Rest of South America Connectors for Telecommunications Revenue (undefined) Forecast, by Application 2020 & 2033
- Table 30: Rest of South America Connectors for Telecommunications Volume (K) Forecast, by Application 2020 & 2033
- Table 31: Global Connectors for Telecommunications Revenue undefined Forecast, by Application 2020 & 2033
- Table 32: Global Connectors for Telecommunications Volume K Forecast, by Application 2020 & 2033
- Table 33: Global Connectors for Telecommunications Revenue undefined Forecast, by Types 2020 & 2033
- Table 34: Global Connectors for Telecommunications Volume K Forecast, by Types 2020 & 2033
- Table 35: Global Connectors for Telecommunications Revenue undefined Forecast, by Country 2020 & 2033
- Table 36: Global Connectors for Telecommunications Volume K Forecast, by Country 2020 & 2033
- Table 37: United Kingdom Connectors for Telecommunications Revenue (undefined) Forecast, by Application 2020 & 2033
- Table 38: United Kingdom Connectors for Telecommunications Volume (K) Forecast, by Application 2020 & 2033
- Table 39: Germany Connectors for Telecommunications Revenue (undefined) Forecast, by Application 2020 & 2033
- Table 40: Germany Connectors for Telecommunications Volume (K) Forecast, by Application 2020 & 2033
- Table 41: France Connectors for Telecommunications Revenue (undefined) Forecast, by Application 2020 & 2033
- Table 42: France Connectors for Telecommunications Volume (K) Forecast, by Application 2020 & 2033
- Table 43: Italy Connectors for Telecommunications Revenue (undefined) Forecast, by Application 2020 & 2033
- Table 44: Italy Connectors for Telecommunications Volume (K) Forecast, by Application 2020 & 2033
- Table 45: Spain Connectors for Telecommunications Revenue (undefined) Forecast, by Application 2020 & 2033
- Table 46: Spain Connectors for Telecommunications Volume (K) Forecast, by Application 2020 & 2033
- Table 47: Russia Connectors for Telecommunications Revenue (undefined) Forecast, by Application 2020 & 2033
- Table 48: Russia Connectors for Telecommunications Volume (K) Forecast, by Application 2020 & 2033
- Table 49: Benelux Connectors for Telecommunications Revenue (undefined) Forecast, by Application 2020 & 2033
- Table 50: Benelux Connectors for Telecommunications Volume (K) Forecast, by Application 2020 & 2033
- Table 51: Nordics Connectors for Telecommunications Revenue (undefined) Forecast, by Application 2020 & 2033
- Table 52: Nordics Connectors for Telecommunications Volume (K) Forecast, by Application 2020 & 2033
- Table 53: Rest of Europe Connectors for Telecommunications Revenue (undefined) Forecast, by Application 2020 & 2033
- Table 54: Rest of Europe Connectors for Telecommunications Volume (K) Forecast, by Application 2020 & 2033
- Table 55: Global Connectors for Telecommunications Revenue undefined Forecast, by Application 2020 & 2033
- Table 56: Global Connectors for Telecommunications Volume K Forecast, by Application 2020 & 2033
- Table 57: Global Connectors for Telecommunications Revenue undefined Forecast, by Types 2020 & 2033
- Table 58: Global Connectors for Telecommunications Volume K Forecast, by Types 2020 & 2033
- Table 59: Global Connectors for Telecommunications Revenue undefined Forecast, by Country 2020 & 2033
- Table 60: Global Connectors for Telecommunications Volume K Forecast, by Country 2020 & 2033
- Table 61: Turkey Connectors for Telecommunications Revenue (undefined) Forecast, by Application 2020 & 2033
- Table 62: Turkey Connectors for Telecommunications Volume (K) Forecast, by Application 2020 & 2033
- Table 63: Israel Connectors for Telecommunications Revenue (undefined) Forecast, by Application 2020 & 2033
- Table 64: Israel Connectors for Telecommunications Volume (K) Forecast, by Application 2020 & 2033
- Table 65: GCC Connectors for Telecommunications Revenue (undefined) Forecast, by Application 2020 & 2033
- Table 66: GCC Connectors for Telecommunications Volume (K) Forecast, by Application 2020 & 2033
- Table 67: North Africa Connectors for Telecommunications Revenue (undefined) Forecast, by Application 2020 & 2033
- Table 68: North Africa Connectors for Telecommunications Volume (K) Forecast, by Application 2020 & 2033
- Table 69: South Africa Connectors for Telecommunications Revenue (undefined) Forecast, by Application 2020 & 2033
- Table 70: South Africa Connectors for Telecommunications Volume (K) Forecast, by Application 2020 & 2033
- Table 71: Rest of Middle East & Africa Connectors for Telecommunications Revenue (undefined) Forecast, by Application 2020 & 2033
- Table 72: Rest of Middle East & Africa Connectors for Telecommunications Volume (K) Forecast, by Application 2020 & 2033
- Table 73: Global Connectors for Telecommunications Revenue undefined Forecast, by Application 2020 & 2033
- Table 74: Global Connectors for Telecommunications Volume K Forecast, by Application 2020 & 2033
- Table 75: Global Connectors for Telecommunications Revenue undefined Forecast, by Types 2020 & 2033
- Table 76: Global Connectors for Telecommunications Volume K Forecast, by Types 2020 & 2033
- Table 77: Global Connectors for Telecommunications Revenue undefined Forecast, by Country 2020 & 2033
- Table 78: Global Connectors for Telecommunications Volume K Forecast, by Country 2020 & 2033
- Table 79: China Connectors for Telecommunications Revenue (undefined) Forecast, by Application 2020 & 2033
- Table 80: China Connectors for Telecommunications Volume (K) Forecast, by Application 2020 & 2033
- Table 81: India Connectors for Telecommunications Revenue (undefined) Forecast, by Application 2020 & 2033
- Table 82: India Connectors for Telecommunications Volume (K) Forecast, by Application 2020 & 2033
- Table 83: Japan Connectors for Telecommunications Revenue (undefined) Forecast, by Application 2020 & 2033
- Table 84: Japan Connectors for Telecommunications Volume (K) Forecast, by Application 2020 & 2033
- Table 85: South Korea Connectors for Telecommunications Revenue (undefined) Forecast, by Application 2020 & 2033
- Table 86: South Korea Connectors for Telecommunications Volume (K) Forecast, by Application 2020 & 2033
- Table 87: ASEAN Connectors for Telecommunications Revenue (undefined) Forecast, by Application 2020 & 2033
- Table 88: ASEAN Connectors for Telecommunications Volume (K) Forecast, by Application 2020 & 2033
- Table 89: Oceania Connectors for Telecommunications Revenue (undefined) Forecast, by Application 2020 & 2033
- Table 90: Oceania Connectors for Telecommunications Volume (K) Forecast, by Application 2020 & 2033
- Table 91: Rest of Asia Pacific Connectors for Telecommunications Revenue (undefined) Forecast, by Application 2020 & 2033
- Table 92: Rest of Asia Pacific Connectors for Telecommunications Volume (K) Forecast, by Application 2020 & 2033
Frequently Asked Questions
1. What is the projected Compound Annual Growth Rate (CAGR) of the Connectors for Telecommunications?
The projected CAGR is approximately 7.7%.
2. Which companies are prominent players in the Connectors for Telecommunications?
Key companies in the market include 3M, ABB, Kyocera, Balluff, Conxall, Bulgin, Eaton, Harting, Hubbell, IDEC Corporation, JAE Electronics, LAPP, Keystone Electronics, Leviton, Lumberg, Molex, Neutrik, MOXA, Omron, Panduit, Phoenix Contact, Siemens, TE Connectivity, Truck, Belden, Murrelektronik.
3. What are the main segments of the Connectors for Telecommunications?
The market segments include Application, Types.
4. Can you provide details about the market size?
The market size is estimated to be USD XXX N/A as of 2022.
5. What are some drivers contributing to market growth?
N/A
6. What are the notable trends driving market growth?
N/A
7. Are there any restraints impacting market growth?
N/A
8. Can you provide examples of recent developments in the market?
N/A
9. What pricing options are available for accessing the report?
Pricing options include single-user, multi-user, and enterprise licenses priced at USD 3350.00, USD 5025.00, and USD 6700.00 respectively.
10. Is the market size provided in terms of value or volume?
The market size is provided in terms of value, measured in N/A and volume, measured in K.
11. Are there any specific market keywords associated with the report?
Yes, the market keyword associated with the report is "Connectors for Telecommunications," which aids in identifying and referencing the specific market segment covered.
12. How do I determine which pricing option suits my needs best?
The pricing options vary based on user requirements and access needs. Individual users may opt for single-user licenses, while businesses requiring broader access may choose multi-user or enterprise licenses for cost-effective access to the report.
13. Are there any additional resources or data provided in the Connectors for Telecommunications report?
While the report offers comprehensive insights, it's advisable to review the specific contents or supplementary materials provided to ascertain if additional resources or data are available.
14. How can I stay updated on further developments or reports in the Connectors for Telecommunications?
To stay informed about further developments, trends, and reports in the Connectors for Telecommunications, consider subscribing to industry newsletters, following relevant companies and organizations, or regularly checking reputable industry news sources and publications.
Methodology
Step 1 - Identification of Relevant Samples Size from Population Database


Step 2 - Approaches for Defining Global Market Size (Value, Volume* & Price*)

Note*: In applicable scenarios
Step 3 - Data Sources
Primary Research
- Web Analytics
- Survey Reports
- Research Institute
- Latest Research Reports
- Opinion Leaders
Secondary Research
- Annual Reports
- White Paper
- Latest Press Release
- Industry Association
- Paid Database
- Investor Presentations

Step 4 - Data Triangulation
Involves using different sources of information in order to increase the validity of a study
These sources are likely to be stakeholders in a program - participants, other researchers, program staff, other community members, and so on.
Then we put all data in single framework & apply various statistical tools to find out the dynamic on the market.
During the analysis stage, feedback from the stakeholder groups would be compared to determine areas of agreement as well as areas of divergence

