
Key Insights
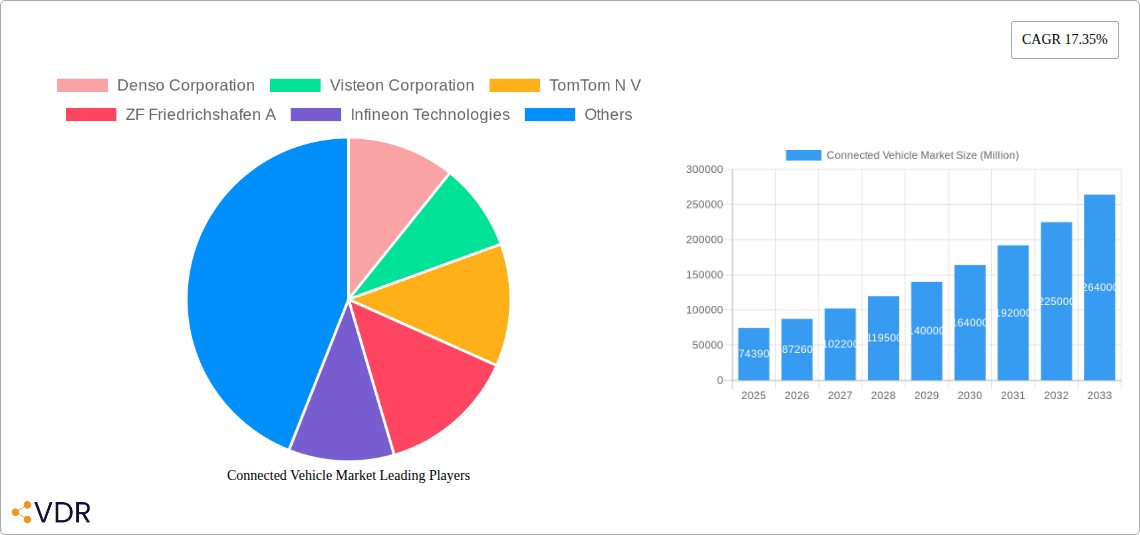
The connected vehicle market is experiencing robust growth, projected to reach a market size of $74.39 billion in 2025 and exhibiting a Compound Annual Growth Rate (CAGR) of 17.35% from 2025 to 2033. This expansion is driven by several key factors. The increasing adoption of advanced driver-assistance systems (ADAS), the rising demand for enhanced in-vehicle infotainment and telematics features, and the proliferation of smart city initiatives fostering Vehicle-to-Everything (V2X) communication are significant contributors. Furthermore, technological advancements in 4G/LTE, and the upcoming 5G networks are paving the way for seamless connectivity and data transfer, enabling features like real-time traffic updates, remote diagnostics, and autonomous driving capabilities. Government regulations promoting vehicle safety and the growing consumer preference for connected car features are also fueling market growth. The market is segmented by technology type (4G/LTE, 3G, 2G), application (driver assistance, telematics, infotainment, others), connectivity (integrated, embedded, tethered), vehicle connectivity (V2V, V2I, V2P), and vehicle type (passenger cars, commercial vehicles). Leading players like Denso, Visteon, TomTom, ZF Friedrichshafen, and others are actively shaping this market through innovation and strategic partnerships.
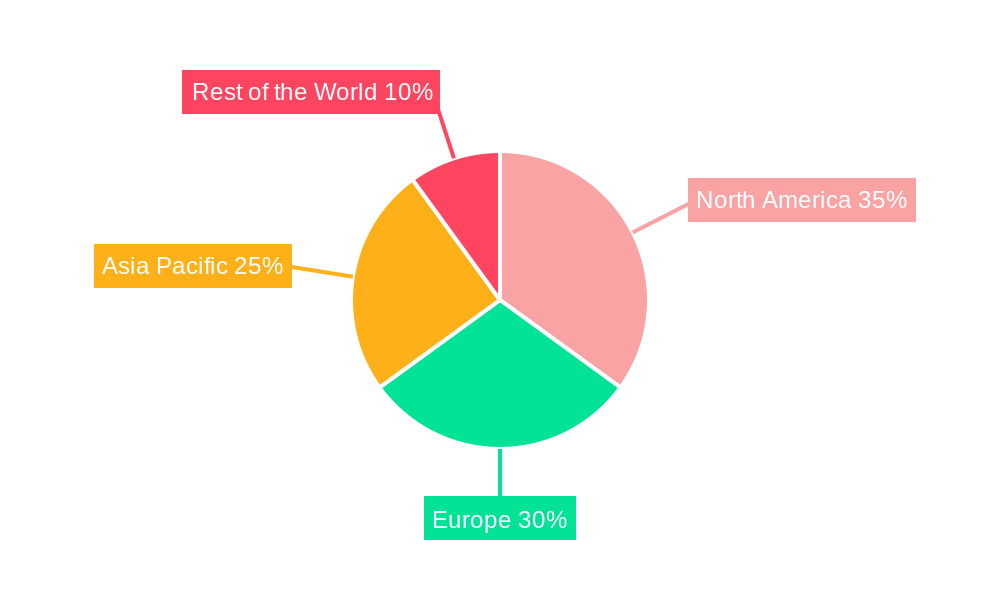
Significant regional variations exist. North America and Europe currently hold substantial market shares, driven by high vehicle ownership rates and advanced technological infrastructure. However, the Asia-Pacific region is anticipated to witness the fastest growth rate, fueled by increasing vehicle production and rising disposable incomes in developing economies like China and India. The competitive landscape is characterized by established automotive parts suppliers and technology companies vying for market dominance. Future growth will depend on factors such as the successful deployment of 5G infrastructure, the resolution of cybersecurity concerns surrounding connected vehicles, and the pace of autonomous driving technology adoption. The market is expected to continue its upward trajectory, driven by the ongoing integration of technology within the automotive sector and the evolving demands of increasingly tech-savvy consumers.
Connected Vehicle Market: A Comprehensive Report (2019-2033)
This in-depth report provides a comprehensive analysis of the Connected Vehicle Market, encompassing market dynamics, growth trends, regional insights, and key player activities. With a study period spanning 2019-2033, a base year of 2025, and a forecast period of 2025-2033, this report is an invaluable resource for industry professionals, investors, and strategic decision-makers seeking to navigate this rapidly evolving landscape. The report segments the market by technology type (4G/LTE, 3G, 2G), application (Driver Assistance, Telematics, Infotainment, Others), connectivity (Integrated, Embedded, Tethered), vehicle connectivity (V2V, V2I, V2P), and vehicle type (Passenger cars, Commercial Vehicle). The global market is expected to reach xx million units by 2033.
Connected Vehicle Market Market Dynamics & Structure
The Connected Vehicle market is characterized by high dynamism, driven by technological advancements, stringent regulatory frameworks, and a fiercely competitive landscape. Market concentration is moderate, with key players like Denso Corporation, Robert Bosch GmbH, and Continental AG holding significant shares, but also numerous smaller players contributing significantly to innovation and competition. The market is witnessing a surge in mergers and acquisitions (M&A) activity, as larger players seek to consolidate their market position and expand their product portfolios. Approximately xx M&A deals were recorded in the historical period (2019-2024), indicating a consolidation trend within the industry.
- Technological Innovation: The market is fueled by continuous improvements in communication technologies (5G, V2X), sensor technology, AI, and cloud computing, leading to enhanced functionalities and improved user experience.
- Regulatory Landscape: Government regulations promoting safety and data privacy are shaping market development, particularly concerning data security and autonomous driving capabilities.
- Competitive Dynamics: Intense competition exists amongst established automotive suppliers, technology companies, and telecom operators, leading to continuous innovation and price pressure.
- Market Segmentation: The passenger car segment dominates the market, with a projected xx% share by 2025, followed by the commercial vehicle segment demonstrating significant growth potential. The 4G/LTE technology is the leading segment by technology type in 2025, capturing xx% of market share.
- M&A Trends: The increase in M&A activity reflects strategic moves by companies seeking to broaden their technological capabilities and market reach.
Connected Vehicle Market Growth Trends & Insights
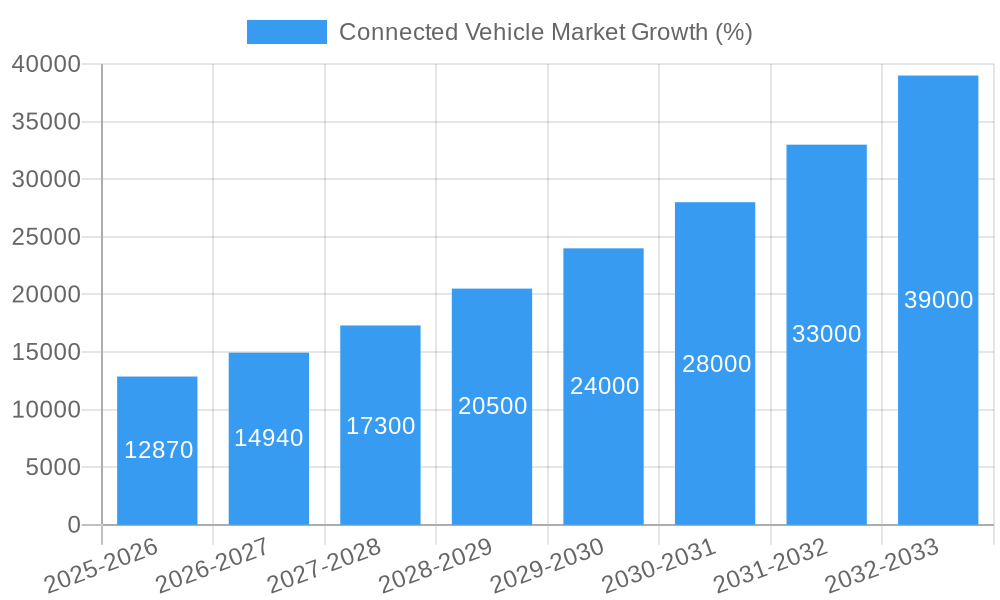
The Connected Vehicle market has witnessed robust growth throughout the historical period (2019-2024), driven primarily by increasing vehicle production, rising consumer demand for advanced features, and ongoing technological advancements. The market experienced a CAGR of xx% during 2019-2024, and is projected to maintain a significant CAGR of xx% during the forecast period (2025-2033). This growth is being driven by factors such as the increasing adoption of connected car technologies across all vehicle segments, the growing demand for safety features and infotainment systems, the increasing penetration of smartphones and improved connectivity infrastructure, and the rising demand for autonomous vehicles. Market penetration is expected to reach xx% by 2033.
The increasing adoption of connected car features is reflected in the steadily rising number of vehicles equipped with these technologies globally. The technological landscape is evolving rapidly with the advent of 5G and V2X communication, promising to revolutionize communication and data transfer capabilities. Furthermore, consumer behavior is shifting towards greater expectations of in-vehicle connectivity, comfort, and safety, thereby accelerating market growth.
Dominant Regions, Countries, or Segments in Connected Vehicle Market
North America and Europe currently hold the largest market shares within the Connected Vehicle market, driven by high vehicle ownership rates, robust technological infrastructure, and favorable regulatory environments. However, Asia-Pacific is expected to emerge as the fastest-growing region throughout the forecast period due to significant growth in vehicle production, rising disposable incomes, and expanding smartphone penetration in countries like China and India.
- By Technology Type: 4G/LTE technology dominates, offering faster data speeds and greater bandwidth compared to previous generations. However, 5G's rollout is expected to revolutionize V2X communication, significantly driving growth in the long term.
- By Application: Driver assistance systems (ADAS) are the largest application segment, followed by telematics and infotainment. Growth in autonomous driving technology is significantly impacting this segment.
- By Connectivity: Integrated connectivity solutions are experiencing strong growth, offering greater seamlessness and improved user experience.
- By Vehicle Connectivity: Vehicle-to-Vehicle (V2V) and Vehicle-to-Infrastructure (V2I) communication are gaining traction, offering increased safety and efficiency.
- By Vehicle Type: Passenger cars comprise the largest segment, but growth in connected commercial vehicles is significant, driven by fleet management and logistics applications.
The key drivers for growth include government initiatives promoting smart city development, improving infrastructure for V2I communication, increasing investments in R&D, and the growing adoption of advanced driver-assistance systems (ADAS) globally. The dominance of specific regions and segments is primarily influenced by factors like consumer preferences, technology adoption rates, and regulatory frameworks.
Connected Vehicle Market Product Landscape
The Connected Vehicle market showcases a diverse product landscape, with offerings ranging from basic telematics systems to sophisticated driver-assistance systems and autonomous driving technologies. Key product innovations include high-resolution radar systems for improved object detection, advanced AI algorithms for enhanced decision-making, and seamless integration with cloud-based platforms for real-time data processing and analysis. Unique selling propositions often include advanced safety features, enhanced user experience through intuitive interfaces, and comprehensive data analytics capabilities for fleet management and improved efficiency. These advancements are driving demand and shaping the competitive landscape.
Key Drivers, Barriers & Challenges in Connected Vehicle Market
Key Drivers:
- Technological advancements in communication technologies, sensor technologies, and AI.
- Rising consumer demand for enhanced safety features, infotainment systems, and connected car experiences.
- Government initiatives promoting smart cities and autonomous vehicles.
- Increasing investments in R&D and innovation within the automotive industry.
Key Challenges & Restraints:
- High initial investment costs associated with implementing connected car technologies.
- Concerns regarding data security and privacy.
- Regulatory uncertainty and inconsistent standards across different regions.
- Potential supply chain disruptions affecting the availability of critical components. The semiconductor shortage during 2021-2022 had a measurable negative impact, delaying the production of xx million units.
Emerging Opportunities in Connected Vehicle Market
- Expansion of connected vehicle services into emerging markets with high growth potential.
- Integration of connected car technologies with smart homes and other IoT devices.
- Development of new applications and services targeting specific user segments.
- Growing demand for advanced driver-assistance systems in commercial vehicle applications.
Growth Accelerators in the Connected Vehicle Market Industry
Technological breakthroughs, strategic partnerships, and market expansion strategies are key catalysts driving long-term growth in the Connected Vehicle market. The increasing sophistication of artificial intelligence and machine learning will be crucial in developing more advanced autonomous driving features. Collaborations between automotive manufacturers, technology companies, and telecommunication providers are accelerating innovation. Expanding into untapped markets in developing economies presents significant opportunities for market expansion.
Key Players Shaping the Connected Vehicle Market Market
- Denso Corporation
- Visteon Corporation
- TomTom N V
- ZF Friedrichshafen A
- Infineon Technologies
- Harman International
- Continental AG
- Qualcomm Technologies Inc
- Robert Bosch GmbH
- Magna International
- Sierra Wireless
- AT&T Inc
- Airbiquity Inc
Notable Milestones in Connected Vehicle Market Sector
- May 2022: Toyota Connected North America introduced cabin awareness technology using 4D imaging radar.
- April 2022: Obigo Inc. and KETI jointly developed 5G-NR-V2X technologies.
- January 2022: Aptiv PLC introduced a next-generation ADAS for autonomous and electric vehicles.
- November 2021: Continental introduced a technology solution for highly automated driving (Level 3).
In-Depth Connected Vehicle Market Market Outlook
The Connected Vehicle market is poised for sustained growth, driven by ongoing technological advancements, increasing consumer demand, and favorable regulatory environments. Future market potential is significant, with opportunities across diverse segments and geographical regions. Strategic partnerships and investments in innovative technologies will play a crucial role in shaping the future landscape, paving the way for greater integration, enhanced safety, and improved user experiences. The long-term outlook is extremely positive, with continued market expansion projected across all key segments.
Connected Vehicle Market Segmentation
-
1. Technology Type
- 1.1. 4G/LTE
- 1.2. 3G
- 1.3. 2G
-
2. Application
- 2.1. Driver Assistance
- 2.2. Telematics
- 2.3. Infotainment
- 2.4. Others
-
3. Connectivity
- 3.1. Integrated
- 3.2. Embedded
- 3.3. Tethered
-
4. Vehicle Connectivity
- 4.1. Vehicle to Vehicle (V2V)
- 4.2. Vehicle to Infrastructure (V2I)
- 4.3. Vehicle to Pedestrian (V2P)
-
5. Vehicle
- 5.1. Passenger cars
- 5.2. Commercial Vehicle
Connected Vehicle Market Segmentation By Geography
-
1. North America
- 1.1. United States
- 1.2. Canada
- 1.3. Rest of North America
-
2. Europe
- 2.1. Germany
- 2.2. United Kingdom
- 2.3. France
- 2.4. Rest of Europe
-
3. Asia Pacific
- 3.1. India
- 3.2. China
- 3.3. Japan
- 3.4. South Korea
- 3.5. Rest of Asia Pacific
-
4. Rest of the World
- 4.1. South America
- 4.2. Middle East and Africa
Connected Vehicle Market REPORT HIGHLIGHTS
| Aspects | Details |
|---|---|
| Study Period | 2019-2033 |
| Base Year | 2024 |
| Estimated Year | 2025 |
| Forecast Period | 2025-2033 |
| Historical Period | 2019-2024 |
| Growth Rate | CAGR of 17.35% from 2019-2033 |
| Segmentation |
|
Table of Contents
- 1. Introduction
- 1.1. Research Scope
- 1.2. Market Segmentation
- 1.3. Research Methodology
- 1.4. Definitions and Assumptions
- 2. Executive Summary
- 2.1. Introduction
- 3. Market Dynamics
- 3.1. Introduction
- 3.2. Market Drivers
- 3.2.1. Growing Economy And Infrastructural Growth
- 3.3. Market Restrains
- 3.3.1. High Cost of Electric Commercial Vehicle May Hamper the Growth
- 3.4. Market Trends
- 3.4.1. Growing demand for ADAS features in vehicle
- 4. Market Factor Analysis
- 4.1. Porters Five Forces
- 4.2. Supply/Value Chain
- 4.3. PESTEL analysis
- 4.4. Market Entropy
- 4.5. Patent/Trademark Analysis
- 5. Global Connected Vehicle Market Analysis, Insights and Forecast, 2019-2031
- 5.1. Market Analysis, Insights and Forecast - by Technology Type
- 5.1.1. 4G/LTE
- 5.1.2. 3G
- 5.1.3. 2G
- 5.2. Market Analysis, Insights and Forecast - by Application
- 5.2.1. Driver Assistance
- 5.2.2. Telematics
- 5.2.3. Infotainment
- 5.2.4. Others
- 5.3. Market Analysis, Insights and Forecast - by Connectivity
- 5.3.1. Integrated
- 5.3.2. Embedded
- 5.3.3. Tethered
- 5.4. Market Analysis, Insights and Forecast - by Vehicle Connectivity
- 5.4.1. Vehicle to Vehicle (V2V)
- 5.4.2. Vehicle to Infrastructure (V2I)
- 5.4.3. Vehicle to Pedestrian (V2P)
- 5.5. Market Analysis, Insights and Forecast - by Vehicle
- 5.5.1. Passenger cars
- 5.5.2. Commercial Vehicle
- 5.6. Market Analysis, Insights and Forecast - by Region
- 5.6.1. North America
- 5.6.2. Europe
- 5.6.3. Asia Pacific
- 5.6.4. Rest of the World
- 5.1. Market Analysis, Insights and Forecast - by Technology Type
- 6. North America Connected Vehicle Market Analysis, Insights and Forecast, 2019-2031
- 6.1. Market Analysis, Insights and Forecast - by Technology Type
- 6.1.1. 4G/LTE
- 6.1.2. 3G
- 6.1.3. 2G
- 6.2. Market Analysis, Insights and Forecast - by Application
- 6.2.1. Driver Assistance
- 6.2.2. Telematics
- 6.2.3. Infotainment
- 6.2.4. Others
- 6.3. Market Analysis, Insights and Forecast - by Connectivity
- 6.3.1. Integrated
- 6.3.2. Embedded
- 6.3.3. Tethered
- 6.4. Market Analysis, Insights and Forecast - by Vehicle Connectivity
- 6.4.1. Vehicle to Vehicle (V2V)
- 6.4.2. Vehicle to Infrastructure (V2I)
- 6.4.3. Vehicle to Pedestrian (V2P)
- 6.5. Market Analysis, Insights and Forecast - by Vehicle
- 6.5.1. Passenger cars
- 6.5.2. Commercial Vehicle
- 6.1. Market Analysis, Insights and Forecast - by Technology Type
- 7. Europe Connected Vehicle Market Analysis, Insights and Forecast, 2019-2031
- 7.1. Market Analysis, Insights and Forecast - by Technology Type
- 7.1.1. 4G/LTE
- 7.1.2. 3G
- 7.1.3. 2G
- 7.2. Market Analysis, Insights and Forecast - by Application
- 7.2.1. Driver Assistance
- 7.2.2. Telematics
- 7.2.3. Infotainment
- 7.2.4. Others
- 7.3. Market Analysis, Insights and Forecast - by Connectivity
- 7.3.1. Integrated
- 7.3.2. Embedded
- 7.3.3. Tethered
- 7.4. Market Analysis, Insights and Forecast - by Vehicle Connectivity
- 7.4.1. Vehicle to Vehicle (V2V)
- 7.4.2. Vehicle to Infrastructure (V2I)
- 7.4.3. Vehicle to Pedestrian (V2P)
- 7.5. Market Analysis, Insights and Forecast - by Vehicle
- 7.5.1. Passenger cars
- 7.5.2. Commercial Vehicle
- 7.1. Market Analysis, Insights and Forecast - by Technology Type
- 8. Asia Pacific Connected Vehicle Market Analysis, Insights and Forecast, 2019-2031
- 8.1. Market Analysis, Insights and Forecast - by Technology Type
- 8.1.1. 4G/LTE
- 8.1.2. 3G
- 8.1.3. 2G
- 8.2. Market Analysis, Insights and Forecast - by Application
- 8.2.1. Driver Assistance
- 8.2.2. Telematics
- 8.2.3. Infotainment
- 8.2.4. Others
- 8.3. Market Analysis, Insights and Forecast - by Connectivity
- 8.3.1. Integrated
- 8.3.2. Embedded
- 8.3.3. Tethered
- 8.4. Market Analysis, Insights and Forecast - by Vehicle Connectivity
- 8.4.1. Vehicle to Vehicle (V2V)
- 8.4.2. Vehicle to Infrastructure (V2I)
- 8.4.3. Vehicle to Pedestrian (V2P)
- 8.5. Market Analysis, Insights and Forecast - by Vehicle
- 8.5.1. Passenger cars
- 8.5.2. Commercial Vehicle
- 8.1. Market Analysis, Insights and Forecast - by Technology Type
- 9. Rest of the World Connected Vehicle Market Analysis, Insights and Forecast, 2019-2031
- 9.1. Market Analysis, Insights and Forecast - by Technology Type
- 9.1.1. 4G/LTE
- 9.1.2. 3G
- 9.1.3. 2G
- 9.2. Market Analysis, Insights and Forecast - by Application
- 9.2.1. Driver Assistance
- 9.2.2. Telematics
- 9.2.3. Infotainment
- 9.2.4. Others
- 9.3. Market Analysis, Insights and Forecast - by Connectivity
- 9.3.1. Integrated
- 9.3.2. Embedded
- 9.3.3. Tethered
- 9.4. Market Analysis, Insights and Forecast - by Vehicle Connectivity
- 9.4.1. Vehicle to Vehicle (V2V)
- 9.4.2. Vehicle to Infrastructure (V2I)
- 9.4.3. Vehicle to Pedestrian (V2P)
- 9.5. Market Analysis, Insights and Forecast - by Vehicle
- 9.5.1. Passenger cars
- 9.5.2. Commercial Vehicle
- 9.1. Market Analysis, Insights and Forecast - by Technology Type
- 10. North America Connected Vehicle Market Analysis, Insights and Forecast, 2019-2031
- 10.1. Market Analysis, Insights and Forecast - By Country/Sub-region
- 10.1.1 United States
- 10.1.2 Canada
- 10.1.3 Rest of North America
- 11. Europe Connected Vehicle Market Analysis, Insights and Forecast, 2019-2031
- 11.1. Market Analysis, Insights and Forecast - By Country/Sub-region
- 11.1.1 Germany
- 11.1.2 United Kingdom
- 11.1.3 France
- 11.1.4 Rest of Europe
- 12. Asia Pacific Connected Vehicle Market Analysis, Insights and Forecast, 2019-2031
- 12.1. Market Analysis, Insights and Forecast - By Country/Sub-region
- 12.1.1 India
- 12.1.2 China
- 12.1.3 Japan
- 12.1.4 South Korea
- 12.1.5 Rest of Asia Pacific
- 13. Rest of the World Connected Vehicle Market Analysis, Insights and Forecast, 2019-2031
- 13.1. Market Analysis, Insights and Forecast - By Country/Sub-region
- 13.1.1 South America
- 13.1.2 Middle East and Africa
- 14. Competitive Analysis
- 14.1. Global Market Share Analysis 2024
- 14.2. Company Profiles
- 14.2.1 Denso Corporation
- 14.2.1.1. Overview
- 14.2.1.2. Products
- 14.2.1.3. SWOT Analysis
- 14.2.1.4. Recent Developments
- 14.2.1.5. Financials (Based on Availability)
- 14.2.2 Visteon Corporation
- 14.2.2.1. Overview
- 14.2.2.2. Products
- 14.2.2.3. SWOT Analysis
- 14.2.2.4. Recent Developments
- 14.2.2.5. Financials (Based on Availability)
- 14.2.3 TomTom N V
- 14.2.3.1. Overview
- 14.2.3.2. Products
- 14.2.3.3. SWOT Analysis
- 14.2.3.4. Recent Developments
- 14.2.3.5. Financials (Based on Availability)
- 14.2.4 ZF Friedrichshafen A
- 14.2.4.1. Overview
- 14.2.4.2. Products
- 14.2.4.3. SWOT Analysis
- 14.2.4.4. Recent Developments
- 14.2.4.5. Financials (Based on Availability)
- 14.2.5 Infineon Technologies
- 14.2.5.1. Overview
- 14.2.5.2. Products
- 14.2.5.3. SWOT Analysis
- 14.2.5.4. Recent Developments
- 14.2.5.5. Financials (Based on Availability)
- 14.2.6 Harman International
- 14.2.6.1. Overview
- 14.2.6.2. Products
- 14.2.6.3. SWOT Analysis
- 14.2.6.4. Recent Developments
- 14.2.6.5. Financials (Based on Availability)
- 14.2.7 Continental AG
- 14.2.7.1. Overview
- 14.2.7.2. Products
- 14.2.7.3. SWOT Analysis
- 14.2.7.4. Recent Developments
- 14.2.7.5. Financials (Based on Availability)
- 14.2.8 Qualcomm Technologies Inc
- 14.2.8.1. Overview
- 14.2.8.2. Products
- 14.2.8.3. SWOT Analysis
- 14.2.8.4. Recent Developments
- 14.2.8.5. Financials (Based on Availability)
- 14.2.9 Robert Bosch GmbH
- 14.2.9.1. Overview
- 14.2.9.2. Products
- 14.2.9.3. SWOT Analysis
- 14.2.9.4. Recent Developments
- 14.2.9.5. Financials (Based on Availability)
- 14.2.10 Magna International
- 14.2.10.1. Overview
- 14.2.10.2. Products
- 14.2.10.3. SWOT Analysis
- 14.2.10.4. Recent Developments
- 14.2.10.5. Financials (Based on Availability)
- 14.2.11 Sierra Wireless
- 14.2.11.1. Overview
- 14.2.11.2. Products
- 14.2.11.3. SWOT Analysis
- 14.2.11.4. Recent Developments
- 14.2.11.5. Financials (Based on Availability)
- 14.2.12 AT&T Inc
- 14.2.12.1. Overview
- 14.2.12.2. Products
- 14.2.12.3. SWOT Analysis
- 14.2.12.4. Recent Developments
- 14.2.12.5. Financials (Based on Availability)
- 14.2.13 Airbiquity Inc
- 14.2.13.1. Overview
- 14.2.13.2. Products
- 14.2.13.3. SWOT Analysis
- 14.2.13.4. Recent Developments
- 14.2.13.5. Financials (Based on Availability)
- 14.2.1 Denso Corporation
List of Figures
- Figure 1: Global Connected Vehicle Market Revenue Breakdown (Million, %) by Region 2024 & 2032
- Figure 2: North America Connected Vehicle Market Revenue (Million), by Country 2024 & 2032
- Figure 3: North America Connected Vehicle Market Revenue Share (%), by Country 2024 & 2032
- Figure 4: Europe Connected Vehicle Market Revenue (Million), by Country 2024 & 2032
- Figure 5: Europe Connected Vehicle Market Revenue Share (%), by Country 2024 & 2032
- Figure 6: Asia Pacific Connected Vehicle Market Revenue (Million), by Country 2024 & 2032
- Figure 7: Asia Pacific Connected Vehicle Market Revenue Share (%), by Country 2024 & 2032
- Figure 8: Rest of the World Connected Vehicle Market Revenue (Million), by Country 2024 & 2032
- Figure 9: Rest of the World Connected Vehicle Market Revenue Share (%), by Country 2024 & 2032
- Figure 10: North America Connected Vehicle Market Revenue (Million), by Technology Type 2024 & 2032
- Figure 11: North America Connected Vehicle Market Revenue Share (%), by Technology Type 2024 & 2032
- Figure 12: North America Connected Vehicle Market Revenue (Million), by Application 2024 & 2032
- Figure 13: North America Connected Vehicle Market Revenue Share (%), by Application 2024 & 2032
- Figure 14: North America Connected Vehicle Market Revenue (Million), by Connectivity 2024 & 2032
- Figure 15: North America Connected Vehicle Market Revenue Share (%), by Connectivity 2024 & 2032
- Figure 16: North America Connected Vehicle Market Revenue (Million), by Vehicle Connectivity 2024 & 2032
- Figure 17: North America Connected Vehicle Market Revenue Share (%), by Vehicle Connectivity 2024 & 2032
- Figure 18: North America Connected Vehicle Market Revenue (Million), by Vehicle 2024 & 2032
- Figure 19: North America Connected Vehicle Market Revenue Share (%), by Vehicle 2024 & 2032
- Figure 20: North America Connected Vehicle Market Revenue (Million), by Country 2024 & 2032
- Figure 21: North America Connected Vehicle Market Revenue Share (%), by Country 2024 & 2032
- Figure 22: Europe Connected Vehicle Market Revenue (Million), by Technology Type 2024 & 2032
- Figure 23: Europe Connected Vehicle Market Revenue Share (%), by Technology Type 2024 & 2032
- Figure 24: Europe Connected Vehicle Market Revenue (Million), by Application 2024 & 2032
- Figure 25: Europe Connected Vehicle Market Revenue Share (%), by Application 2024 & 2032
- Figure 26: Europe Connected Vehicle Market Revenue (Million), by Connectivity 2024 & 2032
- Figure 27: Europe Connected Vehicle Market Revenue Share (%), by Connectivity 2024 & 2032
- Figure 28: Europe Connected Vehicle Market Revenue (Million), by Vehicle Connectivity 2024 & 2032
- Figure 29: Europe Connected Vehicle Market Revenue Share (%), by Vehicle Connectivity 2024 & 2032
- Figure 30: Europe Connected Vehicle Market Revenue (Million), by Vehicle 2024 & 2032
- Figure 31: Europe Connected Vehicle Market Revenue Share (%), by Vehicle 2024 & 2032
- Figure 32: Europe Connected Vehicle Market Revenue (Million), by Country 2024 & 2032
- Figure 33: Europe Connected Vehicle Market Revenue Share (%), by Country 2024 & 2032
- Figure 34: Asia Pacific Connected Vehicle Market Revenue (Million), by Technology Type 2024 & 2032
- Figure 35: Asia Pacific Connected Vehicle Market Revenue Share (%), by Technology Type 2024 & 2032
- Figure 36: Asia Pacific Connected Vehicle Market Revenue (Million), by Application 2024 & 2032
- Figure 37: Asia Pacific Connected Vehicle Market Revenue Share (%), by Application 2024 & 2032
- Figure 38: Asia Pacific Connected Vehicle Market Revenue (Million), by Connectivity 2024 & 2032
- Figure 39: Asia Pacific Connected Vehicle Market Revenue Share (%), by Connectivity 2024 & 2032
- Figure 40: Asia Pacific Connected Vehicle Market Revenue (Million), by Vehicle Connectivity 2024 & 2032
- Figure 41: Asia Pacific Connected Vehicle Market Revenue Share (%), by Vehicle Connectivity 2024 & 2032
- Figure 42: Asia Pacific Connected Vehicle Market Revenue (Million), by Vehicle 2024 & 2032
- Figure 43: Asia Pacific Connected Vehicle Market Revenue Share (%), by Vehicle 2024 & 2032
- Figure 44: Asia Pacific Connected Vehicle Market Revenue (Million), by Country 2024 & 2032
- Figure 45: Asia Pacific Connected Vehicle Market Revenue Share (%), by Country 2024 & 2032
- Figure 46: Rest of the World Connected Vehicle Market Revenue (Million), by Technology Type 2024 & 2032
- Figure 47: Rest of the World Connected Vehicle Market Revenue Share (%), by Technology Type 2024 & 2032
- Figure 48: Rest of the World Connected Vehicle Market Revenue (Million), by Application 2024 & 2032
- Figure 49: Rest of the World Connected Vehicle Market Revenue Share (%), by Application 2024 & 2032
- Figure 50: Rest of the World Connected Vehicle Market Revenue (Million), by Connectivity 2024 & 2032
- Figure 51: Rest of the World Connected Vehicle Market Revenue Share (%), by Connectivity 2024 & 2032
- Figure 52: Rest of the World Connected Vehicle Market Revenue (Million), by Vehicle Connectivity 2024 & 2032
- Figure 53: Rest of the World Connected Vehicle Market Revenue Share (%), by Vehicle Connectivity 2024 & 2032
- Figure 54: Rest of the World Connected Vehicle Market Revenue (Million), by Vehicle 2024 & 2032
- Figure 55: Rest of the World Connected Vehicle Market Revenue Share (%), by Vehicle 2024 & 2032
- Figure 56: Rest of the World Connected Vehicle Market Revenue (Million), by Country 2024 & 2032
- Figure 57: Rest of the World Connected Vehicle Market Revenue Share (%), by Country 2024 & 2032
List of Tables
- Table 1: Global Connected Vehicle Market Revenue Million Forecast, by Region 2019 & 2032
- Table 2: Global Connected Vehicle Market Revenue Million Forecast, by Technology Type 2019 & 2032
- Table 3: Global Connected Vehicle Market Revenue Million Forecast, by Application 2019 & 2032
- Table 4: Global Connected Vehicle Market Revenue Million Forecast, by Connectivity 2019 & 2032
- Table 5: Global Connected Vehicle Market Revenue Million Forecast, by Vehicle Connectivity 2019 & 2032
- Table 6: Global Connected Vehicle Market Revenue Million Forecast, by Vehicle 2019 & 2032
- Table 7: Global Connected Vehicle Market Revenue Million Forecast, by Region 2019 & 2032
- Table 8: Global Connected Vehicle Market Revenue Million Forecast, by Country 2019 & 2032
- Table 9: United States Connected Vehicle Market Revenue (Million) Forecast, by Application 2019 & 2032
- Table 10: Canada Connected Vehicle Market Revenue (Million) Forecast, by Application 2019 & 2032
- Table 11: Rest of North America Connected Vehicle Market Revenue (Million) Forecast, by Application 2019 & 2032
- Table 12: Global Connected Vehicle Market Revenue Million Forecast, by Country 2019 & 2032
- Table 13: Germany Connected Vehicle Market Revenue (Million) Forecast, by Application 2019 & 2032
- Table 14: United Kingdom Connected Vehicle Market Revenue (Million) Forecast, by Application 2019 & 2032
- Table 15: France Connected Vehicle Market Revenue (Million) Forecast, by Application 2019 & 2032
- Table 16: Rest of Europe Connected Vehicle Market Revenue (Million) Forecast, by Application 2019 & 2032
- Table 17: Global Connected Vehicle Market Revenue Million Forecast, by Country 2019 & 2032
- Table 18: India Connected Vehicle Market Revenue (Million) Forecast, by Application 2019 & 2032
- Table 19: China Connected Vehicle Market Revenue (Million) Forecast, by Application 2019 & 2032
- Table 20: Japan Connected Vehicle Market Revenue (Million) Forecast, by Application 2019 & 2032
- Table 21: South Korea Connected Vehicle Market Revenue (Million) Forecast, by Application 2019 & 2032
- Table 22: Rest of Asia Pacific Connected Vehicle Market Revenue (Million) Forecast, by Application 2019 & 2032
- Table 23: Global Connected Vehicle Market Revenue Million Forecast, by Country 2019 & 2032
- Table 24: South America Connected Vehicle Market Revenue (Million) Forecast, by Application 2019 & 2032
- Table 25: Middle East and Africa Connected Vehicle Market Revenue (Million) Forecast, by Application 2019 & 2032
- Table 26: Global Connected Vehicle Market Revenue Million Forecast, by Technology Type 2019 & 2032
- Table 27: Global Connected Vehicle Market Revenue Million Forecast, by Application 2019 & 2032
- Table 28: Global Connected Vehicle Market Revenue Million Forecast, by Connectivity 2019 & 2032
- Table 29: Global Connected Vehicle Market Revenue Million Forecast, by Vehicle Connectivity 2019 & 2032
- Table 30: Global Connected Vehicle Market Revenue Million Forecast, by Vehicle 2019 & 2032
- Table 31: Global Connected Vehicle Market Revenue Million Forecast, by Country 2019 & 2032
- Table 32: United States Connected Vehicle Market Revenue (Million) Forecast, by Application 2019 & 2032
- Table 33: Canada Connected Vehicle Market Revenue (Million) Forecast, by Application 2019 & 2032
- Table 34: Rest of North America Connected Vehicle Market Revenue (Million) Forecast, by Application 2019 & 2032
- Table 35: Global Connected Vehicle Market Revenue Million Forecast, by Technology Type 2019 & 2032
- Table 36: Global Connected Vehicle Market Revenue Million Forecast, by Application 2019 & 2032
- Table 37: Global Connected Vehicle Market Revenue Million Forecast, by Connectivity 2019 & 2032
- Table 38: Global Connected Vehicle Market Revenue Million Forecast, by Vehicle Connectivity 2019 & 2032
- Table 39: Global Connected Vehicle Market Revenue Million Forecast, by Vehicle 2019 & 2032
- Table 40: Global Connected Vehicle Market Revenue Million Forecast, by Country 2019 & 2032
- Table 41: Germany Connected Vehicle Market Revenue (Million) Forecast, by Application 2019 & 2032
- Table 42: United Kingdom Connected Vehicle Market Revenue (Million) Forecast, by Application 2019 & 2032
- Table 43: France Connected Vehicle Market Revenue (Million) Forecast, by Application 2019 & 2032
- Table 44: Rest of Europe Connected Vehicle Market Revenue (Million) Forecast, by Application 2019 & 2032
- Table 45: Global Connected Vehicle Market Revenue Million Forecast, by Technology Type 2019 & 2032
- Table 46: Global Connected Vehicle Market Revenue Million Forecast, by Application 2019 & 2032
- Table 47: Global Connected Vehicle Market Revenue Million Forecast, by Connectivity 2019 & 2032
- Table 48: Global Connected Vehicle Market Revenue Million Forecast, by Vehicle Connectivity 2019 & 2032
- Table 49: Global Connected Vehicle Market Revenue Million Forecast, by Vehicle 2019 & 2032
- Table 50: Global Connected Vehicle Market Revenue Million Forecast, by Country 2019 & 2032
- Table 51: India Connected Vehicle Market Revenue (Million) Forecast, by Application 2019 & 2032
- Table 52: China Connected Vehicle Market Revenue (Million) Forecast, by Application 2019 & 2032
- Table 53: Japan Connected Vehicle Market Revenue (Million) Forecast, by Application 2019 & 2032
- Table 54: South Korea Connected Vehicle Market Revenue (Million) Forecast, by Application 2019 & 2032
- Table 55: Rest of Asia Pacific Connected Vehicle Market Revenue (Million) Forecast, by Application 2019 & 2032
- Table 56: Global Connected Vehicle Market Revenue Million Forecast, by Technology Type 2019 & 2032
- Table 57: Global Connected Vehicle Market Revenue Million Forecast, by Application 2019 & 2032
- Table 58: Global Connected Vehicle Market Revenue Million Forecast, by Connectivity 2019 & 2032
- Table 59: Global Connected Vehicle Market Revenue Million Forecast, by Vehicle Connectivity 2019 & 2032
- Table 60: Global Connected Vehicle Market Revenue Million Forecast, by Vehicle 2019 & 2032
- Table 61: Global Connected Vehicle Market Revenue Million Forecast, by Country 2019 & 2032
- Table 62: South America Connected Vehicle Market Revenue (Million) Forecast, by Application 2019 & 2032
- Table 63: Middle East and Africa Connected Vehicle Market Revenue (Million) Forecast, by Application 2019 & 2032
Frequently Asked Questions
1. What is the projected Compound Annual Growth Rate (CAGR) of the Connected Vehicle Market?
The projected CAGR is approximately 17.35%.
2. Which companies are prominent players in the Connected Vehicle Market?
Key companies in the market include Denso Corporation, Visteon Corporation, TomTom N V, ZF Friedrichshafen A, Infineon Technologies, Harman International, Continental AG, Qualcomm Technologies Inc, Robert Bosch GmbH, Magna International, Sierra Wireless, AT&T Inc, Airbiquity Inc.
3. What are the main segments of the Connected Vehicle Market?
The market segments include Technology Type, Application, Connectivity, Vehicle Connectivity, Vehicle.
4. Can you provide details about the market size?
The market size is estimated to be USD 74.39 Million as of 2022.
5. What are some drivers contributing to market growth?
Growing Economy And Infrastructural Growth.
6. What are the notable trends driving market growth?
Growing demand for ADAS features in vehicle.
7. Are there any restraints impacting market growth?
High Cost of Electric Commercial Vehicle May Hamper the Growth.
8. Can you provide examples of recent developments in the market?
In May 2022, Toyota Connected North America introduced cabin awareness concept technology that uses millimeter-wave, high-resolution 4D imaging radar to help detect occupants (including certain pets) in cars.
9. What pricing options are available for accessing the report?
Pricing options include single-user, multi-user, and enterprise licenses priced at USD 4750, USD 5250, and USD 8750 respectively.
10. Is the market size provided in terms of value or volume?
The market size is provided in terms of value, measured in Million.
11. Are there any specific market keywords associated with the report?
Yes, the market keyword associated with the report is "Connected Vehicle Market," which aids in identifying and referencing the specific market segment covered.
12. How do I determine which pricing option suits my needs best?
The pricing options vary based on user requirements and access needs. Individual users may opt for single-user licenses, while businesses requiring broader access may choose multi-user or enterprise licenses for cost-effective access to the report.
13. Are there any additional resources or data provided in the Connected Vehicle Market report?
While the report offers comprehensive insights, it's advisable to review the specific contents or supplementary materials provided to ascertain if additional resources or data are available.
14. How can I stay updated on further developments or reports in the Connected Vehicle Market?
To stay informed about further developments, trends, and reports in the Connected Vehicle Market, consider subscribing to industry newsletters, following relevant companies and organizations, or regularly checking reputable industry news sources and publications.
Methodology
Step 1 - Identification of Relevant Samples Size from Population Database


Step 2 - Approaches for Defining Global Market Size (Value, Volume* & Price*)

Note*: In applicable scenarios
Step 3 - Data Sources
Primary Research
- Web Analytics
- Survey Reports
- Research Institute
- Latest Research Reports
- Opinion Leaders
Secondary Research
- Annual Reports
- White Paper
- Latest Press Release
- Industry Association
- Paid Database
- Investor Presentations

Step 4 - Data Triangulation
Involves using different sources of information in order to increase the validity of a study
These sources are likely to be stakeholders in a program - participants, other researchers, program staff, other community members, and so on.
Then we put all data in single framework & apply various statistical tools to find out the dynamic on the market.
During the analysis stage, feedback from the stakeholder groups would be compared to determine areas of agreement as well as areas of divergence


