
Key Insights
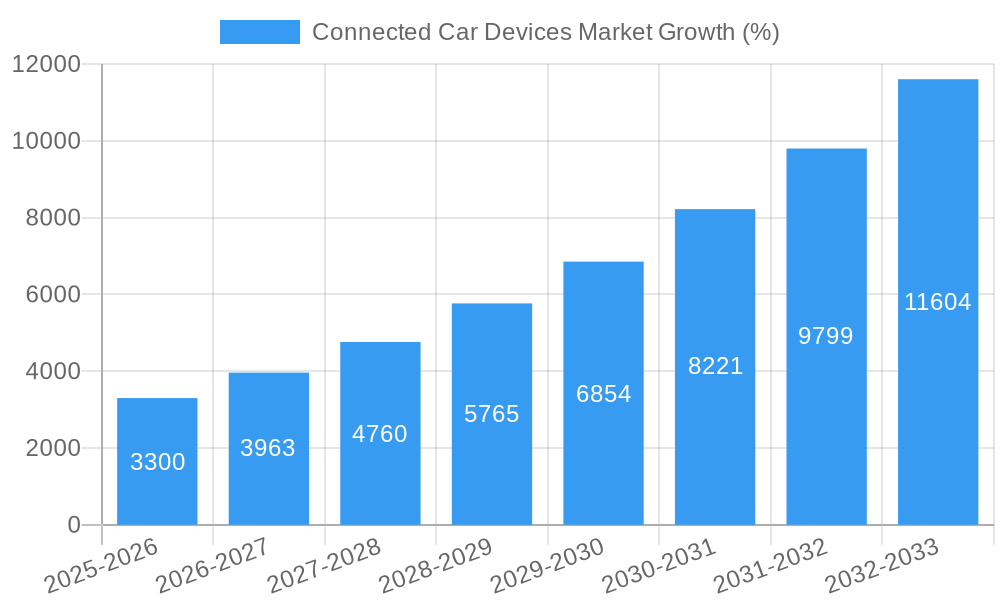
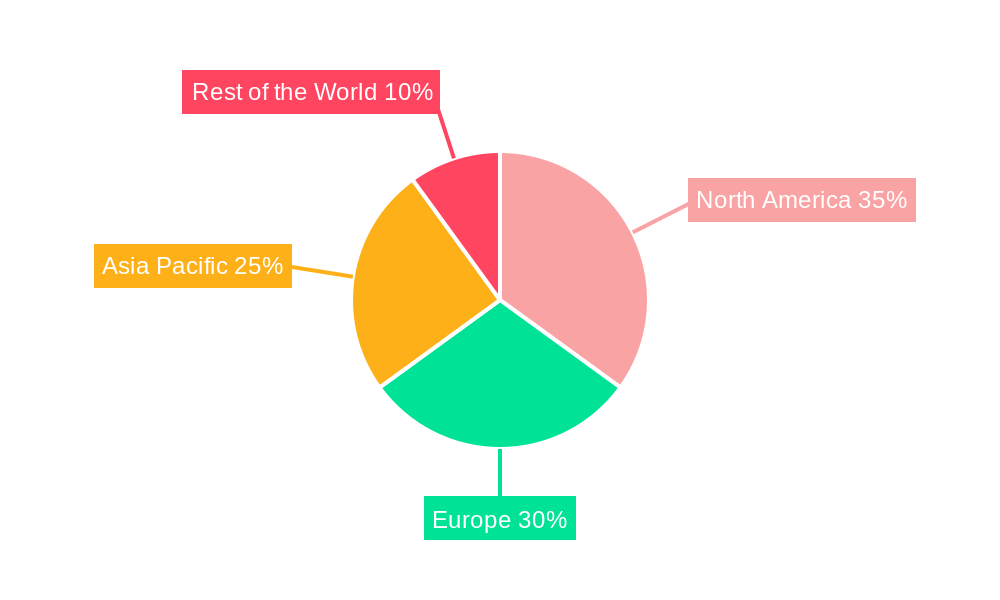
The Connected Car Devices market is experiencing robust growth, projected to reach a significant market size driven by the increasing adoption of advanced driver-assistance systems (ADAS), the proliferation of telematics solutions, and the expanding infrastructure for vehicle-to-everything (V2X) communication. The market's Compound Annual Growth Rate (CAGR) exceeding 21% from 2019 to 2033 indicates a rapidly evolving landscape, with substantial investment in research and development fueling innovation across various segments. The automotive industry's shift towards electric vehicles (EVs) further contributes to market expansion, as EVs often come equipped with more sophisticated connected car features. Key growth drivers include rising consumer demand for safety and security features, government regulations promoting connected vehicle technologies, and the increasing integration of smartphones and other mobile devices within the car ecosystem. Market segmentation reveals strong growth across all product types, including driver assistance systems and telematics, and across communication types, such as V2V, V2I, and V2P. While the OEM segment currently dominates, the aftermarket segment is also experiencing rapid expansion as consumers seek to upgrade existing vehicles with connected car capabilities. Geographic distribution shows strong growth across North America, Europe, and Asia Pacific, reflecting the high vehicle ownership rates and advanced technological infrastructure in these regions.
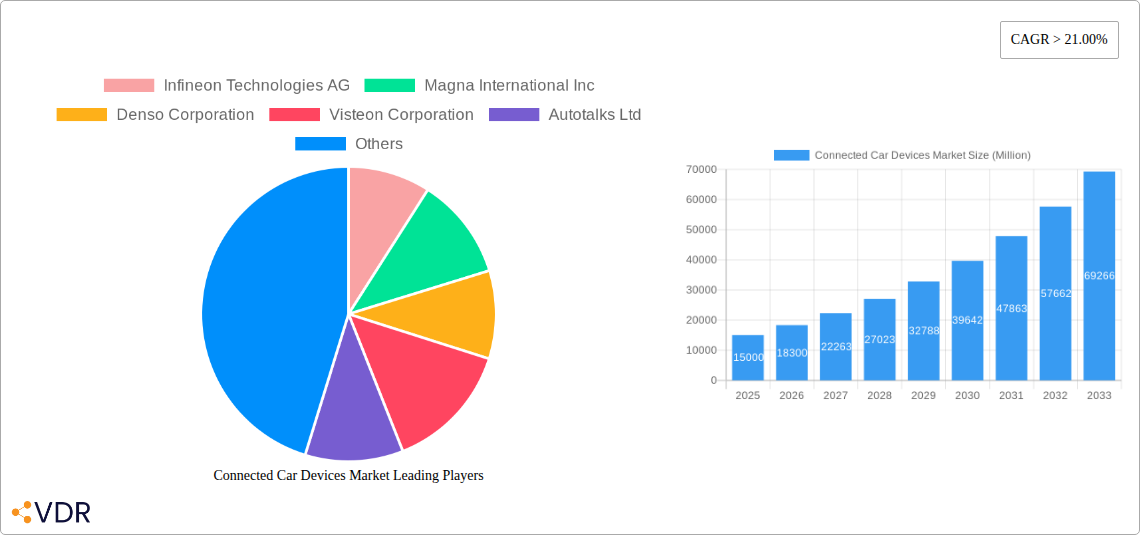
The competitive landscape is highly fragmented, with numerous global players vying for market share. Established automotive suppliers like Bosch, Continental, and Denso, alongside technology companies such as Infineon and Panasonic, are major players, constantly innovating to improve performance, reduce costs, and expand connectivity features. Future market growth will likely depend on several factors including technological advancements in areas like 5G connectivity, artificial intelligence (AI) integration for autonomous driving, and the development of robust cybersecurity measures to protect connected vehicle data. Continuous improvement in sensor technology and the expansion of V2X infrastructure will also play a significant role in shaping market growth and adoption. Furthermore, collaborative efforts between automotive manufacturers, technology providers, and government agencies are crucial for facilitating standardization and ensuring interoperability across different connected car systems.
This comprehensive report provides an in-depth analysis of the Connected Car Devices market, encompassing its dynamics, growth trends, regional performance, product landscape, and key players. The study period spans from 2019 to 2033, with 2025 serving as the base and estimated year. The forecast period covers 2025-2033, while the historical period encompasses 2019-2024. This report is crucial for OEMs, aftermarket suppliers, technology providers, and investors seeking to navigate this rapidly evolving market. The parent market is the automotive industry, while the child market focuses specifically on connected car technologies and devices. The market size is projected to reach xx Million units by 2033.
Connected Car Devices Market Market Dynamics & Structure
The Connected Car Devices market is characterized by moderate concentration, with key players like Infineon Technologies AG, Magna International Inc, Denso Corporation, and Robert Bosch GmbH holding significant market share. Technological innovation, particularly in areas like 5G connectivity, AI-powered features, and advanced driver-assistance systems (ADAS), is a major growth driver. Stringent government regulations regarding vehicle safety and emission standards are shaping market development. Competitive pressure from both established automotive suppliers and emerging technology companies is intense. The market also experiences significant M&A activity, with an estimated xx deals in the past five years.
- Market Concentration: Moderately concentrated, with top 5 players holding approximately xx% market share in 2024.
- Technological Innovation: 5G, AI, and ADAS are driving growth, while challenges remain in cybersecurity and data privacy.
- Regulatory Framework: Government regulations on safety and emissions are influencing product development and adoption rates.
- Competitive Substitutes: Limited direct substitutes, but alternative technologies (e.g., improved infotainment systems) offer competition.
- End-User Demographics: Market growth driven by increasing vehicle ownership, particularly in developing economies, and rising consumer demand for connected features.
- M&A Trends: Consolidation is expected, driven by the need for scale and technological expertise.
Connected Car Devices Market Growth Trends & Insights
The Connected Car Devices market has witnessed significant growth over the past few years, driven by factors such as the rising adoption of smartphones, increasing internet penetration, and growing demand for advanced in-vehicle infotainment systems. The market size experienced a CAGR of xx% during the historical period (2019-2024) and is projected to grow at a CAGR of xx% during the forecast period (2025-2033). This growth is fueled by advancements in communication technologies like 5G, the development of more sophisticated ADAS features, and the increasing preference for electric vehicles which inherently require more sophisticated connectivity. Consumer behavior trends towards personalized driving experiences and increased safety awareness further contribute to this market expansion. Market penetration increased from xx% in 2019 to xx% in 2024 and is expected to reach xx% by 2033.
Dominant Regions, Countries, or Segments in Connected Car Devices Market
North America and Europe currently dominate the Connected Car Devices market, driven by high vehicle ownership rates, robust technological infrastructure, and supportive government policies. However, the Asia-Pacific region is poised for rapid growth, fueled by increasing vehicle sales and rising disposable incomes. Within segments, the OEM segment holds a larger market share compared to the aftermarket segment; however, the aftermarket segment is expected to show faster growth. V2X communication (V2V, V2I, V2P) is becoming increasingly important, with V2V showing the fastest growth rate. The Driver Assistance Systems (DAS) segment is the largest in terms of value, followed by Telematics. Electric vehicles are driving growth in the EV segment, but IC Engine vehicles still constitute the majority of the market.
- North America: High vehicle ownership, advanced infrastructure, strong consumer demand for connected features.
- Europe: Stringent regulations, focus on safety and autonomous driving, substantial R&D investment.
- Asia-Pacific: Rapidly growing vehicle market, increasing disposable incomes, government support for technological advancement.
- OEM vs. Aftermarket: OEM holds larger market share, but Aftermarket is experiencing faster growth.
- Communication Types: V2V showing rapid growth, followed by V2I and V2P.
- Product Types: DAS dominates in terms of value, with Telematics showing strong growth.
- Vehicle Types: IC Engine still leading, but Electric Vehicles driving segment growth.
Connected Car Devices Market Product Landscape
The Connected Car Devices market offers a diverse range of products, including advanced driver-assistance systems (ADAS), telematics control units (TCUs), infotainment systems, and various communication modules. Recent innovations focus on enhancing safety, improving connectivity, and providing personalized user experiences. These advancements include the integration of artificial intelligence (AI), machine learning (ML), and cloud computing capabilities to deliver sophisticated driver-assistance functions, predictive maintenance, and improved infotainment features. Key selling propositions emphasize safety, convenience, and efficiency, with a growing focus on data security and privacy.
Key Drivers, Barriers & Challenges in Connected Car Devices Market
Key Drivers:
- Increasing adoption of smartphones and internet penetration.
- Growing demand for advanced driver assistance systems (ADAS).
- Government regulations promoting vehicle safety and emission standards.
- Rising consumer demand for personalized driving experiences.
Challenges and Restraints:
- High initial investment costs for implementation.
- Cybersecurity risks associated with connected vehicles.
- Data privacy concerns related to the collection and use of driver data.
- Supply chain disruptions affecting component availability. This resulted in a xx% decrease in production in 2022.
Emerging Opportunities in Connected Car Devices Market
- Expansion into developing markets with growing vehicle sales.
- Development of innovative applications, such as personalized infotainment and predictive maintenance.
- Growing demand for autonomous driving features.
- Integration of connected car devices with smart home technologies.
Growth Accelerators in the Connected Car Devices Market Industry
Technological advancements, particularly in 5G connectivity, AI, and machine learning, are key catalysts. Strategic partnerships between automotive manufacturers, technology companies, and telecommunication providers are further accelerating growth. Expansion into new markets, including developing countries with rapidly increasing vehicle ownership, presents significant opportunities.
Key Players Shaping the Connected Car Devices Market Market
- Infineon Technologies AG
- Magna International Inc
- Denso Corporation
- Visteon Corporation
- Autotalks Ltd
- Panasonic Corp
- Continental AG
- Autoliv Inc
- Harman International Industries Incorporated
- Robert Bosch GmbH
- Valeo SA
- ZF Friedrichshafen AG
Notable Milestones in Connected Car Devices Market Sector
- 2020-Oct: Launch of 5G-enabled connected car platform by a major OEM.
- 2021-Mar: Acquisition of a telematics company by a leading automotive supplier.
- 2022-June: Introduction of new ADAS features with enhanced safety capabilities.
- 2023-Sep: Partnership between a technology company and an automotive manufacturer to develop autonomous driving solutions.
In-Depth Connected Car Devices Market Market Outlook
The Connected Car Devices market is poised for robust growth over the next decade, driven by technological advancements, increasing consumer demand, and supportive government policies. Strategic partnerships, mergers, and acquisitions will further shape the market landscape, leading to increased competition and innovation. The focus on safety, convenience, and personalized experiences will remain a key driver of growth, presenting substantial opportunities for both established players and emerging companies in this dynamic sector.
Connected Car Devices Market Segmentation
-
1. End-user Type
- 1.1. OEM
- 1.2. Aftermarket
-
2. Communication Type
- 2.1. V2V
- 2.2. V2I
- 2.3. V2P
-
3. Product Type
- 3.1. Driver Assistance System (DAS)
- 3.2. Telematics
-
4. Vehicle Type
- 4.1. IC Engine
-
4.2. Electric
- 4.2.1. Battery Electric Vehicle
- 4.2.2. Hybrid Electric Vehicle
- 4.2.3. Fuel Cell Vehicle
Connected Car Devices Market Segmentation By Geography
-
1. North America
- 1.1. United States
- 1.2. Canada
- 1.3. Rest of North America
-
2. Europe
- 2.1. Germany
- 2.2. United Kingdom
- 2.3. France
- 2.4. Spain
- 2.5. Rest of Europe
-
3. Asia Pacific
- 3.1. China
- 3.2. Japan
- 3.3. India
- 3.4. Rest of Asia Pacific
-
4. Rest of the World
- 4.1. South America
- 4.2. Middle East
Connected Car Devices Market REPORT HIGHLIGHTS
| Aspects | Details |
|---|---|
| Study Period | 2019-2033 |
| Base Year | 2024 |
| Estimated Year | 2025 |
| Forecast Period | 2025-2033 |
| Historical Period | 2019-2024 |
| Growth Rate | CAGR of > 21.00% from 2019-2033 |
| Segmentation |
|
Table of Contents
- 1. Introduction
- 1.1. Research Scope
- 1.2. Market Segmentation
- 1.3. Research Methodology
- 1.4. Definitions and Assumptions
- 2. Executive Summary
- 2.1. Introduction
- 3. Market Dynamics
- 3.1. Introduction
- 3.2. Market Drivers
- 3.2.1. Increased Safety Awareness is Driving the Market Growth
- 3.3. Market Restrains
- 3.3.1. Cybersecurity Concerns is Anticipated to Restrain the Market Growth
- 3.4. Market Trends
- 3.4.1. Increasing Electrification and Automation
- 4. Market Factor Analysis
- 4.1. Porters Five Forces
- 4.2. Supply/Value Chain
- 4.3. PESTEL analysis
- 4.4. Market Entropy
- 4.5. Patent/Trademark Analysis
- 5. Global Connected Car Devices Market Analysis, Insights and Forecast, 2019-2031
- 5.1. Market Analysis, Insights and Forecast - by End-user Type
- 5.1.1. OEM
- 5.1.2. Aftermarket
- 5.2. Market Analysis, Insights and Forecast - by Communication Type
- 5.2.1. V2V
- 5.2.2. V2I
- 5.2.3. V2P
- 5.3. Market Analysis, Insights and Forecast - by Product Type
- 5.3.1. Driver Assistance System (DAS)
- 5.3.2. Telematics
- 5.4. Market Analysis, Insights and Forecast - by Vehicle Type
- 5.4.1. IC Engine
- 5.4.2. Electric
- 5.4.2.1. Battery Electric Vehicle
- 5.4.2.2. Hybrid Electric Vehicle
- 5.4.2.3. Fuel Cell Vehicle
- 5.5. Market Analysis, Insights and Forecast - by Region
- 5.5.1. North America
- 5.5.2. Europe
- 5.5.3. Asia Pacific
- 5.5.4. Rest of the World
- 5.1. Market Analysis, Insights and Forecast - by End-user Type
- 6. North America Connected Car Devices Market Analysis, Insights and Forecast, 2019-2031
- 6.1. Market Analysis, Insights and Forecast - by End-user Type
- 6.1.1. OEM
- 6.1.2. Aftermarket
- 6.2. Market Analysis, Insights and Forecast - by Communication Type
- 6.2.1. V2V
- 6.2.2. V2I
- 6.2.3. V2P
- 6.3. Market Analysis, Insights and Forecast - by Product Type
- 6.3.1. Driver Assistance System (DAS)
- 6.3.2. Telematics
- 6.4. Market Analysis, Insights and Forecast - by Vehicle Type
- 6.4.1. IC Engine
- 6.4.2. Electric
- 6.4.2.1. Battery Electric Vehicle
- 6.4.2.2. Hybrid Electric Vehicle
- 6.4.2.3. Fuel Cell Vehicle
- 6.1. Market Analysis, Insights and Forecast - by End-user Type
- 7. Europe Connected Car Devices Market Analysis, Insights and Forecast, 2019-2031
- 7.1. Market Analysis, Insights and Forecast - by End-user Type
- 7.1.1. OEM
- 7.1.2. Aftermarket
- 7.2. Market Analysis, Insights and Forecast - by Communication Type
- 7.2.1. V2V
- 7.2.2. V2I
- 7.2.3. V2P
- 7.3. Market Analysis, Insights and Forecast - by Product Type
- 7.3.1. Driver Assistance System (DAS)
- 7.3.2. Telematics
- 7.4. Market Analysis, Insights and Forecast - by Vehicle Type
- 7.4.1. IC Engine
- 7.4.2. Electric
- 7.4.2.1. Battery Electric Vehicle
- 7.4.2.2. Hybrid Electric Vehicle
- 7.4.2.3. Fuel Cell Vehicle
- 7.1. Market Analysis, Insights and Forecast - by End-user Type
- 8. Asia Pacific Connected Car Devices Market Analysis, Insights and Forecast, 2019-2031
- 8.1. Market Analysis, Insights and Forecast - by End-user Type
- 8.1.1. OEM
- 8.1.2. Aftermarket
- 8.2. Market Analysis, Insights and Forecast - by Communication Type
- 8.2.1. V2V
- 8.2.2. V2I
- 8.2.3. V2P
- 8.3. Market Analysis, Insights and Forecast - by Product Type
- 8.3.1. Driver Assistance System (DAS)
- 8.3.2. Telematics
- 8.4. Market Analysis, Insights and Forecast - by Vehicle Type
- 8.4.1. IC Engine
- 8.4.2. Electric
- 8.4.2.1. Battery Electric Vehicle
- 8.4.2.2. Hybrid Electric Vehicle
- 8.4.2.3. Fuel Cell Vehicle
- 8.1. Market Analysis, Insights and Forecast - by End-user Type
- 9. Rest of the World Connected Car Devices Market Analysis, Insights and Forecast, 2019-2031
- 9.1. Market Analysis, Insights and Forecast - by End-user Type
- 9.1.1. OEM
- 9.1.2. Aftermarket
- 9.2. Market Analysis, Insights and Forecast - by Communication Type
- 9.2.1. V2V
- 9.2.2. V2I
- 9.2.3. V2P
- 9.3. Market Analysis, Insights and Forecast - by Product Type
- 9.3.1. Driver Assistance System (DAS)
- 9.3.2. Telematics
- 9.4. Market Analysis, Insights and Forecast - by Vehicle Type
- 9.4.1. IC Engine
- 9.4.2. Electric
- 9.4.2.1. Battery Electric Vehicle
- 9.4.2.2. Hybrid Electric Vehicle
- 9.4.2.3. Fuel Cell Vehicle
- 9.1. Market Analysis, Insights and Forecast - by End-user Type
- 10. North America Connected Car Devices Market Analysis, Insights and Forecast, 2019-2031
- 10.1. Market Analysis, Insights and Forecast - By Country/Sub-region
- 10.1.1 United States
- 10.1.2 Canada
- 10.1.3 Rest of North America
- 11. Europe Connected Car Devices Market Analysis, Insights and Forecast, 2019-2031
- 11.1. Market Analysis, Insights and Forecast - By Country/Sub-region
- 11.1.1 Germany
- 11.1.2 United Kingdom
- 11.1.3 France
- 11.1.4 Spain
- 11.1.5 Rest of Europe
- 12. Asia Pacific Connected Car Devices Market Analysis, Insights and Forecast, 2019-2031
- 12.1. Market Analysis, Insights and Forecast - By Country/Sub-region
- 12.1.1 China
- 12.1.2 Japan
- 12.1.3 India
- 12.1.4 Rest of Asia Pacific
- 13. Rest of the World Connected Car Devices Market Analysis, Insights and Forecast, 2019-2031
- 13.1. Market Analysis, Insights and Forecast - By Country/Sub-region
- 13.1.1 South America
- 13.1.2 Middle East
- 14. Competitive Analysis
- 14.1. Global Market Share Analysis 2024
- 14.2. Company Profiles
- 14.2.1 Infineon Technologies AG
- 14.2.1.1. Overview
- 14.2.1.2. Products
- 14.2.1.3. SWOT Analysis
- 14.2.1.4. Recent Developments
- 14.2.1.5. Financials (Based on Availability)
- 14.2.2 Magna International Inc
- 14.2.2.1. Overview
- 14.2.2.2. Products
- 14.2.2.3. SWOT Analysis
- 14.2.2.4. Recent Developments
- 14.2.2.5. Financials (Based on Availability)
- 14.2.3 Denso Corporation
- 14.2.3.1. Overview
- 14.2.3.2. Products
- 14.2.3.3. SWOT Analysis
- 14.2.3.4. Recent Developments
- 14.2.3.5. Financials (Based on Availability)
- 14.2.4 Visteon Corporation
- 14.2.4.1. Overview
- 14.2.4.2. Products
- 14.2.4.3. SWOT Analysis
- 14.2.4.4. Recent Developments
- 14.2.4.5. Financials (Based on Availability)
- 14.2.5 Autotalks Ltd
- 14.2.5.1. Overview
- 14.2.5.2. Products
- 14.2.5.3. SWOT Analysis
- 14.2.5.4. Recent Developments
- 14.2.5.5. Financials (Based on Availability)
- 14.2.6 Panasonic Corp
- 14.2.6.1. Overview
- 14.2.6.2. Products
- 14.2.6.3. SWOT Analysis
- 14.2.6.4. Recent Developments
- 14.2.6.5. Financials (Based on Availability)
- 14.2.7 Continental AG
- 14.2.7.1. Overview
- 14.2.7.2. Products
- 14.2.7.3. SWOT Analysis
- 14.2.7.4. Recent Developments
- 14.2.7.5. Financials (Based on Availability)
- 14.2.8 Autoliv Inc
- 14.2.8.1. Overview
- 14.2.8.2. Products
- 14.2.8.3. SWOT Analysis
- 14.2.8.4. Recent Developments
- 14.2.8.5. Financials (Based on Availability)
- 14.2.9 Harman International Industries Incorporated
- 14.2.9.1. Overview
- 14.2.9.2. Products
- 14.2.9.3. SWOT Analysis
- 14.2.9.4. Recent Developments
- 14.2.9.5. Financials (Based on Availability)
- 14.2.10 Robert Bosch GmbH
- 14.2.10.1. Overview
- 14.2.10.2. Products
- 14.2.10.3. SWOT Analysis
- 14.2.10.4. Recent Developments
- 14.2.10.5. Financials (Based on Availability)
- 14.2.11 Valeo SA
- 14.2.11.1. Overview
- 14.2.11.2. Products
- 14.2.11.3. SWOT Analysis
- 14.2.11.4. Recent Developments
- 14.2.11.5. Financials (Based on Availability)
- 14.2.12 ZF Friedrichshafen AG
- 14.2.12.1. Overview
- 14.2.12.2. Products
- 14.2.12.3. SWOT Analysis
- 14.2.12.4. Recent Developments
- 14.2.12.5. Financials (Based on Availability)
- 14.2.1 Infineon Technologies AG
List of Figures
- Figure 1: Global Connected Car Devices Market Revenue Breakdown (Million, %) by Region 2024 & 2032
- Figure 2: North America Connected Car Devices Market Revenue (Million), by Country 2024 & 2032
- Figure 3: North America Connected Car Devices Market Revenue Share (%), by Country 2024 & 2032
- Figure 4: Europe Connected Car Devices Market Revenue (Million), by Country 2024 & 2032
- Figure 5: Europe Connected Car Devices Market Revenue Share (%), by Country 2024 & 2032
- Figure 6: Asia Pacific Connected Car Devices Market Revenue (Million), by Country 2024 & 2032
- Figure 7: Asia Pacific Connected Car Devices Market Revenue Share (%), by Country 2024 & 2032
- Figure 8: Rest of the World Connected Car Devices Market Revenue (Million), by Country 2024 & 2032
- Figure 9: Rest of the World Connected Car Devices Market Revenue Share (%), by Country 2024 & 2032
- Figure 10: North America Connected Car Devices Market Revenue (Million), by End-user Type 2024 & 2032
- Figure 11: North America Connected Car Devices Market Revenue Share (%), by End-user Type 2024 & 2032
- Figure 12: North America Connected Car Devices Market Revenue (Million), by Communication Type 2024 & 2032
- Figure 13: North America Connected Car Devices Market Revenue Share (%), by Communication Type 2024 & 2032
- Figure 14: North America Connected Car Devices Market Revenue (Million), by Product Type 2024 & 2032
- Figure 15: North America Connected Car Devices Market Revenue Share (%), by Product Type 2024 & 2032
- Figure 16: North America Connected Car Devices Market Revenue (Million), by Vehicle Type 2024 & 2032
- Figure 17: North America Connected Car Devices Market Revenue Share (%), by Vehicle Type 2024 & 2032
- Figure 18: North America Connected Car Devices Market Revenue (Million), by Country 2024 & 2032
- Figure 19: North America Connected Car Devices Market Revenue Share (%), by Country 2024 & 2032
- Figure 20: Europe Connected Car Devices Market Revenue (Million), by End-user Type 2024 & 2032
- Figure 21: Europe Connected Car Devices Market Revenue Share (%), by End-user Type 2024 & 2032
- Figure 22: Europe Connected Car Devices Market Revenue (Million), by Communication Type 2024 & 2032
- Figure 23: Europe Connected Car Devices Market Revenue Share (%), by Communication Type 2024 & 2032
- Figure 24: Europe Connected Car Devices Market Revenue (Million), by Product Type 2024 & 2032
- Figure 25: Europe Connected Car Devices Market Revenue Share (%), by Product Type 2024 & 2032
- Figure 26: Europe Connected Car Devices Market Revenue (Million), by Vehicle Type 2024 & 2032
- Figure 27: Europe Connected Car Devices Market Revenue Share (%), by Vehicle Type 2024 & 2032
- Figure 28: Europe Connected Car Devices Market Revenue (Million), by Country 2024 & 2032
- Figure 29: Europe Connected Car Devices Market Revenue Share (%), by Country 2024 & 2032
- Figure 30: Asia Pacific Connected Car Devices Market Revenue (Million), by End-user Type 2024 & 2032
- Figure 31: Asia Pacific Connected Car Devices Market Revenue Share (%), by End-user Type 2024 & 2032
- Figure 32: Asia Pacific Connected Car Devices Market Revenue (Million), by Communication Type 2024 & 2032
- Figure 33: Asia Pacific Connected Car Devices Market Revenue Share (%), by Communication Type 2024 & 2032
- Figure 34: Asia Pacific Connected Car Devices Market Revenue (Million), by Product Type 2024 & 2032
- Figure 35: Asia Pacific Connected Car Devices Market Revenue Share (%), by Product Type 2024 & 2032
- Figure 36: Asia Pacific Connected Car Devices Market Revenue (Million), by Vehicle Type 2024 & 2032
- Figure 37: Asia Pacific Connected Car Devices Market Revenue Share (%), by Vehicle Type 2024 & 2032
- Figure 38: Asia Pacific Connected Car Devices Market Revenue (Million), by Country 2024 & 2032
- Figure 39: Asia Pacific Connected Car Devices Market Revenue Share (%), by Country 2024 & 2032
- Figure 40: Rest of the World Connected Car Devices Market Revenue (Million), by End-user Type 2024 & 2032
- Figure 41: Rest of the World Connected Car Devices Market Revenue Share (%), by End-user Type 2024 & 2032
- Figure 42: Rest of the World Connected Car Devices Market Revenue (Million), by Communication Type 2024 & 2032
- Figure 43: Rest of the World Connected Car Devices Market Revenue Share (%), by Communication Type 2024 & 2032
- Figure 44: Rest of the World Connected Car Devices Market Revenue (Million), by Product Type 2024 & 2032
- Figure 45: Rest of the World Connected Car Devices Market Revenue Share (%), by Product Type 2024 & 2032
- Figure 46: Rest of the World Connected Car Devices Market Revenue (Million), by Vehicle Type 2024 & 2032
- Figure 47: Rest of the World Connected Car Devices Market Revenue Share (%), by Vehicle Type 2024 & 2032
- Figure 48: Rest of the World Connected Car Devices Market Revenue (Million), by Country 2024 & 2032
- Figure 49: Rest of the World Connected Car Devices Market Revenue Share (%), by Country 2024 & 2032
List of Tables
- Table 1: Global Connected Car Devices Market Revenue Million Forecast, by Region 2019 & 2032
- Table 2: Global Connected Car Devices Market Revenue Million Forecast, by End-user Type 2019 & 2032
- Table 3: Global Connected Car Devices Market Revenue Million Forecast, by Communication Type 2019 & 2032
- Table 4: Global Connected Car Devices Market Revenue Million Forecast, by Product Type 2019 & 2032
- Table 5: Global Connected Car Devices Market Revenue Million Forecast, by Vehicle Type 2019 & 2032
- Table 6: Global Connected Car Devices Market Revenue Million Forecast, by Region 2019 & 2032
- Table 7: Global Connected Car Devices Market Revenue Million Forecast, by Country 2019 & 2032
- Table 8: United States Connected Car Devices Market Revenue (Million) Forecast, by Application 2019 & 2032
- Table 9: Canada Connected Car Devices Market Revenue (Million) Forecast, by Application 2019 & 2032
- Table 10: Rest of North America Connected Car Devices Market Revenue (Million) Forecast, by Application 2019 & 2032
- Table 11: Global Connected Car Devices Market Revenue Million Forecast, by Country 2019 & 2032
- Table 12: Germany Connected Car Devices Market Revenue (Million) Forecast, by Application 2019 & 2032
- Table 13: United Kingdom Connected Car Devices Market Revenue (Million) Forecast, by Application 2019 & 2032
- Table 14: France Connected Car Devices Market Revenue (Million) Forecast, by Application 2019 & 2032
- Table 15: Spain Connected Car Devices Market Revenue (Million) Forecast, by Application 2019 & 2032
- Table 16: Rest of Europe Connected Car Devices Market Revenue (Million) Forecast, by Application 2019 & 2032
- Table 17: Global Connected Car Devices Market Revenue Million Forecast, by Country 2019 & 2032
- Table 18: China Connected Car Devices Market Revenue (Million) Forecast, by Application 2019 & 2032
- Table 19: Japan Connected Car Devices Market Revenue (Million) Forecast, by Application 2019 & 2032
- Table 20: India Connected Car Devices Market Revenue (Million) Forecast, by Application 2019 & 2032
- Table 21: Rest of Asia Pacific Connected Car Devices Market Revenue (Million) Forecast, by Application 2019 & 2032
- Table 22: Global Connected Car Devices Market Revenue Million Forecast, by Country 2019 & 2032
- Table 23: South America Connected Car Devices Market Revenue (Million) Forecast, by Application 2019 & 2032
- Table 24: Middle East Connected Car Devices Market Revenue (Million) Forecast, by Application 2019 & 2032
- Table 25: Global Connected Car Devices Market Revenue Million Forecast, by End-user Type 2019 & 2032
- Table 26: Global Connected Car Devices Market Revenue Million Forecast, by Communication Type 2019 & 2032
- Table 27: Global Connected Car Devices Market Revenue Million Forecast, by Product Type 2019 & 2032
- Table 28: Global Connected Car Devices Market Revenue Million Forecast, by Vehicle Type 2019 & 2032
- Table 29: Global Connected Car Devices Market Revenue Million Forecast, by Country 2019 & 2032
- Table 30: United States Connected Car Devices Market Revenue (Million) Forecast, by Application 2019 & 2032
- Table 31: Canada Connected Car Devices Market Revenue (Million) Forecast, by Application 2019 & 2032
- Table 32: Rest of North America Connected Car Devices Market Revenue (Million) Forecast, by Application 2019 & 2032
- Table 33: Global Connected Car Devices Market Revenue Million Forecast, by End-user Type 2019 & 2032
- Table 34: Global Connected Car Devices Market Revenue Million Forecast, by Communication Type 2019 & 2032
- Table 35: Global Connected Car Devices Market Revenue Million Forecast, by Product Type 2019 & 2032
- Table 36: Global Connected Car Devices Market Revenue Million Forecast, by Vehicle Type 2019 & 2032
- Table 37: Global Connected Car Devices Market Revenue Million Forecast, by Country 2019 & 2032
- Table 38: Germany Connected Car Devices Market Revenue (Million) Forecast, by Application 2019 & 2032
- Table 39: United Kingdom Connected Car Devices Market Revenue (Million) Forecast, by Application 2019 & 2032
- Table 40: France Connected Car Devices Market Revenue (Million) Forecast, by Application 2019 & 2032
- Table 41: Spain Connected Car Devices Market Revenue (Million) Forecast, by Application 2019 & 2032
- Table 42: Rest of Europe Connected Car Devices Market Revenue (Million) Forecast, by Application 2019 & 2032
- Table 43: Global Connected Car Devices Market Revenue Million Forecast, by End-user Type 2019 & 2032
- Table 44: Global Connected Car Devices Market Revenue Million Forecast, by Communication Type 2019 & 2032
- Table 45: Global Connected Car Devices Market Revenue Million Forecast, by Product Type 2019 & 2032
- Table 46: Global Connected Car Devices Market Revenue Million Forecast, by Vehicle Type 2019 & 2032
- Table 47: Global Connected Car Devices Market Revenue Million Forecast, by Country 2019 & 2032
- Table 48: China Connected Car Devices Market Revenue (Million) Forecast, by Application 2019 & 2032
- Table 49: Japan Connected Car Devices Market Revenue (Million) Forecast, by Application 2019 & 2032
- Table 50: India Connected Car Devices Market Revenue (Million) Forecast, by Application 2019 & 2032
- Table 51: Rest of Asia Pacific Connected Car Devices Market Revenue (Million) Forecast, by Application 2019 & 2032
- Table 52: Global Connected Car Devices Market Revenue Million Forecast, by End-user Type 2019 & 2032
- Table 53: Global Connected Car Devices Market Revenue Million Forecast, by Communication Type 2019 & 2032
- Table 54: Global Connected Car Devices Market Revenue Million Forecast, by Product Type 2019 & 2032
- Table 55: Global Connected Car Devices Market Revenue Million Forecast, by Vehicle Type 2019 & 2032
- Table 56: Global Connected Car Devices Market Revenue Million Forecast, by Country 2019 & 2032
- Table 57: South America Connected Car Devices Market Revenue (Million) Forecast, by Application 2019 & 2032
- Table 58: Middle East Connected Car Devices Market Revenue (Million) Forecast, by Application 2019 & 2032
Frequently Asked Questions
1. What is the projected Compound Annual Growth Rate (CAGR) of the Connected Car Devices Market?
The projected CAGR is approximately > 21.00%.
2. Which companies are prominent players in the Connected Car Devices Market?
Key companies in the market include Infineon Technologies AG, Magna International Inc, Denso Corporation, Visteon Corporation, Autotalks Ltd, Panasonic Corp, Continental AG, Autoliv Inc, Harman International Industries Incorporated, Robert Bosch GmbH, Valeo SA, ZF Friedrichshafen AG.
3. What are the main segments of the Connected Car Devices Market?
The market segments include End-user Type, Communication Type, Product Type, Vehicle Type.
4. Can you provide details about the market size?
The market size is estimated to be USD XX Million as of 2022.
5. What are some drivers contributing to market growth?
Increased Safety Awareness is Driving the Market Growth.
6. What are the notable trends driving market growth?
Increasing Electrification and Automation.
7. Are there any restraints impacting market growth?
Cybersecurity Concerns is Anticipated to Restrain the Market Growth.
8. Can you provide examples of recent developments in the market?
N/A
9. What pricing options are available for accessing the report?
Pricing options include single-user, multi-user, and enterprise licenses priced at USD 4750, USD 5250, and USD 8750 respectively.
10. Is the market size provided in terms of value or volume?
The market size is provided in terms of value, measured in Million.
11. Are there any specific market keywords associated with the report?
Yes, the market keyword associated with the report is "Connected Car Devices Market," which aids in identifying and referencing the specific market segment covered.
12. How do I determine which pricing option suits my needs best?
The pricing options vary based on user requirements and access needs. Individual users may opt for single-user licenses, while businesses requiring broader access may choose multi-user or enterprise licenses for cost-effective access to the report.
13. Are there any additional resources or data provided in the Connected Car Devices Market report?
While the report offers comprehensive insights, it's advisable to review the specific contents or supplementary materials provided to ascertain if additional resources or data are available.
14. How can I stay updated on further developments or reports in the Connected Car Devices Market?
To stay informed about further developments, trends, and reports in the Connected Car Devices Market, consider subscribing to industry newsletters, following relevant companies and organizations, or regularly checking reputable industry news sources and publications.
Methodology
Step 1 - Identification of Relevant Samples Size from Population Database


Step 2 - Approaches for Defining Global Market Size (Value, Volume* & Price*)

Note*: In applicable scenarios
Step 3 - Data Sources
Primary Research
- Web Analytics
- Survey Reports
- Research Institute
- Latest Research Reports
- Opinion Leaders
Secondary Research
- Annual Reports
- White Paper
- Latest Press Release
- Industry Association
- Paid Database
- Investor Presentations

Step 4 - Data Triangulation
Involves using different sources of information in order to increase the validity of a study
These sources are likely to be stakeholders in a program - participants, other researchers, program staff, other community members, and so on.
Then we put all data in single framework & apply various statistical tools to find out the dynamic on the market.
During the analysis stage, feedback from the stakeholder groups would be compared to determine areas of agreement as well as areas of divergence


