

Key Insights
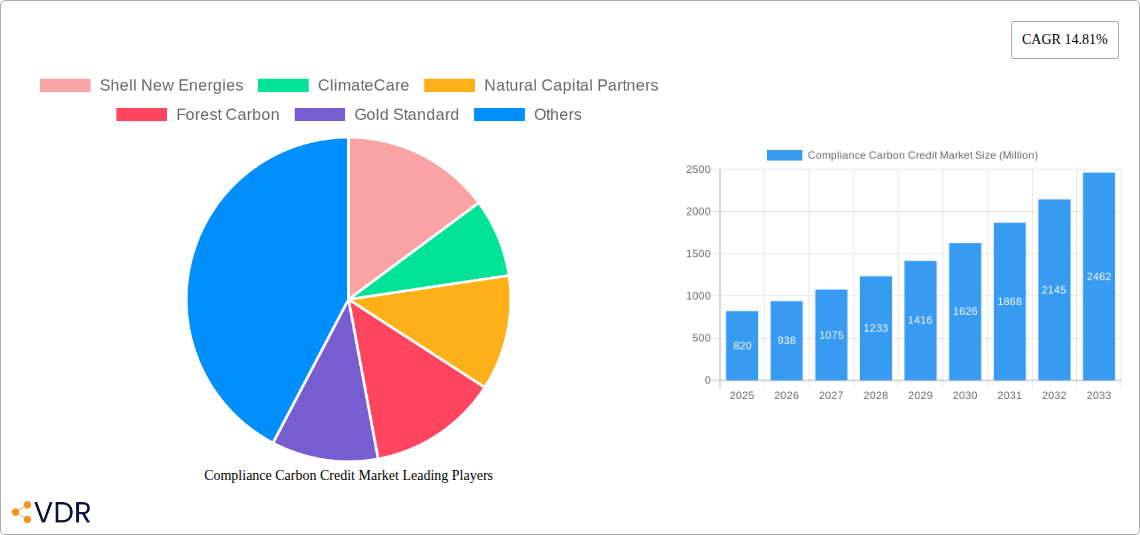
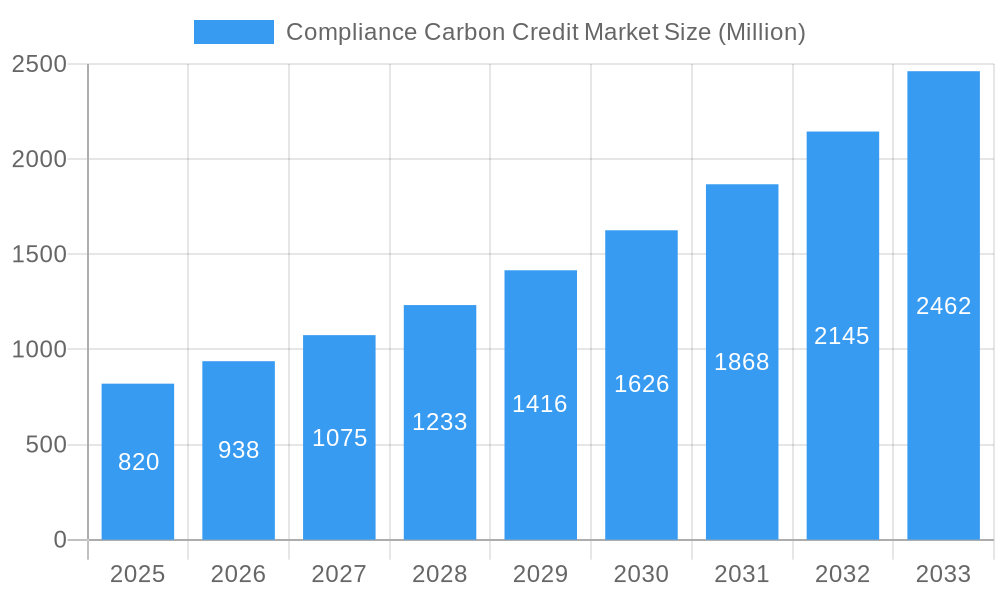
The compliance carbon credit market, valued at $820 million in 2025, is projected to experience robust growth, driven by escalating global climate change concerns and the tightening of emission regulations worldwide. A Compound Annual Growth Rate (CAGR) of 14.81% is anticipated from 2025 to 2033, indicating a significant expansion of the market. Key drivers include increasing government mandates for carbon emission reductions, growing corporate sustainability initiatives aiming to achieve net-zero targets, and the rising adoption of carbon offsetting programs across various sectors, particularly energy, transportation, and industry. The market is segmented by credit type (renewable energy, forestry, energy efficiency, industrial improvements) and sector (energy, transportation, industrial, agriculture/forestry), offering diverse investment and participation opportunities. While challenges exist, such as the complexities of verification and standardization within the carbon credit market, and concerns surrounding the potential for greenwashing, the overall trajectory remains strongly positive, fueled by increasing demand and evolving regulatory frameworks. The geographic distribution of the market is broad, with North America, Europe, and Asia-Pacific representing significant regional hubs, and emerging markets in South America and the Middle East and Africa showing promising potential for future growth. Leading companies involved include established players like Shell New Energies and ClimateCare, alongside specialized carbon credit developers and verification bodies.
Compliance Carbon Credit Market Market Size (In Million)
This considerable growth is expected to be fueled by several converging factors. The increasing stringency of carbon pricing mechanisms and emissions trading schemes globally will create a greater demand for compliance carbon credits. Simultaneously, the voluntary carbon market, while distinct, will interact with the compliance market, influencing pricing and availability. The development and deployment of innovative technologies in renewable energy and energy efficiency will provide more opportunities for generating high-quality carbon credits. However, ensuring the integrity and transparency of the market through robust verification processes and the prevention of double-counting will be crucial for sustained growth. The consistent evolution of carbon accounting standards and methodologies will also significantly influence market dynamics, along with geopolitical factors and economic developments in key regions.
Compliance Carbon Credit Market Company Market Share
Compliance Carbon Credit Market: A Comprehensive Report (2019-2033)
This comprehensive report provides a detailed analysis of the Compliance Carbon Credit Market, encompassing market dynamics, growth trends, regional analysis, key players, and future outlook. The report covers the parent market of Environmental Markets and the child market of Carbon Credits. It utilizes data from the historical period (2019-2024), base year (2025), and forecast period (2025-2033) to offer valuable insights for industry professionals and investors. The market size is predicted to reach xx Million by 2033.
Compliance Carbon Credit Market Market Dynamics & Structure
This section analyzes the intricate structure and dynamics of the Compliance Carbon Credit Market, providing a comprehensive understanding of its key characteristics. The market is characterized by a moderate level of concentration, with a few major players holding significant market share. However, the emergence of new entrants and technological innovations is fostering increased competition. The market exhibits a complex interplay of regulatory frameworks, technological advancements, and evolving consumer preferences.
Market Concentration & Competition:
- High concentration in certain segments (e.g., Renewable Energy Credits) with top players holding approximately 40% market share.
- Increasing competition from smaller, specialized players focusing on niche segments.
- Significant M&A activity observed in the historical period (2019-2024), with approximately xx deals valued at xx Million.
Technological Innovation Drivers:
- Blockchain technology is enhancing transparency and traceability of carbon credits.
- Advancements in remote sensing and data analytics are improving the accuracy of carbon emission measurements.
- Development of innovative carbon offset projects in various sectors, driving market expansion.
Regulatory Frameworks & Compliance:
- Stringent regulations regarding carbon emissions are driving demand for compliance credits.
- Evolving international and regional carbon market regulations influence pricing and trading dynamics.
- The complexities of compliance regulations can create barriers to entry for new players.
Competitive Product Substitutes & End-User Demographics:
- Limited direct substitutes for compliance carbon credits.
- End-users encompass a wide range of sectors, including energy, transportation, industry, and agriculture. The majority of buyers are large corporations.
- Growing awareness of climate change among businesses and consumers fuels demand.
Compliance Carbon Credit Market Growth Trends & Insights
The Compliance Carbon Credit Market is experiencing significant growth, driven by increasing regulatory pressures, rising corporate sustainability initiatives, and growing consumer awareness of climate change. The market size is projected to witness a CAGR of xx% from 2025 to 2033. This growth is primarily attributed to the increasing adoption of carbon offsetting programs by businesses across various sectors.
Market Size Evolution:
- The market size was valued at xx Million in 2024 and is projected to reach xx Million by 2033, exhibiting robust growth.
- Significant growth observed in the renewable energy and forestry sectors, primarily fueled by government regulations.
- Market penetration among target industries is increasing gradually, showcasing the growing acceptance of carbon credits as a tool for environmental responsibility.
Technological Disruptions & Consumer Behavior Shifts:
- Blockchain technology is transforming the market by enhancing transparency and reducing fraud.
- Consumers are increasingly demanding sustainable products and services, pressuring companies to offset their carbon footprint.
- The demand for high-quality, verified carbon credits is expected to increase, influencing market dynamics.
Dominant Regions, Countries, or Segments in Compliance Carbon Credit Market
The Compliance Carbon Credit Market exhibits regional variations in growth, with North America and Europe currently leading the market. However, developing economies in Asia-Pacific are showing significant potential for future growth. Within the market segments, Renewable Energy Projects and Forestry and Land Use are the dominant areas, driven by both supply and policy.
Leading Regions & Countries:
- North America (particularly the US and Canada) and Europe are major contributors, thanks to established regulatory frameworks.
- The Asia-Pacific region presents a substantial growth opportunity, though market development is at an earlier stage.
- Stringent environmental regulations in Europe are driving substantial market growth.
Dominant Segments (By Type of Credits):
- Renewable Energy Projects dominate, driven by a wide range of projects and governmental support.
- Forestry and Land Use are prominent, particularly in regions with significant forest resources.
- Energy Efficiency and Industrial Process Improvements are emerging segments, attracting substantial investment.
Dominant Segments (By Sector):
- The Energy Sector is the largest consumer of compliance carbon credits, mainly due to heavy emissions.
- The Transportation sector’s emissions necessitate a substantial demand for carbon credits.
- The Industrial sector is steadily adopting carbon credits to meet sustainability goals.
- Agriculture and Forestry are undergoing significant development, potentially becoming substantial credit sources.
Key Drivers:
- Government regulations and policies promoting carbon emission reductions.
- Increasing corporate sustainability initiatives and ESG (Environmental, Social, and Governance) reporting requirements.
- Growing consumer awareness of climate change and demand for sustainable products.
Compliance Carbon Credit Market Product Landscape
The Compliance Carbon Credit market encompasses a range of products, primarily focused on providing verifiable and traceable carbon offsets. These credits are generated from various projects, including renewable energy, forestry, and energy efficiency initiatives, with stringent validation and verification processes ensuring integrity. Product innovation focuses on enhancing the transparency, liquidity, and standardization of these credits using technologies like blockchain. This allows for more efficient trading and integration into broader compliance schemes.
Key Drivers, Barriers & Challenges in Compliance Carbon Credit Market
Key Drivers:
- Stringent environmental regulations and carbon pricing mechanisms.
- Growing corporate social responsibility (CSR) initiatives and the push toward carbon neutrality.
- Increased investor interest in sustainable and ESG-compliant investments.
Key Challenges and Restraints:
- Concerns regarding the quality and permanence of carbon offsets ("additionality").
- Lack of standardized methodologies for measuring and verifying emissions reductions.
- Complexity and high costs associated with project development and validation. These factors can limit market participation, particularly among smaller companies. (Estimated impact: reducing market growth by approximately 5% annually).
- Fraudulent activities, posing challenges to market integrity and investor confidence.
Emerging Opportunities in Compliance Carbon Credit Market
- Growing demand for nature-based solutions (NbS) for carbon sequestration.
- Development of innovative carbon removal technologies.
- Expansion into emerging markets with less developed carbon markets.
- Increased integration of carbon credits into financial markets (e.g., derivatives).
Growth Accelerators in the Compliance Carbon Credit Market Industry
Several factors are poised to accelerate the growth of the Compliance Carbon Credit Market in the coming years. These include technological advancements in carbon accounting and monitoring, the expansion of international carbon trading schemes, and the increasing integration of carbon credits into financial instruments. Furthermore, collaborative efforts between governments, businesses, and NGOs are driving the development of innovative carbon offsetting projects. This convergence of factors creates a favorable environment for sustained market expansion.
Key Players Shaping the Compliance Carbon Credit Market Market
- Shell New Energies
- ClimateCare
- Natural Capital Partners
- Forest Carbon
- Gold Standard
- 3Degrees
- Carbon Trust
- South Pole
- Atmosfair
- 73 Other Companies
- Sustainable Travel International
Notable Milestones in Compliance Carbon Credit Market Sector
- April 2024: Regional carbon market linkage initiatives gain momentum in California, Quebec, and Washington, potentially creating a larger, more liquid market.
- January 2024: The CFTC proposes guidance on listing voluntary carbon credit derivatives, potentially enhancing market accessibility and liquidity.
In-Depth Compliance Carbon Credit Market Market Outlook
The Compliance Carbon Credit Market is poised for significant expansion over the next decade, driven by intensifying climate change concerns, stricter environmental regulations, and increasing corporate sustainability initiatives. Strategic opportunities lie in developing innovative carbon offset projects, enhancing market transparency and standardization, and leveraging technological advancements to improve efficiency and traceability. This will lead to a more robust and reliable market, attracting greater participation from both buyers and sellers, accelerating the transition towards a low-carbon economy.
Compliance Carbon Credit Market Segmentation
-
1. Type of Credits
- 1.1. Renewable Energy Projects
- 1.2. Forestry and Land Use
- 1.3. Energy Efficiency
- 1.4. Industrial Process Improvements
-
2. Sector
- 2.1. Energy Sector
- 2.2. Transportation
- 2.3. Industrial Sector
- 2.4. Agriculture and Forestry
Compliance Carbon Credit Market Segmentation By Geography
-
1. North America
- 1.1. United States
- 1.2. Canada
-
2. Europe
- 2.1. United Kingdom
- 2.2. Germany
- 2.3. France
- 2.4. Rest of Europe
-
3. Asia Pacific
- 3.1. China
- 3.2. Japan
- 3.3. India
- 3.4. South Korea
- 3.5. Rest of Asia Pacific
- 4. Middle East and Africa
- 5. Latin America
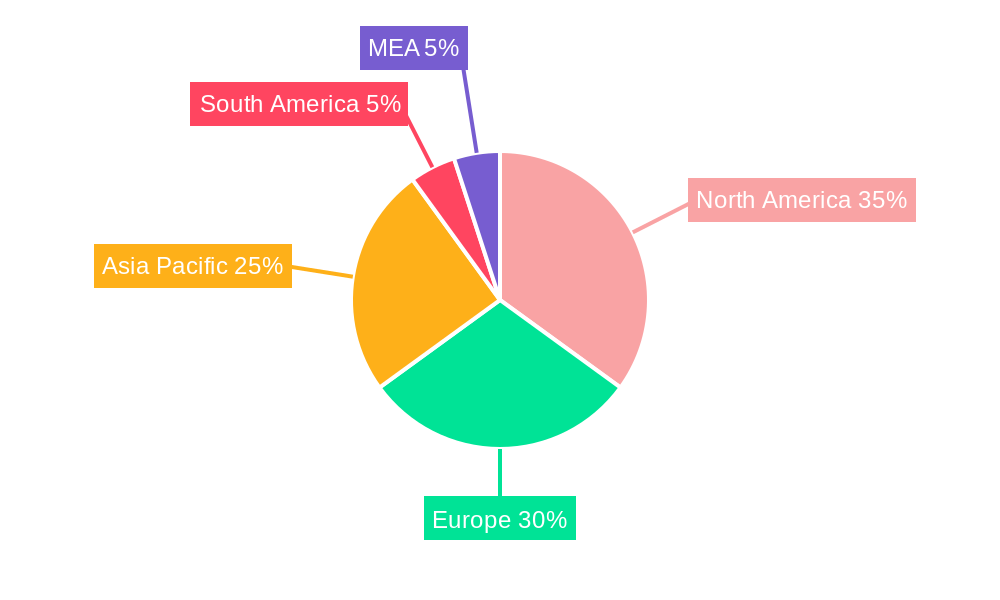
Compliance Carbon Credit Market Regional Market Share
Geographic Coverage of Compliance Carbon Credit Market
Compliance Carbon Credit Market REPORT HIGHLIGHTS
| Aspects | Details |
|---|---|
| Study Period | 2020-2034 |
| Base Year | 2025 |
| Estimated Year | 2026 |
| Forecast Period | 2026-2034 |
| Historical Period | 2020-2025 |
| Growth Rate | CAGR of 14.81% from 2020-2034 |
| Segmentation |
|
Table of Contents
- 1. Introduction
- 1.1. Research Scope
- 1.2. Market Segmentation
- 1.3. Research Objective
- 1.4. Definitions and Assumptions
- 2. Executive Summary
- 2.1. Market Snapshot
- 3. Market Dynamics
- 3.1. Market Drivers
- 3.2. Market Restrains
- 3.3. Market Trends
- 3.4. Market Opportunities
- 4. Market Factor Analysis
- 4.1. Porters Five Forces
- 4.1.1. Bargaining Power of Suppliers
- 4.1.2. Bargaining Power of Buyers
- 4.1.3. Threat of New Entrants
- 4.1.4. Threat of Substitutes
- 4.1.5. Competitive Rivalry
- 4.2. PESTEL analysis
- 4.3. BCG Analysis
- 4.3.1. Stars (High Growth, High Market Share)
- 4.3.2. Cash Cows (Low Growth, High Market Share)
- 4.3.3. Question Mark (High Growth, Low Market Share)
- 4.3.4. Dogs (Low Growth, Low Market Share)
- 4.4. Ansoff Matrix Analysis
- 4.5. Supply Chain Analysis
- 4.6. Regulatory Landscape
- 4.7. Current Market Potential and Opportunity Assessment (TAM–SAM–SOM Framework)
- 4.8. VDR Analyst Note
- 4.1. Porters Five Forces
- 5. Market Analysis, Insights and Forecast 2021-2033
- 5.1. Market Analysis, Insights and Forecast - by Type of Credits
- 5.1.1. Renewable Energy Projects
- 5.1.2. Forestry and Land Use
- 5.1.3. Energy Efficiency
- 5.1.4. Industrial Process Improvements
- 5.2. Market Analysis, Insights and Forecast - by Sector
- 5.2.1. Energy Sector
- 5.2.2. Transportation
- 5.2.3. Industrial Sector
- 5.2.4. Agriculture and Forestry
- 5.3. Market Analysis, Insights and Forecast - by Region
- 5.3.1. North America
- 5.3.2. Europe
- 5.3.3. Asia Pacific
- 5.3.4. Middle East and Africa
- 5.3.5. Latin America
- 5.1. Market Analysis, Insights and Forecast - by Type of Credits
- 6. Global Compliance Carbon Credit Market Analysis, Insights and Forecast, 2021-2033
- 6.1. Market Analysis, Insights and Forecast - by Type of Credits
- 6.1.1. Renewable Energy Projects
- 6.1.2. Forestry and Land Use
- 6.1.3. Energy Efficiency
- 6.1.4. Industrial Process Improvements
- 6.2. Market Analysis, Insights and Forecast - by Sector
- 6.2.1. Energy Sector
- 6.2.2. Transportation
- 6.2.3. Industrial Sector
- 6.2.4. Agriculture and Forestry
- 6.1. Market Analysis, Insights and Forecast - by Type of Credits
- 7. North America Compliance Carbon Credit Market Analysis, Insights and Forecast, 2021-2033
- 7.1. Market Analysis, Insights and Forecast - by Type of Credits
- 7.1.1. Renewable Energy Projects
- 7.1.2. Forestry and Land Use
- 7.1.3. Energy Efficiency
- 7.1.4. Industrial Process Improvements
- 7.2. Market Analysis, Insights and Forecast - by Sector
- 7.2.1. Energy Sector
- 7.2.2. Transportation
- 7.2.3. Industrial Sector
- 7.2.4. Agriculture and Forestry
- 7.1. Market Analysis, Insights and Forecast - by Type of Credits
- 8. Europe Compliance Carbon Credit Market Analysis, Insights and Forecast, 2021-2033
- 8.1. Market Analysis, Insights and Forecast - by Type of Credits
- 8.1.1. Renewable Energy Projects
- 8.1.2. Forestry and Land Use
- 8.1.3. Energy Efficiency
- 8.1.4. Industrial Process Improvements
- 8.2. Market Analysis, Insights and Forecast - by Sector
- 8.2.1. Energy Sector
- 8.2.2. Transportation
- 8.2.3. Industrial Sector
- 8.2.4. Agriculture and Forestry
- 8.1. Market Analysis, Insights and Forecast - by Type of Credits
- 9. Asia Pacific Compliance Carbon Credit Market Analysis, Insights and Forecast, 2021-2033
- 9.1. Market Analysis, Insights and Forecast - by Type of Credits
- 9.1.1. Renewable Energy Projects
- 9.1.2. Forestry and Land Use
- 9.1.3. Energy Efficiency
- 9.1.4. Industrial Process Improvements
- 9.2. Market Analysis, Insights and Forecast - by Sector
- 9.2.1. Energy Sector
- 9.2.2. Transportation
- 9.2.3. Industrial Sector
- 9.2.4. Agriculture and Forestry
- 9.1. Market Analysis, Insights and Forecast - by Type of Credits
- 10. Middle East and Africa Compliance Carbon Credit Market Analysis, Insights and Forecast, 2021-2033
- 10.1. Market Analysis, Insights and Forecast - by Type of Credits
- 10.1.1. Renewable Energy Projects
- 10.1.2. Forestry and Land Use
- 10.1.3. Energy Efficiency
- 10.1.4. Industrial Process Improvements
- 10.2. Market Analysis, Insights and Forecast - by Sector
- 10.2.1. Energy Sector
- 10.2.2. Transportation
- 10.2.3. Industrial Sector
- 10.2.4. Agriculture and Forestry
- 10.1. Market Analysis, Insights and Forecast - by Type of Credits
- 11. Latin America Compliance Carbon Credit Market Analysis, Insights and Forecast, 2021-2033
- 11.1. Market Analysis, Insights and Forecast - by Type of Credits
- 11.1.1. Renewable Energy Projects
- 11.1.2. Forestry and Land Use
- 11.1.3. Energy Efficiency
- 11.1.4. Industrial Process Improvements
- 11.2. Market Analysis, Insights and Forecast - by Sector
- 11.2.1. Energy Sector
- 11.2.2. Transportation
- 11.2.3. Industrial Sector
- 11.2.4. Agriculture and Forestry
- 11.1. Market Analysis, Insights and Forecast - by Type of Credits
- 12. Competitive Analysis
- 12.1. Company Profiles
- 12.1.1 Shell New Energies
- 12.1.1.1. Company Overview
- 12.1.1.2. Products
- 12.1.1.3. Company Financials
- 12.1.1.4. SWOT Analysis
- 12.1.2 ClimateCare
- 12.1.2.1. Company Overview
- 12.1.2.2. Products
- 12.1.2.3. Company Financials
- 12.1.2.4. SWOT Analysis
- 12.1.3 Natural Capital Partners
- 12.1.3.1. Company Overview
- 12.1.3.2. Products
- 12.1.3.3. Company Financials
- 12.1.3.4. SWOT Analysis
- 12.1.4 Forest Carbon
- 12.1.4.1. Company Overview
- 12.1.4.2. Products
- 12.1.4.3. Company Financials
- 12.1.4.4. SWOT Analysis
- 12.1.5 Gold Standard
- 12.1.5.1. Company Overview
- 12.1.5.2. Products
- 12.1.5.3. Company Financials
- 12.1.5.4. SWOT Analysis
- 12.1.6 3Degrees
- 12.1.6.1. Company Overview
- 12.1.6.2. Products
- 12.1.6.3. Company Financials
- 12.1.6.4. SWOT Analysis
- 12.1.7 Carbon Trust
- 12.1.7.1. Company Overview
- 12.1.7.2. Products
- 12.1.7.3. Company Financials
- 12.1.7.4. SWOT Analysis
- 12.1.8 South Pole
- 12.1.8.1. Company Overview
- 12.1.8.2. Products
- 12.1.8.3. Company Financials
- 12.1.8.4. SWOT Analysis
- 12.1.9 Atmosfair**List Not Exhaustive 7 3 Other Companie
- 12.1.9.1. Company Overview
- 12.1.9.2. Products
- 12.1.9.3. Company Financials
- 12.1.9.4. SWOT Analysis
- 12.1.10 Sustainable Travel International
- 12.1.10.1. Company Overview
- 12.1.10.2. Products
- 12.1.10.3. Company Financials
- 12.1.10.4. SWOT Analysis
- 12.1.1 Shell New Energies
- 12.2. Market Entropy
- 12.2.1 Company's Key Areas Served
- 12.2.2 Recent Developments
- 12.3. Company Market Share Analysis 2025
- 12.3.1 Top 5 Companies Market Share Analysis
- 12.3.2 Top 3 Companies Market Share Analysis
- 12.4. List of Potential Customers
- 13. Research Methodology
List of Figures
- Figure 1: Global Compliance Carbon Credit Market Revenue Breakdown (Million, %) by Region 2025 & 2033
- Figure 2: North America Compliance Carbon Credit Market Revenue (Million), by Type of Credits 2025 & 2033
- Figure 3: North America Compliance Carbon Credit Market Revenue Share (%), by Type of Credits 2025 & 2033
- Figure 4: North America Compliance Carbon Credit Market Revenue (Million), by Sector 2025 & 2033
- Figure 5: North America Compliance Carbon Credit Market Revenue Share (%), by Sector 2025 & 2033
- Figure 6: North America Compliance Carbon Credit Market Revenue (Million), by Country 2025 & 2033
- Figure 7: North America Compliance Carbon Credit Market Revenue Share (%), by Country 2025 & 2033
- Figure 8: Europe Compliance Carbon Credit Market Revenue (Million), by Type of Credits 2025 & 2033
- Figure 9: Europe Compliance Carbon Credit Market Revenue Share (%), by Type of Credits 2025 & 2033
- Figure 10: Europe Compliance Carbon Credit Market Revenue (Million), by Sector 2025 & 2033
- Figure 11: Europe Compliance Carbon Credit Market Revenue Share (%), by Sector 2025 & 2033
- Figure 12: Europe Compliance Carbon Credit Market Revenue (Million), by Country 2025 & 2033
- Figure 13: Europe Compliance Carbon Credit Market Revenue Share (%), by Country 2025 & 2033
- Figure 14: Asia Pacific Compliance Carbon Credit Market Revenue (Million), by Type of Credits 2025 & 2033
- Figure 15: Asia Pacific Compliance Carbon Credit Market Revenue Share (%), by Type of Credits 2025 & 2033
- Figure 16: Asia Pacific Compliance Carbon Credit Market Revenue (Million), by Sector 2025 & 2033
- Figure 17: Asia Pacific Compliance Carbon Credit Market Revenue Share (%), by Sector 2025 & 2033
- Figure 18: Asia Pacific Compliance Carbon Credit Market Revenue (Million), by Country 2025 & 2033
- Figure 19: Asia Pacific Compliance Carbon Credit Market Revenue Share (%), by Country 2025 & 2033
- Figure 20: Middle East and Africa Compliance Carbon Credit Market Revenue (Million), by Type of Credits 2025 & 2033
- Figure 21: Middle East and Africa Compliance Carbon Credit Market Revenue Share (%), by Type of Credits 2025 & 2033
- Figure 22: Middle East and Africa Compliance Carbon Credit Market Revenue (Million), by Sector 2025 & 2033
- Figure 23: Middle East and Africa Compliance Carbon Credit Market Revenue Share (%), by Sector 2025 & 2033
- Figure 24: Middle East and Africa Compliance Carbon Credit Market Revenue (Million), by Country 2025 & 2033
- Figure 25: Middle East and Africa Compliance Carbon Credit Market Revenue Share (%), by Country 2025 & 2033
- Figure 26: Latin America Compliance Carbon Credit Market Revenue (Million), by Type of Credits 2025 & 2033
- Figure 27: Latin America Compliance Carbon Credit Market Revenue Share (%), by Type of Credits 2025 & 2033
- Figure 28: Latin America Compliance Carbon Credit Market Revenue (Million), by Sector 2025 & 2033
- Figure 29: Latin America Compliance Carbon Credit Market Revenue Share (%), by Sector 2025 & 2033
- Figure 30: Latin America Compliance Carbon Credit Market Revenue (Million), by Country 2025 & 2033
- Figure 31: Latin America Compliance Carbon Credit Market Revenue Share (%), by Country 2025 & 2033
List of Tables
- Table 1: Global Compliance Carbon Credit Market Revenue Million Forecast, by Type of Credits 2020 & 2033
- Table 2: Global Compliance Carbon Credit Market Revenue Million Forecast, by Sector 2020 & 2033
- Table 3: Global Compliance Carbon Credit Market Revenue Million Forecast, by Region 2020 & 2033
- Table 4: Global Compliance Carbon Credit Market Revenue Million Forecast, by Type of Credits 2020 & 2033
- Table 5: Global Compliance Carbon Credit Market Revenue Million Forecast, by Sector 2020 & 2033
- Table 6: Global Compliance Carbon Credit Market Revenue Million Forecast, by Country 2020 & 2033
- Table 7: United States Compliance Carbon Credit Market Revenue (Million) Forecast, by Application 2020 & 2033
- Table 8: Canada Compliance Carbon Credit Market Revenue (Million) Forecast, by Application 2020 & 2033
- Table 9: Global Compliance Carbon Credit Market Revenue Million Forecast, by Type of Credits 2020 & 2033
- Table 10: Global Compliance Carbon Credit Market Revenue Million Forecast, by Sector 2020 & 2033
- Table 11: Global Compliance Carbon Credit Market Revenue Million Forecast, by Country 2020 & 2033
- Table 12: United Kingdom Compliance Carbon Credit Market Revenue (Million) Forecast, by Application 2020 & 2033
- Table 13: Germany Compliance Carbon Credit Market Revenue (Million) Forecast, by Application 2020 & 2033
- Table 14: France Compliance Carbon Credit Market Revenue (Million) Forecast, by Application 2020 & 2033
- Table 15: Rest of Europe Compliance Carbon Credit Market Revenue (Million) Forecast, by Application 2020 & 2033
- Table 16: Global Compliance Carbon Credit Market Revenue Million Forecast, by Type of Credits 2020 & 2033
- Table 17: Global Compliance Carbon Credit Market Revenue Million Forecast, by Sector 2020 & 2033
- Table 18: Global Compliance Carbon Credit Market Revenue Million Forecast, by Country 2020 & 2033
- Table 19: China Compliance Carbon Credit Market Revenue (Million) Forecast, by Application 2020 & 2033
- Table 20: Japan Compliance Carbon Credit Market Revenue (Million) Forecast, by Application 2020 & 2033
- Table 21: India Compliance Carbon Credit Market Revenue (Million) Forecast, by Application 2020 & 2033
- Table 22: South Korea Compliance Carbon Credit Market Revenue (Million) Forecast, by Application 2020 & 2033
- Table 23: Rest of Asia Pacific Compliance Carbon Credit Market Revenue (Million) Forecast, by Application 2020 & 2033
- Table 24: Global Compliance Carbon Credit Market Revenue Million Forecast, by Type of Credits 2020 & 2033
- Table 25: Global Compliance Carbon Credit Market Revenue Million Forecast, by Sector 2020 & 2033
- Table 26: Global Compliance Carbon Credit Market Revenue Million Forecast, by Country 2020 & 2033
- Table 27: Global Compliance Carbon Credit Market Revenue Million Forecast, by Type of Credits 2020 & 2033
- Table 28: Global Compliance Carbon Credit Market Revenue Million Forecast, by Sector 2020 & 2033
- Table 29: Global Compliance Carbon Credit Market Revenue Million Forecast, by Country 2020 & 2033
Frequently Asked Questions
1. What is the projected Compound Annual Growth Rate (CAGR) of the Compliance Carbon Credit Market?
The projected CAGR is approximately 14.81%.
2. Which companies are prominent players in the Compliance Carbon Credit Market?
Key companies in the market include Shell New Energies, ClimateCare, Natural Capital Partners, Forest Carbon, Gold Standard, 3Degrees, Carbon Trust, South Pole, Atmosfair**List Not Exhaustive 7 3 Other Companie, Sustainable Travel International.
3. What are the main segments of the Compliance Carbon Credit Market?
The market segments include Type of Credits, Sector.
4. Can you provide details about the market size?
The market size is estimated to be USD 0.82 Million as of 2022.
5. What are some drivers contributing to market growth?
Regulatory Mandates and Policies; Growing Corporate Sustainability Initiatives.
6. What are the notable trends driving market growth?
Charting the Course of Carbon Pricing: UK-ETS Post-Brexit.
7. Are there any restraints impacting market growth?
Market Complexity and Uncertainty.
8. Can you provide examples of recent developments in the market?
April 2024: Regional efforts in the Western United States and Canada are gaining momentum as the urgency of combating climate change increases. Plans to link their carbon markets are being drawn up in California, Quebec, and Washington, which could significantly affect trading dynamics. The three authorities intend to work together to create a more extensive carbon credit market as soon as their proposed alliance takes effect.
9. What pricing options are available for accessing the report?
Pricing options include single-user, multi-user, and enterprise licenses priced at USD 4750, USD 5250, and USD 8750 respectively.
10. Is the market size provided in terms of value or volume?
The market size is provided in terms of value, measured in Million.
11. Are there any specific market keywords associated with the report?
Yes, the market keyword associated with the report is "Compliance Carbon Credit Market," which aids in identifying and referencing the specific market segment covered.
12. How do I determine which pricing option suits my needs best?
The pricing options vary based on user requirements and access needs. Individual users may opt for single-user licenses, while businesses requiring broader access may choose multi-user or enterprise licenses for cost-effective access to the report.
13. Are there any additional resources or data provided in the Compliance Carbon Credit Market report?
While the report offers comprehensive insights, it's advisable to review the specific contents or supplementary materials provided to ascertain if additional resources or data are available.
14. How can I stay updated on further developments or reports in the Compliance Carbon Credit Market?
To stay informed about further developments, trends, and reports in the Compliance Carbon Credit Market, consider subscribing to industry newsletters, following relevant companies and organizations, or regularly checking reputable industry news sources and publications.
Methodology
Step 1 - Identification of Relevant Samples Size from Population Database


Step 2 - Approaches for Defining Global Market Size (Value, Volume* & Price*)

Note*: In applicable scenarios
Step 3 - Data Sources
Primary Research
- Web Analytics
- Survey Reports
- Research Institute
- Latest Research Reports
- Opinion Leaders
Secondary Research
- Annual Reports
- White Paper
- Latest Press Release
- Industry Association
- Paid Database
- Investor Presentations

Step 4 - Data Triangulation
Involves using different sources of information in order to increase the validity of a study
These sources are likely to be stakeholders in a program - participants, other researchers, program staff, other community members, and so on.
Then we put all data in single framework & apply various statistical tools to find out the dynamic on the market.
During the analysis stage, feedback from the stakeholder groups would be compared to determine areas of agreement as well as areas of divergence