Key Insights
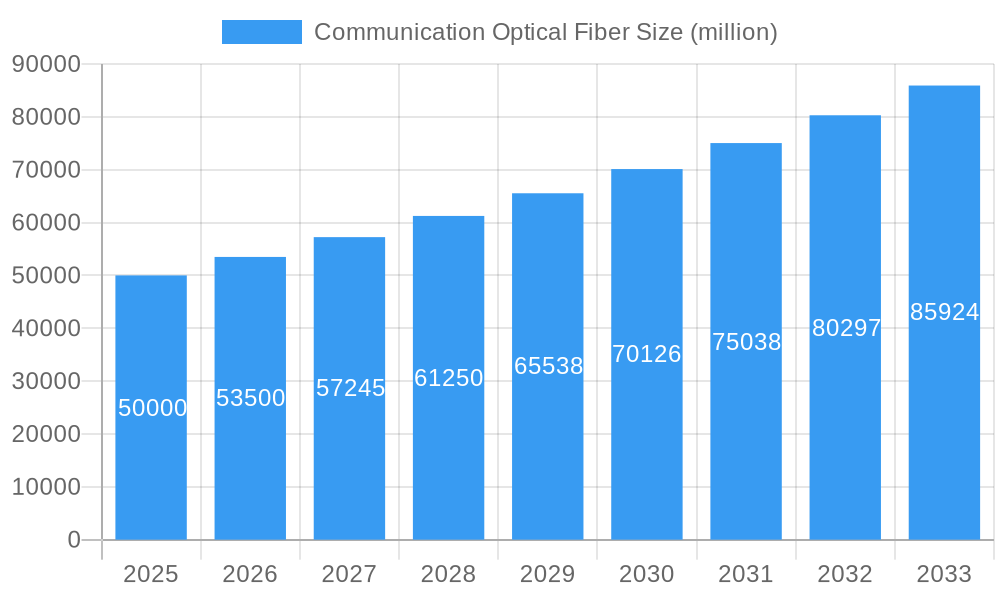
The global communication optical fiber market is projected for substantial expansion, fueled by escalating demand for high-speed internet and data transmission. Key growth drivers include the widespread deployment of 5G networks, the increasing reliance on cloud computing services, and the rapid growth of data centers. Technological advancements in fiber optics, such as enhanced bandwidth capabilities and refined manufacturing processes, further propel market evolution. The market size was estimated at $10.74 billion in the base year 2025, with a projected Compound Annual Growth Rate (CAGR) of 6.86%. This trajectory indicates significant market value growth over the forecast period.
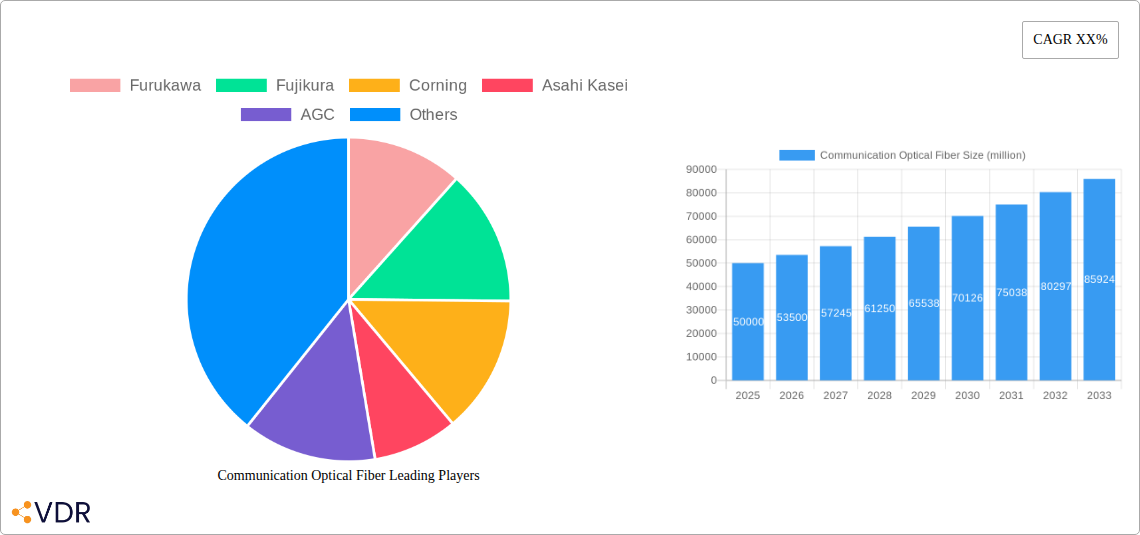
Communication Optical Fiber Market Size (In Billion)
Despite its promising outlook, market expansion is tempered by factors such as the considerable capital investment needed for fiber optic infrastructure, particularly in emerging economies. Competition from alternative technologies, including satellite internet, presents a potential challenge. Nevertheless, the persistent global appetite for faster, more reliable data transmission ensures a positive long-term growth trajectory for the communication optical fiber market. The competitive environment features prominent companies like Corning, Fujikura, and Furukawa, alongside emerging Asian competitors. Market segmentation by fiber type (single-mode, multi-mode), application (telecommunications, data centers, FTTx), and region offers deeper insights into market dynamics.
Communication Optical Fiber Company Market Share
Communication Optical Fiber Market Report: 2019-2033
This comprehensive report provides an in-depth analysis of the global Communication Optical Fiber market, encompassing market dynamics, growth trends, regional dominance, product landscape, key players, and future outlook. The study period covers 2019-2033, with 2025 as the base and estimated year. The forecast period is 2025-2033, and the historical period is 2019-2024. This report is crucial for industry professionals, investors, and strategic decision-makers seeking to navigate this rapidly evolving market.
Parent Market: Optical Fiber Market Child Market: Communication Optical Fiber Market (covering applications in telecommunications, data centers, and more)
Communication Optical Fiber Market Dynamics & Structure
The communication optical fiber market is characterized by a moderately concentrated landscape, with key players like Corning, Furukawa, and Fujikura holding significant market share. Technological innovation, driven by the need for higher bandwidth and faster data transmission, is a primary growth driver. Stringent regulatory frameworks governing fiber optic deployment and safety standards influence market dynamics. Competitive substitutes, such as wireless technologies, pose a challenge, but the demand for high-capacity, low-latency data transfer continues to favor fiber optics. End-user demographics are shifting towards increased adoption by data centers and cloud providers, fueling market growth. M&A activities are relatively frequent, with xx deals recorded between 2019 and 2024, primarily focused on expanding geographic reach and technological capabilities.
- Market Concentration: Moderately concentrated, with top 5 players holding xx% market share in 2024.
- Technological Innovation Drivers: Increased bandwidth demands, 5G rollout, and data center expansion.
- Regulatory Frameworks: Government initiatives promoting digital infrastructure and broadband access.
- Competitive Product Substitutes: Wireless communication technologies (5G, Wi-Fi).
- End-User Demographics: Data centers, cloud providers, telecommunication companies, and government bodies.
- M&A Trends: xx M&A deals between 2019 and 2024, focused on technology and geographic expansion. Average deal size: $xx million.
Communication Optical Fiber Growth Trends & Insights
The global communication optical fiber market experienced robust growth during the historical period (2019-2024), driven by the exponential rise in data consumption. The market size expanded from $xx million in 2019 to $xx million in 2024, registering a CAGR of xx%. This growth trajectory is expected to continue through 2033, although at a slightly moderated pace due to market saturation in some regions. Technological advancements, such as the introduction of higher-bandwidth fibers and improved manufacturing processes, have spurred adoption rates. Consumer behavior shifts towards increased reliance on high-speed internet and cloud services have also fueled market growth. The market is anticipated to reach $xx million by 2033, exhibiting a CAGR of xx% during the forecast period (2025-2033). Market penetration is expected to increase from xx% in 2024 to xx% in 2033.
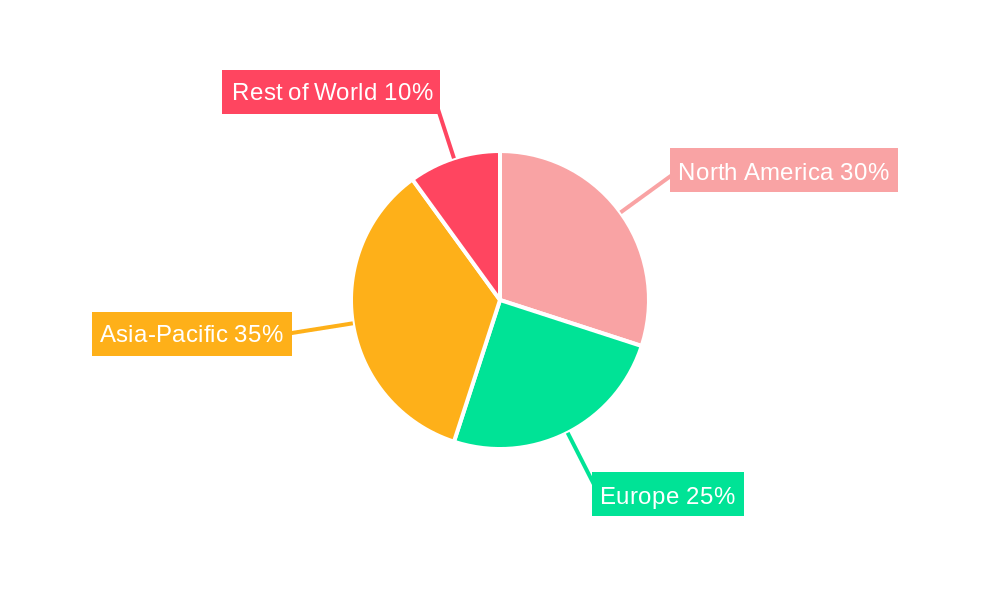
Dominant Regions, Countries, or Segments in Communication Optical Fiber
North America and Asia-Pacific are the dominant regions in the communication optical fiber market, driven by robust investments in telecommunication infrastructure and a burgeoning data center industry. China and the United States represent the largest national markets, with significant market share and substantial growth potential. The telecommunications segment accounts for the largest market share, while the data center segment shows the highest growth rate.
- Key Drivers in North America: High-speed internet penetration, 5G network deployment, and government initiatives.
- Key Drivers in Asia-Pacific: Rapid urbanization, increasing smartphone penetration, and government investments in infrastructure.
- Key Drivers in Europe: Expansion of 5G networks and rising demand from data centers.
- Market Share: North America (xx%), Asia-Pacific (xx%), Europe (xx%), Rest of World (xx%) in 2024.
Communication Optical Fiber Product Landscape
The communication optical fiber market offers a range of products, including single-mode fibers, multi-mode fibers, and specialty fibers, each tailored for specific applications. Recent innovations focus on enhancing bandwidth, improving transmission distance, and reducing signal loss. Key performance metrics include attenuation, bandwidth, and numerical aperture. Unique selling propositions include superior signal transmission capabilities, improved durability, and cost-effectiveness. Technological advancements include the development of advanced fiber designs with enhanced performance characteristics.
Key Drivers, Barriers & Challenges in Communication Optical Fiber
Key Drivers:
- Growing demand for high-speed internet and data transmission.
- Increasing adoption of cloud computing and data centers.
- Expansion of 5G and other wireless technologies.
- Government initiatives promoting digital infrastructure development.
Key Challenges and Restraints:
- Intense competition among established players and new entrants.
- Fluctuations in raw material prices (e.g., silica).
- Supply chain disruptions affecting manufacturing and deployment.
- Regulatory hurdles and permitting processes for fiber optic installations.
Emerging Opportunities in Communication Optical Fiber
- Expanding market in developing economies with limited fiber optic infrastructure.
- Growing demand for fiber optic sensors in various industrial applications.
- Development of new fiber optic technologies with enhanced performance characteristics (e.g., space division multiplexing).
- Integration of fiber optics with other technologies (e.g., IoT).
Growth Accelerators in the Communication Optical Fiber Industry
Technological breakthroughs in fiber optic design and manufacturing continue to drive market expansion. Strategic partnerships between manufacturers and telecom operators ensure efficient deployment and widespread adoption. Government subsidies and incentives stimulate infrastructure development in underdeveloped regions. Market expansion strategies into new geographic regions and applications will further fuel long-term growth.
Key Players Shaping the Communication Optical Fiber Market
- Furukawa
- Fujikura
- Corning
- Asahi Kasei
- AGC
- Toray Group
- Taihan
- Nanoptics
- Mitsubishi Chemical
- Jiangxi Daishing
- Jiangsu TX
- Jiangsu Etern
- Hengtong
- Futong
- Zhongtian Technology Advanced Materials
- Yangtze Optical Fibre and Cable Joint Stock Limited Company
Notable Milestones in Communication Optical Fiber Sector
- 2020: Launch of next-generation optical fibers with enhanced bandwidth capacity by Corning.
- 2021: Strategic partnership between Furukawa and a major telecommunication company to expand fiber optic network infrastructure in Southeast Asia.
- 2022: Acquisition of a smaller fiber optic manufacturer by Fujikura to expand its product portfolio.
- 2023: Introduction of innovative manufacturing techniques to reduce the cost of fiber optic cable production.
In-Depth Communication Optical Fiber Market Outlook
The communication optical fiber market is poised for continued strong growth throughout the forecast period, driven by the relentless expansion of data consumption, the widespread adoption of 5G, and the increasing demand for high-speed connectivity. Strategic investments in infrastructure upgrades, technological innovations, and strategic partnerships will play a critical role in shaping the market's future trajectory. Significant opportunities exist for companies that can effectively cater to the growing demand for high-bandwidth solutions and innovative applications, promising substantial returns on investment.
Communication Optical Fiber Segmentation
-
1. Application
- 1.1. Long Distance Communication
- 1.2. Medium Distance Communication
- 1.3. Short Distance Communication
-
2. Types
- 2.1. Glass Optical Fiber
- 2.2. Plastic Optical Fiber
Communication Optical Fiber Segmentation By Geography
-
1. North America
- 1.1. United States
- 1.2. Canada
- 1.3. Mexico
-
2. South America
- 2.1. Brazil
- 2.2. Argentina
- 2.3. Rest of South America
-
3. Europe
- 3.1. United Kingdom
- 3.2. Germany
- 3.3. France
- 3.4. Italy
- 3.5. Spain
- 3.6. Russia
- 3.7. Benelux
- 3.8. Nordics
- 3.9. Rest of Europe
-
4. Middle East & Africa
- 4.1. Turkey
- 4.2. Israel
- 4.3. GCC
- 4.4. North Africa
- 4.5. South Africa
- 4.6. Rest of Middle East & Africa
-
5. Asia Pacific
- 5.1. China
- 5.2. India
- 5.3. Japan
- 5.4. South Korea
- 5.5. ASEAN
- 5.6. Oceania
- 5.7. Rest of Asia Pacific
Communication Optical Fiber Regional Market Share
Geographic Coverage of Communication Optical Fiber
Communication Optical Fiber REPORT HIGHLIGHTS
| Aspects | Details |
|---|---|
| Study Period | 2020-2034 |
| Base Year | 2025 |
| Estimated Year | 2026 |
| Forecast Period | 2026-2034 |
| Historical Period | 2020-2025 |
| Growth Rate | CAGR of 6.86% from 2020-2034 |
| Segmentation |
|
Table of Contents
- 1. Introduction
- 1.1. Research Scope
- 1.2. Market Segmentation
- 1.3. Research Objective
- 1.4. Definitions and Assumptions
- 2. Executive Summary
- 2.1. Market Snapshot
- 3. Market Dynamics
- 3.1. Market Drivers
- 3.2. Market Restrains
- 3.3. Market Trends
- 3.4. Market Opportunities
- 4. Market Factor Analysis
- 4.1. Porters Five Forces
- 4.1.1. Bargaining Power of Suppliers
- 4.1.2. Bargaining Power of Buyers
- 4.1.3. Threat of New Entrants
- 4.1.4. Threat of Substitutes
- 4.1.5. Competitive Rivalry
- 4.2. PESTEL analysis
- 4.3. BCG Analysis
- 4.3.1. Stars (High Growth, High Market Share)
- 4.3.2. Cash Cows (Low Growth, High Market Share)
- 4.3.3. Question Mark (High Growth, Low Market Share)
- 4.3.4. Dogs (Low Growth, Low Market Share)
- 4.4. Ansoff Matrix Analysis
- 4.5. Supply Chain Analysis
- 4.6. Regulatory Landscape
- 4.7. Current Market Potential and Opportunity Assessment (TAM–SAM–SOM Framework)
- 4.8. VDR Analyst Note
- 4.1. Porters Five Forces
- 5. Market Analysis, Insights and Forecast 2021-2033
- 5.1. Market Analysis, Insights and Forecast - by Application
- 5.1.1. Long Distance Communication
- 5.1.2. Medium Distance Communication
- 5.1.3. Short Distance Communication
- 5.2. Market Analysis, Insights and Forecast - by Types
- 5.2.1. Glass Optical Fiber
- 5.2.2. Plastic Optical Fiber
- 5.3. Market Analysis, Insights and Forecast - by Region
- 5.3.1. North America
- 5.3.2. South America
- 5.3.3. Europe
- 5.3.4. Middle East & Africa
- 5.3.5. Asia Pacific
- 5.1. Market Analysis, Insights and Forecast - by Application
- 6. Global Communication Optical Fiber Analysis, Insights and Forecast, 2021-2033
- 6.1. Market Analysis, Insights and Forecast - by Application
- 6.1.1. Long Distance Communication
- 6.1.2. Medium Distance Communication
- 6.1.3. Short Distance Communication
- 6.2. Market Analysis, Insights and Forecast - by Types
- 6.2.1. Glass Optical Fiber
- 6.2.2. Plastic Optical Fiber
- 6.1. Market Analysis, Insights and Forecast - by Application
- 7. North America Communication Optical Fiber Analysis, Insights and Forecast, 2021-2033
- 7.1. Market Analysis, Insights and Forecast - by Application
- 7.1.1. Long Distance Communication
- 7.1.2. Medium Distance Communication
- 7.1.3. Short Distance Communication
- 7.2. Market Analysis, Insights and Forecast - by Types
- 7.2.1. Glass Optical Fiber
- 7.2.2. Plastic Optical Fiber
- 7.1. Market Analysis, Insights and Forecast - by Application
- 8. South America Communication Optical Fiber Analysis, Insights and Forecast, 2021-2033
- 8.1. Market Analysis, Insights and Forecast - by Application
- 8.1.1. Long Distance Communication
- 8.1.2. Medium Distance Communication
- 8.1.3. Short Distance Communication
- 8.2. Market Analysis, Insights and Forecast - by Types
- 8.2.1. Glass Optical Fiber
- 8.2.2. Plastic Optical Fiber
- 8.1. Market Analysis, Insights and Forecast - by Application
- 9. Europe Communication Optical Fiber Analysis, Insights and Forecast, 2021-2033
- 9.1. Market Analysis, Insights and Forecast - by Application
- 9.1.1. Long Distance Communication
- 9.1.2. Medium Distance Communication
- 9.1.3. Short Distance Communication
- 9.2. Market Analysis, Insights and Forecast - by Types
- 9.2.1. Glass Optical Fiber
- 9.2.2. Plastic Optical Fiber
- 9.1. Market Analysis, Insights and Forecast - by Application
- 10. Middle East & Africa Communication Optical Fiber Analysis, Insights and Forecast, 2021-2033
- 10.1. Market Analysis, Insights and Forecast - by Application
- 10.1.1. Long Distance Communication
- 10.1.2. Medium Distance Communication
- 10.1.3. Short Distance Communication
- 10.2. Market Analysis, Insights and Forecast - by Types
- 10.2.1. Glass Optical Fiber
- 10.2.2. Plastic Optical Fiber
- 10.1. Market Analysis, Insights and Forecast - by Application
- 11. Asia Pacific Communication Optical Fiber Analysis, Insights and Forecast, 2021-2033
- 11.1. Market Analysis, Insights and Forecast - by Application
- 11.1.1. Long Distance Communication
- 11.1.2. Medium Distance Communication
- 11.1.3. Short Distance Communication
- 11.2. Market Analysis, Insights and Forecast - by Types
- 11.2.1. Glass Optical Fiber
- 11.2.2. Plastic Optical Fiber
- 11.1. Market Analysis, Insights and Forecast - by Application
- 12. Competitive Analysis
- 12.1. Company Profiles
- 12.1.1 Furukawa
- 12.1.1.1. Company Overview
- 12.1.1.2. Products
- 12.1.1.3. Company Financials
- 12.1.1.4. SWOT Analysis
- 12.1.2 Fujikura
- 12.1.2.1. Company Overview
- 12.1.2.2. Products
- 12.1.2.3. Company Financials
- 12.1.2.4. SWOT Analysis
- 12.1.3 Corning
- 12.1.3.1. Company Overview
- 12.1.3.2. Products
- 12.1.3.3. Company Financials
- 12.1.3.4. SWOT Analysis
- 12.1.4 Asahi Kasei
- 12.1.4.1. Company Overview
- 12.1.4.2. Products
- 12.1.4.3. Company Financials
- 12.1.4.4. SWOT Analysis
- 12.1.5 AGC
- 12.1.5.1. Company Overview
- 12.1.5.2. Products
- 12.1.5.3. Company Financials
- 12.1.5.4. SWOT Analysis
- 12.1.6 Toray Group
- 12.1.6.1. Company Overview
- 12.1.6.2. Products
- 12.1.6.3. Company Financials
- 12.1.6.4. SWOT Analysis
- 12.1.7 Taihan
- 12.1.7.1. Company Overview
- 12.1.7.2. Products
- 12.1.7.3. Company Financials
- 12.1.7.4. SWOT Analysis
- 12.1.8 Nanoptics
- 12.1.8.1. Company Overview
- 12.1.8.2. Products
- 12.1.8.3. Company Financials
- 12.1.8.4. SWOT Analysis
- 12.1.9 Mitsubishi Chemical
- 12.1.9.1. Company Overview
- 12.1.9.2. Products
- 12.1.9.3. Company Financials
- 12.1.9.4. SWOT Analysis
- 12.1.10 Jiangxi Daishing
- 12.1.10.1. Company Overview
- 12.1.10.2. Products
- 12.1.10.3. Company Financials
- 12.1.10.4. SWOT Analysis
- 12.1.11 Jiangsu TX
- 12.1.11.1. Company Overview
- 12.1.11.2. Products
- 12.1.11.3. Company Financials
- 12.1.11.4. SWOT Analysis
- 12.1.12 Jiangsu Etern
- 12.1.12.1. Company Overview
- 12.1.12.2. Products
- 12.1.12.3. Company Financials
- 12.1.12.4. SWOT Analysis
- 12.1.13 Hengtong
- 12.1.13.1. Company Overview
- 12.1.13.2. Products
- 12.1.13.3. Company Financials
- 12.1.13.4. SWOT Analysis
- 12.1.14 Futong
- 12.1.14.1. Company Overview
- 12.1.14.2. Products
- 12.1.14.3. Company Financials
- 12.1.14.4. SWOT Analysis
- 12.1.15 Zhongtian Technology Advanced Materials
- 12.1.15.1. Company Overview
- 12.1.15.2. Products
- 12.1.15.3. Company Financials
- 12.1.15.4. SWOT Analysis
- 12.1.16 Yangtze Optical Fibre and Cable Joint Stock Limited Company
- 12.1.16.1. Company Overview
- 12.1.16.2. Products
- 12.1.16.3. Company Financials
- 12.1.16.4. SWOT Analysis
- 12.1.1 Furukawa
- 12.2. Market Entropy
- 12.2.1 Company's Key Areas Served
- 12.2.2 Recent Developments
- 12.3. Company Market Share Analysis 2025
- 12.3.1 Top 5 Companies Market Share Analysis
- 12.3.2 Top 3 Companies Market Share Analysis
- 12.4. List of Potential Customers
- 13. Research Methodology
List of Figures
- Figure 1: Global Communication Optical Fiber Revenue Breakdown (billion, %) by Region 2025 & 2033
- Figure 2: Global Communication Optical Fiber Volume Breakdown (K, %) by Region 2025 & 2033
- Figure 3: North America Communication Optical Fiber Revenue (billion), by Application 2025 & 2033
- Figure 4: North America Communication Optical Fiber Volume (K), by Application 2025 & 2033
- Figure 5: North America Communication Optical Fiber Revenue Share (%), by Application 2025 & 2033
- Figure 6: North America Communication Optical Fiber Volume Share (%), by Application 2025 & 2033
- Figure 7: North America Communication Optical Fiber Revenue (billion), by Types 2025 & 2033
- Figure 8: North America Communication Optical Fiber Volume (K), by Types 2025 & 2033
- Figure 9: North America Communication Optical Fiber Revenue Share (%), by Types 2025 & 2033
- Figure 10: North America Communication Optical Fiber Volume Share (%), by Types 2025 & 2033
- Figure 11: North America Communication Optical Fiber Revenue (billion), by Country 2025 & 2033
- Figure 12: North America Communication Optical Fiber Volume (K), by Country 2025 & 2033
- Figure 13: North America Communication Optical Fiber Revenue Share (%), by Country 2025 & 2033
- Figure 14: North America Communication Optical Fiber Volume Share (%), by Country 2025 & 2033
- Figure 15: South America Communication Optical Fiber Revenue (billion), by Application 2025 & 2033
- Figure 16: South America Communication Optical Fiber Volume (K), by Application 2025 & 2033
- Figure 17: South America Communication Optical Fiber Revenue Share (%), by Application 2025 & 2033
- Figure 18: South America Communication Optical Fiber Volume Share (%), by Application 2025 & 2033
- Figure 19: South America Communication Optical Fiber Revenue (billion), by Types 2025 & 2033
- Figure 20: South America Communication Optical Fiber Volume (K), by Types 2025 & 2033
- Figure 21: South America Communication Optical Fiber Revenue Share (%), by Types 2025 & 2033
- Figure 22: South America Communication Optical Fiber Volume Share (%), by Types 2025 & 2033
- Figure 23: South America Communication Optical Fiber Revenue (billion), by Country 2025 & 2033
- Figure 24: South America Communication Optical Fiber Volume (K), by Country 2025 & 2033
- Figure 25: South America Communication Optical Fiber Revenue Share (%), by Country 2025 & 2033
- Figure 26: South America Communication Optical Fiber Volume Share (%), by Country 2025 & 2033
- Figure 27: Europe Communication Optical Fiber Revenue (billion), by Application 2025 & 2033
- Figure 28: Europe Communication Optical Fiber Volume (K), by Application 2025 & 2033
- Figure 29: Europe Communication Optical Fiber Revenue Share (%), by Application 2025 & 2033
- Figure 30: Europe Communication Optical Fiber Volume Share (%), by Application 2025 & 2033
- Figure 31: Europe Communication Optical Fiber Revenue (billion), by Types 2025 & 2033
- Figure 32: Europe Communication Optical Fiber Volume (K), by Types 2025 & 2033
- Figure 33: Europe Communication Optical Fiber Revenue Share (%), by Types 2025 & 2033
- Figure 34: Europe Communication Optical Fiber Volume Share (%), by Types 2025 & 2033
- Figure 35: Europe Communication Optical Fiber Revenue (billion), by Country 2025 & 2033
- Figure 36: Europe Communication Optical Fiber Volume (K), by Country 2025 & 2033
- Figure 37: Europe Communication Optical Fiber Revenue Share (%), by Country 2025 & 2033
- Figure 38: Europe Communication Optical Fiber Volume Share (%), by Country 2025 & 2033
- Figure 39: Middle East & Africa Communication Optical Fiber Revenue (billion), by Application 2025 & 2033
- Figure 40: Middle East & Africa Communication Optical Fiber Volume (K), by Application 2025 & 2033
- Figure 41: Middle East & Africa Communication Optical Fiber Revenue Share (%), by Application 2025 & 2033
- Figure 42: Middle East & Africa Communication Optical Fiber Volume Share (%), by Application 2025 & 2033
- Figure 43: Middle East & Africa Communication Optical Fiber Revenue (billion), by Types 2025 & 2033
- Figure 44: Middle East & Africa Communication Optical Fiber Volume (K), by Types 2025 & 2033
- Figure 45: Middle East & Africa Communication Optical Fiber Revenue Share (%), by Types 2025 & 2033
- Figure 46: Middle East & Africa Communication Optical Fiber Volume Share (%), by Types 2025 & 2033
- Figure 47: Middle East & Africa Communication Optical Fiber Revenue (billion), by Country 2025 & 2033
- Figure 48: Middle East & Africa Communication Optical Fiber Volume (K), by Country 2025 & 2033
- Figure 49: Middle East & Africa Communication Optical Fiber Revenue Share (%), by Country 2025 & 2033
- Figure 50: Middle East & Africa Communication Optical Fiber Volume Share (%), by Country 2025 & 2033
- Figure 51: Asia Pacific Communication Optical Fiber Revenue (billion), by Application 2025 & 2033
- Figure 52: Asia Pacific Communication Optical Fiber Volume (K), by Application 2025 & 2033
- Figure 53: Asia Pacific Communication Optical Fiber Revenue Share (%), by Application 2025 & 2033
- Figure 54: Asia Pacific Communication Optical Fiber Volume Share (%), by Application 2025 & 2033
- Figure 55: Asia Pacific Communication Optical Fiber Revenue (billion), by Types 2025 & 2033
- Figure 56: Asia Pacific Communication Optical Fiber Volume (K), by Types 2025 & 2033
- Figure 57: Asia Pacific Communication Optical Fiber Revenue Share (%), by Types 2025 & 2033
- Figure 58: Asia Pacific Communication Optical Fiber Volume Share (%), by Types 2025 & 2033
- Figure 59: Asia Pacific Communication Optical Fiber Revenue (billion), by Country 2025 & 2033
- Figure 60: Asia Pacific Communication Optical Fiber Volume (K), by Country 2025 & 2033
- Figure 61: Asia Pacific Communication Optical Fiber Revenue Share (%), by Country 2025 & 2033
- Figure 62: Asia Pacific Communication Optical Fiber Volume Share (%), by Country 2025 & 2033
List of Tables
- Table 1: Global Communication Optical Fiber Revenue billion Forecast, by Application 2020 & 2033
- Table 2: Global Communication Optical Fiber Volume K Forecast, by Application 2020 & 2033
- Table 3: Global Communication Optical Fiber Revenue billion Forecast, by Types 2020 & 2033
- Table 4: Global Communication Optical Fiber Volume K Forecast, by Types 2020 & 2033
- Table 5: Global Communication Optical Fiber Revenue billion Forecast, by Region 2020 & 2033
- Table 6: Global Communication Optical Fiber Volume K Forecast, by Region 2020 & 2033
- Table 7: Global Communication Optical Fiber Revenue billion Forecast, by Application 2020 & 2033
- Table 8: Global Communication Optical Fiber Volume K Forecast, by Application 2020 & 2033
- Table 9: Global Communication Optical Fiber Revenue billion Forecast, by Types 2020 & 2033
- Table 10: Global Communication Optical Fiber Volume K Forecast, by Types 2020 & 2033
- Table 11: Global Communication Optical Fiber Revenue billion Forecast, by Country 2020 & 2033
- Table 12: Global Communication Optical Fiber Volume K Forecast, by Country 2020 & 2033
- Table 13: United States Communication Optical Fiber Revenue (billion) Forecast, by Application 2020 & 2033
- Table 14: United States Communication Optical Fiber Volume (K) Forecast, by Application 2020 & 2033
- Table 15: Canada Communication Optical Fiber Revenue (billion) Forecast, by Application 2020 & 2033
- Table 16: Canada Communication Optical Fiber Volume (K) Forecast, by Application 2020 & 2033
- Table 17: Mexico Communication Optical Fiber Revenue (billion) Forecast, by Application 2020 & 2033
- Table 18: Mexico Communication Optical Fiber Volume (K) Forecast, by Application 2020 & 2033
- Table 19: Global Communication Optical Fiber Revenue billion Forecast, by Application 2020 & 2033
- Table 20: Global Communication Optical Fiber Volume K Forecast, by Application 2020 & 2033
- Table 21: Global Communication Optical Fiber Revenue billion Forecast, by Types 2020 & 2033
- Table 22: Global Communication Optical Fiber Volume K Forecast, by Types 2020 & 2033
- Table 23: Global Communication Optical Fiber Revenue billion Forecast, by Country 2020 & 2033
- Table 24: Global Communication Optical Fiber Volume K Forecast, by Country 2020 & 2033
- Table 25: Brazil Communication Optical Fiber Revenue (billion) Forecast, by Application 2020 & 2033
- Table 26: Brazil Communication Optical Fiber Volume (K) Forecast, by Application 2020 & 2033
- Table 27: Argentina Communication Optical Fiber Revenue (billion) Forecast, by Application 2020 & 2033
- Table 28: Argentina Communication Optical Fiber Volume (K) Forecast, by Application 2020 & 2033
- Table 29: Rest of South America Communication Optical Fiber Revenue (billion) Forecast, by Application 2020 & 2033
- Table 30: Rest of South America Communication Optical Fiber Volume (K) Forecast, by Application 2020 & 2033
- Table 31: Global Communication Optical Fiber Revenue billion Forecast, by Application 2020 & 2033
- Table 32: Global Communication Optical Fiber Volume K Forecast, by Application 2020 & 2033
- Table 33: Global Communication Optical Fiber Revenue billion Forecast, by Types 2020 & 2033
- Table 34: Global Communication Optical Fiber Volume K Forecast, by Types 2020 & 2033
- Table 35: Global Communication Optical Fiber Revenue billion Forecast, by Country 2020 & 2033
- Table 36: Global Communication Optical Fiber Volume K Forecast, by Country 2020 & 2033
- Table 37: United Kingdom Communication Optical Fiber Revenue (billion) Forecast, by Application 2020 & 2033
- Table 38: United Kingdom Communication Optical Fiber Volume (K) Forecast, by Application 2020 & 2033
- Table 39: Germany Communication Optical Fiber Revenue (billion) Forecast, by Application 2020 & 2033
- Table 40: Germany Communication Optical Fiber Volume (K) Forecast, by Application 2020 & 2033
- Table 41: France Communication Optical Fiber Revenue (billion) Forecast, by Application 2020 & 2033
- Table 42: France Communication Optical Fiber Volume (K) Forecast, by Application 2020 & 2033
- Table 43: Italy Communication Optical Fiber Revenue (billion) Forecast, by Application 2020 & 2033
- Table 44: Italy Communication Optical Fiber Volume (K) Forecast, by Application 2020 & 2033
- Table 45: Spain Communication Optical Fiber Revenue (billion) Forecast, by Application 2020 & 2033
- Table 46: Spain Communication Optical Fiber Volume (K) Forecast, by Application 2020 & 2033
- Table 47: Russia Communication Optical Fiber Revenue (billion) Forecast, by Application 2020 & 2033
- Table 48: Russia Communication Optical Fiber Volume (K) Forecast, by Application 2020 & 2033
- Table 49: Benelux Communication Optical Fiber Revenue (billion) Forecast, by Application 2020 & 2033
- Table 50: Benelux Communication Optical Fiber Volume (K) Forecast, by Application 2020 & 2033
- Table 51: Nordics Communication Optical Fiber Revenue (billion) Forecast, by Application 2020 & 2033
- Table 52: Nordics Communication Optical Fiber Volume (K) Forecast, by Application 2020 & 2033
- Table 53: Rest of Europe Communication Optical Fiber Revenue (billion) Forecast, by Application 2020 & 2033
- Table 54: Rest of Europe Communication Optical Fiber Volume (K) Forecast, by Application 2020 & 2033
- Table 55: Global Communication Optical Fiber Revenue billion Forecast, by Application 2020 & 2033
- Table 56: Global Communication Optical Fiber Volume K Forecast, by Application 2020 & 2033
- Table 57: Global Communication Optical Fiber Revenue billion Forecast, by Types 2020 & 2033
- Table 58: Global Communication Optical Fiber Volume K Forecast, by Types 2020 & 2033
- Table 59: Global Communication Optical Fiber Revenue billion Forecast, by Country 2020 & 2033
- Table 60: Global Communication Optical Fiber Volume K Forecast, by Country 2020 & 2033
- Table 61: Turkey Communication Optical Fiber Revenue (billion) Forecast, by Application 2020 & 2033
- Table 62: Turkey Communication Optical Fiber Volume (K) Forecast, by Application 2020 & 2033
- Table 63: Israel Communication Optical Fiber Revenue (billion) Forecast, by Application 2020 & 2033
- Table 64: Israel Communication Optical Fiber Volume (K) Forecast, by Application 2020 & 2033
- Table 65: GCC Communication Optical Fiber Revenue (billion) Forecast, by Application 2020 & 2033
- Table 66: GCC Communication Optical Fiber Volume (K) Forecast, by Application 2020 & 2033
- Table 67: North Africa Communication Optical Fiber Revenue (billion) Forecast, by Application 2020 & 2033
- Table 68: North Africa Communication Optical Fiber Volume (K) Forecast, by Application 2020 & 2033
- Table 69: South Africa Communication Optical Fiber Revenue (billion) Forecast, by Application 2020 & 2033
- Table 70: South Africa Communication Optical Fiber Volume (K) Forecast, by Application 2020 & 2033
- Table 71: Rest of Middle East & Africa Communication Optical Fiber Revenue (billion) Forecast, by Application 2020 & 2033
- Table 72: Rest of Middle East & Africa Communication Optical Fiber Volume (K) Forecast, by Application 2020 & 2033
- Table 73: Global Communication Optical Fiber Revenue billion Forecast, by Application 2020 & 2033
- Table 74: Global Communication Optical Fiber Volume K Forecast, by Application 2020 & 2033
- Table 75: Global Communication Optical Fiber Revenue billion Forecast, by Types 2020 & 2033
- Table 76: Global Communication Optical Fiber Volume K Forecast, by Types 2020 & 2033
- Table 77: Global Communication Optical Fiber Revenue billion Forecast, by Country 2020 & 2033
- Table 78: Global Communication Optical Fiber Volume K Forecast, by Country 2020 & 2033
- Table 79: China Communication Optical Fiber Revenue (billion) Forecast, by Application 2020 & 2033
- Table 80: China Communication Optical Fiber Volume (K) Forecast, by Application 2020 & 2033
- Table 81: India Communication Optical Fiber Revenue (billion) Forecast, by Application 2020 & 2033
- Table 82: India Communication Optical Fiber Volume (K) Forecast, by Application 2020 & 2033
- Table 83: Japan Communication Optical Fiber Revenue (billion) Forecast, by Application 2020 & 2033
- Table 84: Japan Communication Optical Fiber Volume (K) Forecast, by Application 2020 & 2033
- Table 85: South Korea Communication Optical Fiber Revenue (billion) Forecast, by Application 2020 & 2033
- Table 86: South Korea Communication Optical Fiber Volume (K) Forecast, by Application 2020 & 2033
- Table 87: ASEAN Communication Optical Fiber Revenue (billion) Forecast, by Application 2020 & 2033
- Table 88: ASEAN Communication Optical Fiber Volume (K) Forecast, by Application 2020 & 2033
- Table 89: Oceania Communication Optical Fiber Revenue (billion) Forecast, by Application 2020 & 2033
- Table 90: Oceania Communication Optical Fiber Volume (K) Forecast, by Application 2020 & 2033
- Table 91: Rest of Asia Pacific Communication Optical Fiber Revenue (billion) Forecast, by Application 2020 & 2033
- Table 92: Rest of Asia Pacific Communication Optical Fiber Volume (K) Forecast, by Application 2020 & 2033
Frequently Asked Questions
1. What is the projected Compound Annual Growth Rate (CAGR) of the Communication Optical Fiber?
The projected CAGR is approximately 6.86%.
2. Which companies are prominent players in the Communication Optical Fiber?
Key companies in the market include Furukawa, Fujikura, Corning, Asahi Kasei, AGC, Toray Group, Taihan, Nanoptics, Mitsubishi Chemical, Jiangxi Daishing, Jiangsu TX, Jiangsu Etern, Hengtong, Futong, Zhongtian Technology Advanced Materials, Yangtze Optical Fibre and Cable Joint Stock Limited Company.
3. What are the main segments of the Communication Optical Fiber?
The market segments include Application, Types.
4. Can you provide details about the market size?
The market size is estimated to be USD 10.74 billion as of 2022.
5. What are some drivers contributing to market growth?
N/A
6. What are the notable trends driving market growth?
N/A
7. Are there any restraints impacting market growth?
N/A
8. Can you provide examples of recent developments in the market?
N/A
9. What pricing options are available for accessing the report?
Pricing options include single-user, multi-user, and enterprise licenses priced at USD 3950.00, USD 5925.00, and USD 7900.00 respectively.
10. Is the market size provided in terms of value or volume?
The market size is provided in terms of value, measured in billion and volume, measured in K.
11. Are there any specific market keywords associated with the report?
Yes, the market keyword associated with the report is "Communication Optical Fiber," which aids in identifying and referencing the specific market segment covered.
12. How do I determine which pricing option suits my needs best?
The pricing options vary based on user requirements and access needs. Individual users may opt for single-user licenses, while businesses requiring broader access may choose multi-user or enterprise licenses for cost-effective access to the report.
13. Are there any additional resources or data provided in the Communication Optical Fiber report?
While the report offers comprehensive insights, it's advisable to review the specific contents or supplementary materials provided to ascertain if additional resources or data are available.
14. How can I stay updated on further developments or reports in the Communication Optical Fiber?
To stay informed about further developments, trends, and reports in the Communication Optical Fiber, consider subscribing to industry newsletters, following relevant companies and organizations, or regularly checking reputable industry news sources and publications.
Methodology
Step 1 - Identification of Relevant Samples Size from Population Database


Step 2 - Approaches for Defining Global Market Size (Value, Volume* & Price*)

Note*: In applicable scenarios
Step 3 - Data Sources
Primary Research
- Web Analytics
- Survey Reports
- Research Institute
- Latest Research Reports
- Opinion Leaders
Secondary Research
- Annual Reports
- White Paper
- Latest Press Release
- Industry Association
- Paid Database
- Investor Presentations

Step 4 - Data Triangulation
Involves using different sources of information in order to increase the validity of a study
These sources are likely to be stakeholders in a program - participants, other researchers, program staff, other community members, and so on.
Then we put all data in single framework & apply various statistical tools to find out the dynamic on the market.
During the analysis stage, feedback from the stakeholder groups would be compared to determine areas of agreement as well as areas of divergence

