
Key Insights
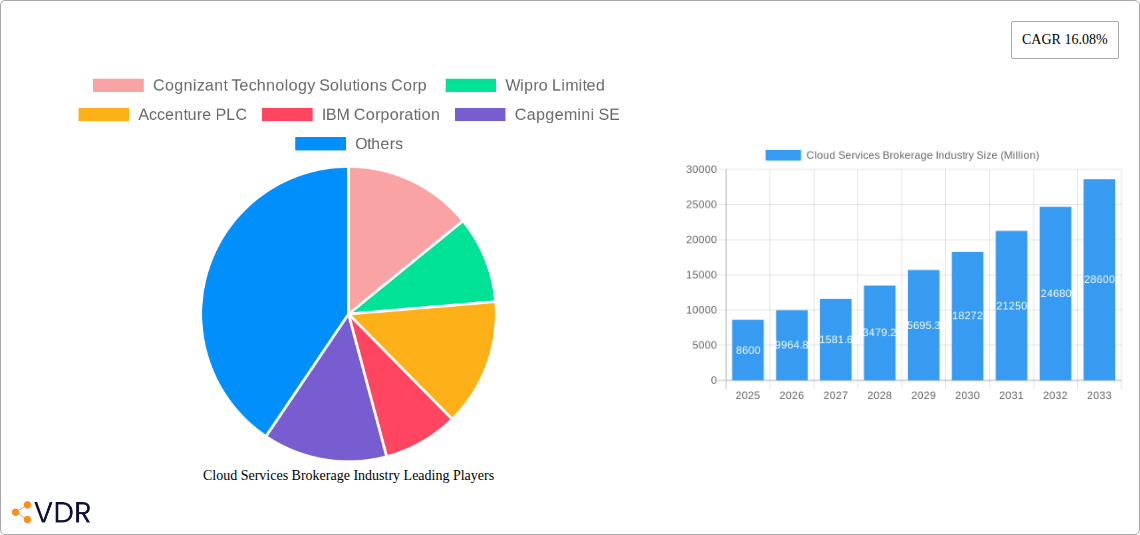
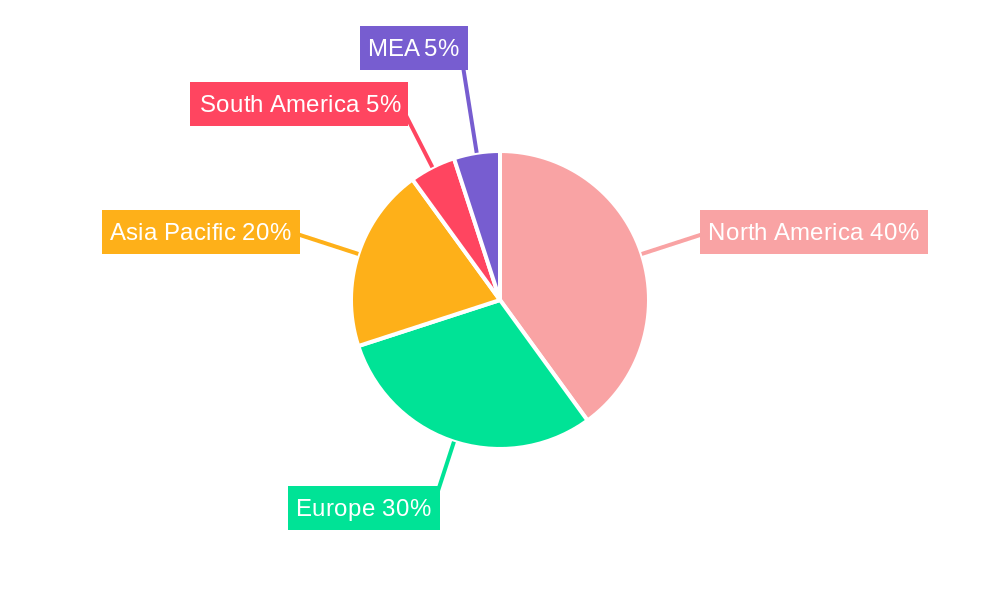
The Cloud Services Brokerage (CSB) market is experiencing robust growth, projected to reach \$8.60 billion in 2025 and maintain a Compound Annual Growth Rate (CAGR) of 16.08% from 2025 to 2033. This expansion is fueled by several key drivers. The increasing adoption of multi-cloud strategies by enterprises necessitates efficient cloud management, a core function of CSB platforms. Furthermore, the rising complexity of cloud environments, coupled with a shortage of skilled cloud professionals, creates a significant demand for the specialized services offered by CSBs. Cost optimization is another critical factor, as CSBs help organizations negotiate better pricing and consolidate their cloud spending across multiple providers. The market is segmented by deployment model (public, private, hybrid), enterprise size (SME, large enterprise), end-user industry (IT & Telecom, BFSI, Retail, Healthcare, Government, Manufacturing), and platform (internal/external brokerage). Large enterprises are currently driving the most significant revenue, but SMEs are expected to show strong growth as cloud adoption accelerates within this segment. North America and Europe currently hold the largest market share, but the Asia-Pacific region is poised for significant expansion given its rapidly growing digital economy and increasing cloud adoption.
The competitive landscape is characterized by a mix of established technology giants (IBM, Accenture, Cognizant) and specialized CSB providers (Rightscale). These companies are constantly innovating to offer comprehensive solutions, including automated provisioning, cost management tools, security enhancements, and compliance support. However, challenges remain. Security concerns surrounding multi-cloud environments and the potential for vendor lock-in present obstacles for widespread adoption. Furthermore, integrating CSB solutions with existing IT infrastructure can be complex and require substantial investment. Despite these challenges, the long-term outlook for the CSB market remains positive, driven by the ongoing shift to cloud computing and the increasing need for efficient and secure cloud management. Future growth will likely be shaped by advancements in automation, artificial intelligence (AI), and the emergence of new cloud-native technologies.
Cloud Services Brokerage Industry Market Report: 2019-2033
This comprehensive report provides a detailed analysis of the Cloud Services Brokerage industry, encompassing market dynamics, growth trends, key players, and future outlook. With a study period spanning 2019-2033, a base year of 2025, and a forecast period of 2025-2033, this report is an invaluable resource for industry professionals, investors, and strategic decision-makers. The report segments the market by deployment model (public, private, hybrid), enterprise size (SME, large enterprise), end-user industry (IT & Telecom, BFSI, Retail, Healthcare, Government, Manufacturing, Others), and platform (internal, external). The total market size is predicted to reach xx Million by 2033.
Cloud Services Brokerage Industry Market Dynamics & Structure
The Cloud Services Brokerage market is characterized by a moderately concentrated landscape, with key players such as Cognizant Technology Solutions Corp, Wipro Limited, Accenture PLC, IBM Corporation, and Capgemini SE holding significant market share. The market's growth is fueled by technological innovations like AI-driven automation and enhanced security features. However, regulatory compliance and data privacy concerns pose challenges. The market witnesses frequent mergers and acquisitions (M&A) activities, with an estimated xx deals concluded in the historical period (2019-2024). This consolidation reflects the industry's maturation and the pursuit of economies of scale.
- Market Concentration: Moderately concentrated, with top 5 players holding approximately xx% market share in 2024.
- Technological Innovation: AI-powered automation, enhanced security, and improved interoperability are key drivers.
- Regulatory Framework: Compliance with data privacy regulations (GDPR, CCPA) is a significant factor impacting market growth.
- Competitive Product Substitutes: Direct cloud service providers pose competitive pressure.
- End-User Demographics: Large enterprises are currently the dominant segment, but SME adoption is rapidly increasing.
- M&A Trends: Consolidation is evident, with an average of xx M&A deals annually during 2019-2024.
Cloud Services Brokerage Industry Growth Trends & Insights
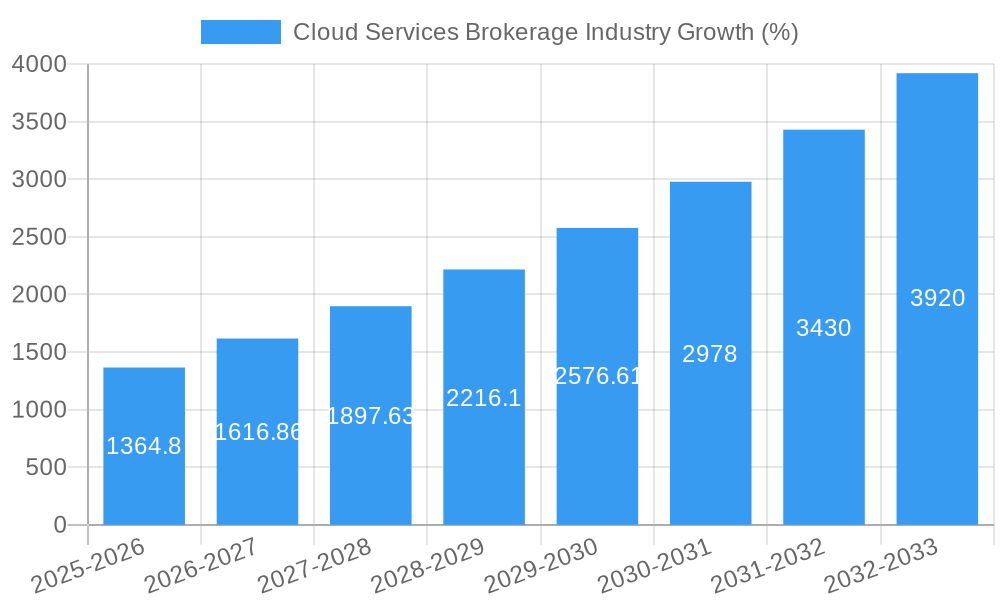
The Cloud Services Brokerage market has experienced significant growth throughout the historical period (2019-2024), driven by the increasing adoption of cloud computing across various industries. The market size reached xx Million in 2024, exhibiting a CAGR of xx% during this period. This growth is projected to continue during the forecast period (2025-2033), with a projected CAGR of xx%, reaching xx Million by 2033. Factors contributing to this growth include the increasing demand for agility, scalability, and cost optimization offered by cloud services. Technological disruptions, such as serverless computing and edge computing, further fuel market expansion. Consumer behavior shifts towards digital transformation and increased reliance on cloud-based solutions are also key drivers. Market penetration is expected to increase from xx% in 2024 to xx% by 2033.
Dominant Regions, Countries, or Segments in Cloud Services Brokerage Industry
North America currently holds the largest market share in the Cloud Services Brokerage industry, driven by high cloud adoption rates and the presence of major technology companies. However, the Asia-Pacific region is projected to exhibit the fastest growth rate during the forecast period due to increasing digitalization and expanding cloud infrastructure. Within segments, the Large Enterprise segment dominates due to higher spending capacity and complex IT requirements. The Public Cloud deployment model holds the largest market share, driven by its cost-effectiveness and scalability. The IT and Telecom and BFSI sectors are the leading end-user industries, leveraging cloud services for improved efficiency and innovation.
- Key Drivers:
- North America: High cloud adoption rates, presence of major tech companies.
- Asia-Pacific: Rapid digitalization, expanding cloud infrastructure.
- Large Enterprise Segment: Higher spending capacity, complex IT needs.
- Public Cloud: Cost-effectiveness, scalability.
- IT & Telecom and BFSI: High demand for cloud-based solutions.
Cloud Services Brokerage Industry Product Landscape
The Cloud Services Brokerage market offers a diverse range of products and services, including cloud consulting, brokerage, management, and security solutions. These solutions are tailored to specific industry needs and deployment models. Key product innovations focus on enhancing automation, security, and interoperability. The unique selling propositions include improved cost optimization, streamlined vendor management, and enhanced security posture. Technological advancements such as AI-powered automation and serverless technologies are further refining the product landscape.
Key Drivers, Barriers & Challenges in Cloud Services Brokerage Industry
Key Drivers: The rising adoption of cloud computing, the need for cost optimization, and the increasing demand for agility and scalability are primary drivers. Government initiatives promoting digital transformation also contribute to market growth. Technological advancements, such as AI and automation, are further enhancing efficiency and capabilities.
Key Challenges: Security concerns, data privacy regulations, and the complexity of managing multi-cloud environments pose challenges. Competition from direct cloud service providers also creates pressure. Supply chain disruptions can impact service delivery, leading to potential revenue losses. Estimated xx million in potential revenue loss due to supply chain issues was recorded in 2024.
Emerging Opportunities in Cloud Services Brokerage Industry
Emerging opportunities lie in leveraging emerging technologies like serverless computing and edge computing. Untapped markets in developing economies present significant growth potential. The increasing demand for specialized cloud services tailored to specific industries, such as healthcare and finance, creates further opportunities. Focus on developing customized solutions and improving customer experience will be vital.
Growth Accelerators in the Cloud Services Brokerage Industry Industry
Strategic partnerships with cloud service providers and technology vendors are key growth accelerators. Investing in research and development to improve technological capabilities is crucial. Expanding into new geographic markets and targeting untapped customer segments will drive further growth. Focusing on delivering value-added services, such as AI-driven automation and enhanced security features, will further enhance competitiveness.
Key Players Shaping the Cloud Services Brokerage Industry Market
- Cognizant Technology Solutions Corp
- Wipro Limited
- Accenture PLC
- IBM Corporation
- Capgemini SE
- NTT Data Inc
- Rightscale Inc
- DXC Technology Company
- NEC Corporation
Notable Milestones in Cloud Services Brokerage Industry Sector
- October 2022: Deloitte introduced SuperLedger, an AI-powered platform for transaction processing and financial reporting, enhancing efficiency and data reliability within the cloud brokerage ecosystem.
- January 2023: EY launched a retail solution leveraging Microsoft Cloud, connecting consumer touchpoints and enabling data-driven insights via AI and advanced analytics. This highlights the increasing integration of cloud brokerage services with specific industry needs.
In-Depth Cloud Services Brokerage Industry Market Outlook
The Cloud Services Brokerage market is poised for continued growth, driven by increasing cloud adoption, technological advancements, and strategic partnerships. The market's future potential lies in leveraging emerging technologies and expanding into new geographic regions. Companies that focus on innovation, customer experience, and strategic alliances will be best positioned for success in this dynamic market.
Cloud Services Brokerage Industry Segmentation
-
1. Platform
- 1.1. Internal Cloud Services Brokerage
- 1.2. External Cloud Services Brokerage
-
2. Deployment Model
- 2.1. Public
- 2.2. Private
- 2.3. Hybrid
-
3. Enterprise
- 3.1. Small and Medium Enterprise (SME)
- 3.2. Large Enterprise
-
4. End-user Industry
- 4.1. IT and Telecom
- 4.2. BFSI
- 4.3. Retail
- 4.4. Healthcare
- 4.5. Government
- 4.6. Manufacturing
- 4.7. Other End-user Industries
Cloud Services Brokerage Industry Segmentation By Geography
-
1. North America
- 1.1. United States
- 1.2. Canada
-
2. Europe
- 2.1. Germany
- 2.2. United Kingdom
- 2.3. France
-
3. Asia
- 3.1. China
- 3.2. Japan
- 3.3. India
- 4. Australia and New Zealand
-
5. Latin America
- 5.1. Mexico
- 5.2. Brazil
- 5.3. Argentina
-
6. Middle East and Africa
- 6.1. United Arab Emirates
- 6.2. Saudi Arabia
Cloud Services Brokerage Industry REPORT HIGHLIGHTS
| Aspects | Details |
|---|---|
| Study Period | 2019-2033 |
| Base Year | 2024 |
| Estimated Year | 2025 |
| Forecast Period | 2025-2033 |
| Historical Period | 2019-2024 |
| Growth Rate | CAGR of 16.08% from 2019-2033 |
| Segmentation |
|
Table of Contents
- 1. Introduction
- 1.1. Research Scope
- 1.2. Market Segmentation
- 1.3. Research Methodology
- 1.4. Definitions and Assumptions
- 2. Executive Summary
- 2.1. Introduction
- 3. Market Dynamics
- 3.1. Introduction
- 3.2. Market Drivers
- 3.2.1. Increasing Adoption of Hybrid and Multi-cloud Environment; Increasing Adoption of Cloud Computing Services
- 3.3. Market Restrains
- 3.3.1. Lack of Awareness and Security Concerns
- 3.4. Market Trends
- 3.4.1. Internal Cloud Services Brokerage is Expected to Hold the Major Share
- 4. Market Factor Analysis
- 4.1. Porters Five Forces
- 4.2. Supply/Value Chain
- 4.3. PESTEL analysis
- 4.4. Market Entropy
- 4.5. Patent/Trademark Analysis
- 5. Global Cloud Services Brokerage Industry Analysis, Insights and Forecast, 2019-2031
- 5.1. Market Analysis, Insights and Forecast - by Platform
- 5.1.1. Internal Cloud Services Brokerage
- 5.1.2. External Cloud Services Brokerage
- 5.2. Market Analysis, Insights and Forecast - by Deployment Model
- 5.2.1. Public
- 5.2.2. Private
- 5.2.3. Hybrid
- 5.3. Market Analysis, Insights and Forecast - by Enterprise
- 5.3.1. Small and Medium Enterprise (SME)
- 5.3.2. Large Enterprise
- 5.4. Market Analysis, Insights and Forecast - by End-user Industry
- 5.4.1. IT and Telecom
- 5.4.2. BFSI
- 5.4.3. Retail
- 5.4.4. Healthcare
- 5.4.5. Government
- 5.4.6. Manufacturing
- 5.4.7. Other End-user Industries
- 5.5. Market Analysis, Insights and Forecast - by Region
- 5.5.1. North America
- 5.5.2. Europe
- 5.5.3. Asia
- 5.5.4. Australia and New Zealand
- 5.5.5. Latin America
- 5.5.6. Middle East and Africa
- 5.1. Market Analysis, Insights and Forecast - by Platform
- 6. North America Cloud Services Brokerage Industry Analysis, Insights and Forecast, 2019-2031
- 6.1. Market Analysis, Insights and Forecast - by Platform
- 6.1.1. Internal Cloud Services Brokerage
- 6.1.2. External Cloud Services Brokerage
- 6.2. Market Analysis, Insights and Forecast - by Deployment Model
- 6.2.1. Public
- 6.2.2. Private
- 6.2.3. Hybrid
- 6.3. Market Analysis, Insights and Forecast - by Enterprise
- 6.3.1. Small and Medium Enterprise (SME)
- 6.3.2. Large Enterprise
- 6.4. Market Analysis, Insights and Forecast - by End-user Industry
- 6.4.1. IT and Telecom
- 6.4.2. BFSI
- 6.4.3. Retail
- 6.4.4. Healthcare
- 6.4.5. Government
- 6.4.6. Manufacturing
- 6.4.7. Other End-user Industries
- 6.1. Market Analysis, Insights and Forecast - by Platform
- 7. Europe Cloud Services Brokerage Industry Analysis, Insights and Forecast, 2019-2031
- 7.1. Market Analysis, Insights and Forecast - by Platform
- 7.1.1. Internal Cloud Services Brokerage
- 7.1.2. External Cloud Services Brokerage
- 7.2. Market Analysis, Insights and Forecast - by Deployment Model
- 7.2.1. Public
- 7.2.2. Private
- 7.2.3. Hybrid
- 7.3. Market Analysis, Insights and Forecast - by Enterprise
- 7.3.1. Small and Medium Enterprise (SME)
- 7.3.2. Large Enterprise
- 7.4. Market Analysis, Insights and Forecast - by End-user Industry
- 7.4.1. IT and Telecom
- 7.4.2. BFSI
- 7.4.3. Retail
- 7.4.4. Healthcare
- 7.4.5. Government
- 7.4.6. Manufacturing
- 7.4.7. Other End-user Industries
- 7.1. Market Analysis, Insights and Forecast - by Platform
- 8. Asia Cloud Services Brokerage Industry Analysis, Insights and Forecast, 2019-2031
- 8.1. Market Analysis, Insights and Forecast - by Platform
- 8.1.1. Internal Cloud Services Brokerage
- 8.1.2. External Cloud Services Brokerage
- 8.2. Market Analysis, Insights and Forecast - by Deployment Model
- 8.2.1. Public
- 8.2.2. Private
- 8.2.3. Hybrid
- 8.3. Market Analysis, Insights and Forecast - by Enterprise
- 8.3.1. Small and Medium Enterprise (SME)
- 8.3.2. Large Enterprise
- 8.4. Market Analysis, Insights and Forecast - by End-user Industry
- 8.4.1. IT and Telecom
- 8.4.2. BFSI
- 8.4.3. Retail
- 8.4.4. Healthcare
- 8.4.5. Government
- 8.4.6. Manufacturing
- 8.4.7. Other End-user Industries
- 8.1. Market Analysis, Insights and Forecast - by Platform
- 9. Australia and New Zealand Cloud Services Brokerage Industry Analysis, Insights and Forecast, 2019-2031
- 9.1. Market Analysis, Insights and Forecast - by Platform
- 9.1.1. Internal Cloud Services Brokerage
- 9.1.2. External Cloud Services Brokerage
- 9.2. Market Analysis, Insights and Forecast - by Deployment Model
- 9.2.1. Public
- 9.2.2. Private
- 9.2.3. Hybrid
- 9.3. Market Analysis, Insights and Forecast - by Enterprise
- 9.3.1. Small and Medium Enterprise (SME)
- 9.3.2. Large Enterprise
- 9.4. Market Analysis, Insights and Forecast - by End-user Industry
- 9.4.1. IT and Telecom
- 9.4.2. BFSI
- 9.4.3. Retail
- 9.4.4. Healthcare
- 9.4.5. Government
- 9.4.6. Manufacturing
- 9.4.7. Other End-user Industries
- 9.1. Market Analysis, Insights and Forecast - by Platform
- 10. Latin America Cloud Services Brokerage Industry Analysis, Insights and Forecast, 2019-2031
- 10.1. Market Analysis, Insights and Forecast - by Platform
- 10.1.1. Internal Cloud Services Brokerage
- 10.1.2. External Cloud Services Brokerage
- 10.2. Market Analysis, Insights and Forecast - by Deployment Model
- 10.2.1. Public
- 10.2.2. Private
- 10.2.3. Hybrid
- 10.3. Market Analysis, Insights and Forecast - by Enterprise
- 10.3.1. Small and Medium Enterprise (SME)
- 10.3.2. Large Enterprise
- 10.4. Market Analysis, Insights and Forecast - by End-user Industry
- 10.4.1. IT and Telecom
- 10.4.2. BFSI
- 10.4.3. Retail
- 10.4.4. Healthcare
- 10.4.5. Government
- 10.4.6. Manufacturing
- 10.4.7. Other End-user Industries
- 10.1. Market Analysis, Insights and Forecast - by Platform
- 11. Middle East and Africa Cloud Services Brokerage Industry Analysis, Insights and Forecast, 2019-2031
- 11.1. Market Analysis, Insights and Forecast - by Platform
- 11.1.1. Internal Cloud Services Brokerage
- 11.1.2. External Cloud Services Brokerage
- 11.2. Market Analysis, Insights and Forecast - by Deployment Model
- 11.2.1. Public
- 11.2.2. Private
- 11.2.3. Hybrid
- 11.3. Market Analysis, Insights and Forecast - by Enterprise
- 11.3.1. Small and Medium Enterprise (SME)
- 11.3.2. Large Enterprise
- 11.4. Market Analysis, Insights and Forecast - by End-user Industry
- 11.4.1. IT and Telecom
- 11.4.2. BFSI
- 11.4.3. Retail
- 11.4.4. Healthcare
- 11.4.5. Government
- 11.4.6. Manufacturing
- 11.4.7. Other End-user Industries
- 11.1. Market Analysis, Insights and Forecast - by Platform
- 12. North America Cloud Services Brokerage Industry Analysis, Insights and Forecast, 2019-2031
- 12.1. Market Analysis, Insights and Forecast - By Country/Sub-region
- 12.1.1 United States
- 12.1.2 Canada
- 12.1.3 Mexico
- 13. Europe Cloud Services Brokerage Industry Analysis, Insights and Forecast, 2019-2031
- 13.1. Market Analysis, Insights and Forecast - By Country/Sub-region
- 13.1.1 Germany
- 13.1.2 United Kingdom
- 13.1.3 France
- 13.1.4 Spain
- 13.1.5 Italy
- 13.1.6 Spain
- 13.1.7 Belgium
- 13.1.8 Netherland
- 13.1.9 Nordics
- 13.1.10 Rest of Europe
- 14. Asia Pacific Cloud Services Brokerage Industry Analysis, Insights and Forecast, 2019-2031
- 14.1. Market Analysis, Insights and Forecast - By Country/Sub-region
- 14.1.1 China
- 14.1.2 Japan
- 14.1.3 India
- 14.1.4 South Korea
- 14.1.5 Southeast Asia
- 14.1.6 Australia
- 14.1.7 Indonesia
- 14.1.8 Phillipes
- 14.1.9 Singapore
- 14.1.10 Thailandc
- 14.1.11 Rest of Asia Pacific
- 15. South America Cloud Services Brokerage Industry Analysis, Insights and Forecast, 2019-2031
- 15.1. Market Analysis, Insights and Forecast - By Country/Sub-region
- 15.1.1 Brazil
- 15.1.2 Argentina
- 15.1.3 Peru
- 15.1.4 Chile
- 15.1.5 Colombia
- 15.1.6 Ecuador
- 15.1.7 Venezuela
- 15.1.8 Rest of South America
- 16. North America Cloud Services Brokerage Industry Analysis, Insights and Forecast, 2019-2031
- 16.1. Market Analysis, Insights and Forecast - By Country/Sub-region
- 16.1.1 United States
- 16.1.2 Canada
- 16.1.3 Mexico
- 17. MEA Cloud Services Brokerage Industry Analysis, Insights and Forecast, 2019-2031
- 17.1. Market Analysis, Insights and Forecast - By Country/Sub-region
- 17.1.1 United Arab Emirates
- 17.1.2 Saudi Arabia
- 17.1.3 South Africa
- 17.1.4 Rest of Middle East and Africa
- 18. Competitive Analysis
- 18.1. Global Market Share Analysis 2024
- 18.2. Company Profiles
- 18.2.1 Cognizant Technology Solutions Corp
- 18.2.1.1. Overview
- 18.2.1.2. Products
- 18.2.1.3. SWOT Analysis
- 18.2.1.4. Recent Developments
- 18.2.1.5. Financials (Based on Availability)
- 18.2.2 Wipro Limited
- 18.2.2.1. Overview
- 18.2.2.2. Products
- 18.2.2.3. SWOT Analysis
- 18.2.2.4. Recent Developments
- 18.2.2.5. Financials (Based on Availability)
- 18.2.3 Accenture PLC
- 18.2.3.1. Overview
- 18.2.3.2. Products
- 18.2.3.3. SWOT Analysis
- 18.2.3.4. Recent Developments
- 18.2.3.5. Financials (Based on Availability)
- 18.2.4 IBM Corporation
- 18.2.4.1. Overview
- 18.2.4.2. Products
- 18.2.4.3. SWOT Analysis
- 18.2.4.4. Recent Developments
- 18.2.4.5. Financials (Based on Availability)
- 18.2.5 Capgemini SE
- 18.2.5.1. Overview
- 18.2.5.2. Products
- 18.2.5.3. SWOT Analysis
- 18.2.5.4. Recent Developments
- 18.2.5.5. Financials (Based on Availability)
- 18.2.6 NTT Data Inc
- 18.2.6.1. Overview
- 18.2.6.2. Products
- 18.2.6.3. SWOT Analysis
- 18.2.6.4. Recent Developments
- 18.2.6.5. Financials (Based on Availability)
- 18.2.7 Rightscale Inc
- 18.2.7.1. Overview
- 18.2.7.2. Products
- 18.2.7.3. SWOT Analysis
- 18.2.7.4. Recent Developments
- 18.2.7.5. Financials (Based on Availability)
- 18.2.8 DXC Technology Company
- 18.2.8.1. Overview
- 18.2.8.2. Products
- 18.2.8.3. SWOT Analysis
- 18.2.8.4. Recent Developments
- 18.2.8.5. Financials (Based on Availability)
- 18.2.9 NEC Corporation
- 18.2.9.1. Overview
- 18.2.9.2. Products
- 18.2.9.3. SWOT Analysis
- 18.2.9.4. Recent Developments
- 18.2.9.5. Financials (Based on Availability)
- 18.2.1 Cognizant Technology Solutions Corp
List of Figures
- Figure 1: Global Cloud Services Brokerage Industry Revenue Breakdown (Million, %) by Region 2024 & 2032
- Figure 2: Global Cloud Services Brokerage Industry Volume Breakdown (K Unit, %) by Region 2024 & 2032
- Figure 3: North America Cloud Services Brokerage Industry Revenue (Million), by Country 2024 & 2032
- Figure 4: North America Cloud Services Brokerage Industry Volume (K Unit), by Country 2024 & 2032
- Figure 5: North America Cloud Services Brokerage Industry Revenue Share (%), by Country 2024 & 2032
- Figure 6: North America Cloud Services Brokerage Industry Volume Share (%), by Country 2024 & 2032
- Figure 7: Europe Cloud Services Brokerage Industry Revenue (Million), by Country 2024 & 2032
- Figure 8: Europe Cloud Services Brokerage Industry Volume (K Unit), by Country 2024 & 2032
- Figure 9: Europe Cloud Services Brokerage Industry Revenue Share (%), by Country 2024 & 2032
- Figure 10: Europe Cloud Services Brokerage Industry Volume Share (%), by Country 2024 & 2032
- Figure 11: Asia Pacific Cloud Services Brokerage Industry Revenue (Million), by Country 2024 & 2032
- Figure 12: Asia Pacific Cloud Services Brokerage Industry Volume (K Unit), by Country 2024 & 2032
- Figure 13: Asia Pacific Cloud Services Brokerage Industry Revenue Share (%), by Country 2024 & 2032
- Figure 14: Asia Pacific Cloud Services Brokerage Industry Volume Share (%), by Country 2024 & 2032
- Figure 15: South America Cloud Services Brokerage Industry Revenue (Million), by Country 2024 & 2032
- Figure 16: South America Cloud Services Brokerage Industry Volume (K Unit), by Country 2024 & 2032
- Figure 17: South America Cloud Services Brokerage Industry Revenue Share (%), by Country 2024 & 2032
- Figure 18: South America Cloud Services Brokerage Industry Volume Share (%), by Country 2024 & 2032
- Figure 19: North America Cloud Services Brokerage Industry Revenue (Million), by Country 2024 & 2032
- Figure 20: North America Cloud Services Brokerage Industry Volume (K Unit), by Country 2024 & 2032
- Figure 21: North America Cloud Services Brokerage Industry Revenue Share (%), by Country 2024 & 2032
- Figure 22: North America Cloud Services Brokerage Industry Volume Share (%), by Country 2024 & 2032
- Figure 23: MEA Cloud Services Brokerage Industry Revenue (Million), by Country 2024 & 2032
- Figure 24: MEA Cloud Services Brokerage Industry Volume (K Unit), by Country 2024 & 2032
- Figure 25: MEA Cloud Services Brokerage Industry Revenue Share (%), by Country 2024 & 2032
- Figure 26: MEA Cloud Services Brokerage Industry Volume Share (%), by Country 2024 & 2032
- Figure 27: North America Cloud Services Brokerage Industry Revenue (Million), by Platform 2024 & 2032
- Figure 28: North America Cloud Services Brokerage Industry Volume (K Unit), by Platform 2024 & 2032
- Figure 29: North America Cloud Services Brokerage Industry Revenue Share (%), by Platform 2024 & 2032
- Figure 30: North America Cloud Services Brokerage Industry Volume Share (%), by Platform 2024 & 2032
- Figure 31: North America Cloud Services Brokerage Industry Revenue (Million), by Deployment Model 2024 & 2032
- Figure 32: North America Cloud Services Brokerage Industry Volume (K Unit), by Deployment Model 2024 & 2032
- Figure 33: North America Cloud Services Brokerage Industry Revenue Share (%), by Deployment Model 2024 & 2032
- Figure 34: North America Cloud Services Brokerage Industry Volume Share (%), by Deployment Model 2024 & 2032
- Figure 35: North America Cloud Services Brokerage Industry Revenue (Million), by Enterprise 2024 & 2032
- Figure 36: North America Cloud Services Brokerage Industry Volume (K Unit), by Enterprise 2024 & 2032
- Figure 37: North America Cloud Services Brokerage Industry Revenue Share (%), by Enterprise 2024 & 2032
- Figure 38: North America Cloud Services Brokerage Industry Volume Share (%), by Enterprise 2024 & 2032
- Figure 39: North America Cloud Services Brokerage Industry Revenue (Million), by End-user Industry 2024 & 2032
- Figure 40: North America Cloud Services Brokerage Industry Volume (K Unit), by End-user Industry 2024 & 2032
- Figure 41: North America Cloud Services Brokerage Industry Revenue Share (%), by End-user Industry 2024 & 2032
- Figure 42: North America Cloud Services Brokerage Industry Volume Share (%), by End-user Industry 2024 & 2032
- Figure 43: North America Cloud Services Brokerage Industry Revenue (Million), by Country 2024 & 2032
- Figure 44: North America Cloud Services Brokerage Industry Volume (K Unit), by Country 2024 & 2032
- Figure 45: North America Cloud Services Brokerage Industry Revenue Share (%), by Country 2024 & 2032
- Figure 46: North America Cloud Services Brokerage Industry Volume Share (%), by Country 2024 & 2032
- Figure 47: Europe Cloud Services Brokerage Industry Revenue (Million), by Platform 2024 & 2032
- Figure 48: Europe Cloud Services Brokerage Industry Volume (K Unit), by Platform 2024 & 2032
- Figure 49: Europe Cloud Services Brokerage Industry Revenue Share (%), by Platform 2024 & 2032
- Figure 50: Europe Cloud Services Brokerage Industry Volume Share (%), by Platform 2024 & 2032
- Figure 51: Europe Cloud Services Brokerage Industry Revenue (Million), by Deployment Model 2024 & 2032
- Figure 52: Europe Cloud Services Brokerage Industry Volume (K Unit), by Deployment Model 2024 & 2032
- Figure 53: Europe Cloud Services Brokerage Industry Revenue Share (%), by Deployment Model 2024 & 2032
- Figure 54: Europe Cloud Services Brokerage Industry Volume Share (%), by Deployment Model 2024 & 2032
- Figure 55: Europe Cloud Services Brokerage Industry Revenue (Million), by Enterprise 2024 & 2032
- Figure 56: Europe Cloud Services Brokerage Industry Volume (K Unit), by Enterprise 2024 & 2032
- Figure 57: Europe Cloud Services Brokerage Industry Revenue Share (%), by Enterprise 2024 & 2032
- Figure 58: Europe Cloud Services Brokerage Industry Volume Share (%), by Enterprise 2024 & 2032
- Figure 59: Europe Cloud Services Brokerage Industry Revenue (Million), by End-user Industry 2024 & 2032
- Figure 60: Europe Cloud Services Brokerage Industry Volume (K Unit), by End-user Industry 2024 & 2032
- Figure 61: Europe Cloud Services Brokerage Industry Revenue Share (%), by End-user Industry 2024 & 2032
- Figure 62: Europe Cloud Services Brokerage Industry Volume Share (%), by End-user Industry 2024 & 2032
- Figure 63: Europe Cloud Services Brokerage Industry Revenue (Million), by Country 2024 & 2032
- Figure 64: Europe Cloud Services Brokerage Industry Volume (K Unit), by Country 2024 & 2032
- Figure 65: Europe Cloud Services Brokerage Industry Revenue Share (%), by Country 2024 & 2032
- Figure 66: Europe Cloud Services Brokerage Industry Volume Share (%), by Country 2024 & 2032
- Figure 67: Asia Cloud Services Brokerage Industry Revenue (Million), by Platform 2024 & 2032
- Figure 68: Asia Cloud Services Brokerage Industry Volume (K Unit), by Platform 2024 & 2032
- Figure 69: Asia Cloud Services Brokerage Industry Revenue Share (%), by Platform 2024 & 2032
- Figure 70: Asia Cloud Services Brokerage Industry Volume Share (%), by Platform 2024 & 2032
- Figure 71: Asia Cloud Services Brokerage Industry Revenue (Million), by Deployment Model 2024 & 2032
- Figure 72: Asia Cloud Services Brokerage Industry Volume (K Unit), by Deployment Model 2024 & 2032
- Figure 73: Asia Cloud Services Brokerage Industry Revenue Share (%), by Deployment Model 2024 & 2032
- Figure 74: Asia Cloud Services Brokerage Industry Volume Share (%), by Deployment Model 2024 & 2032
- Figure 75: Asia Cloud Services Brokerage Industry Revenue (Million), by Enterprise 2024 & 2032
- Figure 76: Asia Cloud Services Brokerage Industry Volume (K Unit), by Enterprise 2024 & 2032
- Figure 77: Asia Cloud Services Brokerage Industry Revenue Share (%), by Enterprise 2024 & 2032
- Figure 78: Asia Cloud Services Brokerage Industry Volume Share (%), by Enterprise 2024 & 2032
- Figure 79: Asia Cloud Services Brokerage Industry Revenue (Million), by End-user Industry 2024 & 2032
- Figure 80: Asia Cloud Services Brokerage Industry Volume (K Unit), by End-user Industry 2024 & 2032
- Figure 81: Asia Cloud Services Brokerage Industry Revenue Share (%), by End-user Industry 2024 & 2032
- Figure 82: Asia Cloud Services Brokerage Industry Volume Share (%), by End-user Industry 2024 & 2032
- Figure 83: Asia Cloud Services Brokerage Industry Revenue (Million), by Country 2024 & 2032
- Figure 84: Asia Cloud Services Brokerage Industry Volume (K Unit), by Country 2024 & 2032
- Figure 85: Asia Cloud Services Brokerage Industry Revenue Share (%), by Country 2024 & 2032
- Figure 86: Asia Cloud Services Brokerage Industry Volume Share (%), by Country 2024 & 2032
- Figure 87: Australia and New Zealand Cloud Services Brokerage Industry Revenue (Million), by Platform 2024 & 2032
- Figure 88: Australia and New Zealand Cloud Services Brokerage Industry Volume (K Unit), by Platform 2024 & 2032
- Figure 89: Australia and New Zealand Cloud Services Brokerage Industry Revenue Share (%), by Platform 2024 & 2032
- Figure 90: Australia and New Zealand Cloud Services Brokerage Industry Volume Share (%), by Platform 2024 & 2032
- Figure 91: Australia and New Zealand Cloud Services Brokerage Industry Revenue (Million), by Deployment Model 2024 & 2032
- Figure 92: Australia and New Zealand Cloud Services Brokerage Industry Volume (K Unit), by Deployment Model 2024 & 2032
- Figure 93: Australia and New Zealand Cloud Services Brokerage Industry Revenue Share (%), by Deployment Model 2024 & 2032
- Figure 94: Australia and New Zealand Cloud Services Brokerage Industry Volume Share (%), by Deployment Model 2024 & 2032
- Figure 95: Australia and New Zealand Cloud Services Brokerage Industry Revenue (Million), by Enterprise 2024 & 2032
- Figure 96: Australia and New Zealand Cloud Services Brokerage Industry Volume (K Unit), by Enterprise 2024 & 2032
- Figure 97: Australia and New Zealand Cloud Services Brokerage Industry Revenue Share (%), by Enterprise 2024 & 2032
- Figure 98: Australia and New Zealand Cloud Services Brokerage Industry Volume Share (%), by Enterprise 2024 & 2032
- Figure 99: Australia and New Zealand Cloud Services Brokerage Industry Revenue (Million), by End-user Industry 2024 & 2032
- Figure 100: Australia and New Zealand Cloud Services Brokerage Industry Volume (K Unit), by End-user Industry 2024 & 2032
- Figure 101: Australia and New Zealand Cloud Services Brokerage Industry Revenue Share (%), by End-user Industry 2024 & 2032
- Figure 102: Australia and New Zealand Cloud Services Brokerage Industry Volume Share (%), by End-user Industry 2024 & 2032
- Figure 103: Australia and New Zealand Cloud Services Brokerage Industry Revenue (Million), by Country 2024 & 2032
- Figure 104: Australia and New Zealand Cloud Services Brokerage Industry Volume (K Unit), by Country 2024 & 2032
- Figure 105: Australia and New Zealand Cloud Services Brokerage Industry Revenue Share (%), by Country 2024 & 2032
- Figure 106: Australia and New Zealand Cloud Services Brokerage Industry Volume Share (%), by Country 2024 & 2032
- Figure 107: Latin America Cloud Services Brokerage Industry Revenue (Million), by Platform 2024 & 2032
- Figure 108: Latin America Cloud Services Brokerage Industry Volume (K Unit), by Platform 2024 & 2032
- Figure 109: Latin America Cloud Services Brokerage Industry Revenue Share (%), by Platform 2024 & 2032
- Figure 110: Latin America Cloud Services Brokerage Industry Volume Share (%), by Platform 2024 & 2032
- Figure 111: Latin America Cloud Services Brokerage Industry Revenue (Million), by Deployment Model 2024 & 2032
- Figure 112: Latin America Cloud Services Brokerage Industry Volume (K Unit), by Deployment Model 2024 & 2032
- Figure 113: Latin America Cloud Services Brokerage Industry Revenue Share (%), by Deployment Model 2024 & 2032
- Figure 114: Latin America Cloud Services Brokerage Industry Volume Share (%), by Deployment Model 2024 & 2032
- Figure 115: Latin America Cloud Services Brokerage Industry Revenue (Million), by Enterprise 2024 & 2032
- Figure 116: Latin America Cloud Services Brokerage Industry Volume (K Unit), by Enterprise 2024 & 2032
- Figure 117: Latin America Cloud Services Brokerage Industry Revenue Share (%), by Enterprise 2024 & 2032
- Figure 118: Latin America Cloud Services Brokerage Industry Volume Share (%), by Enterprise 2024 & 2032
- Figure 119: Latin America Cloud Services Brokerage Industry Revenue (Million), by End-user Industry 2024 & 2032
- Figure 120: Latin America Cloud Services Brokerage Industry Volume (K Unit), by End-user Industry 2024 & 2032
- Figure 121: Latin America Cloud Services Brokerage Industry Revenue Share (%), by End-user Industry 2024 & 2032
- Figure 122: Latin America Cloud Services Brokerage Industry Volume Share (%), by End-user Industry 2024 & 2032
- Figure 123: Latin America Cloud Services Brokerage Industry Revenue (Million), by Country 2024 & 2032
- Figure 124: Latin America Cloud Services Brokerage Industry Volume (K Unit), by Country 2024 & 2032
- Figure 125: Latin America Cloud Services Brokerage Industry Revenue Share (%), by Country 2024 & 2032
- Figure 126: Latin America Cloud Services Brokerage Industry Volume Share (%), by Country 2024 & 2032
- Figure 127: Middle East and Africa Cloud Services Brokerage Industry Revenue (Million), by Platform 2024 & 2032
- Figure 128: Middle East and Africa Cloud Services Brokerage Industry Volume (K Unit), by Platform 2024 & 2032
- Figure 129: Middle East and Africa Cloud Services Brokerage Industry Revenue Share (%), by Platform 2024 & 2032
- Figure 130: Middle East and Africa Cloud Services Brokerage Industry Volume Share (%), by Platform 2024 & 2032
- Figure 131: Middle East and Africa Cloud Services Brokerage Industry Revenue (Million), by Deployment Model 2024 & 2032
- Figure 132: Middle East and Africa Cloud Services Brokerage Industry Volume (K Unit), by Deployment Model 2024 & 2032
- Figure 133: Middle East and Africa Cloud Services Brokerage Industry Revenue Share (%), by Deployment Model 2024 & 2032
- Figure 134: Middle East and Africa Cloud Services Brokerage Industry Volume Share (%), by Deployment Model 2024 & 2032
- Figure 135: Middle East and Africa Cloud Services Brokerage Industry Revenue (Million), by Enterprise 2024 & 2032
- Figure 136: Middle East and Africa Cloud Services Brokerage Industry Volume (K Unit), by Enterprise 2024 & 2032
- Figure 137: Middle East and Africa Cloud Services Brokerage Industry Revenue Share (%), by Enterprise 2024 & 2032
- Figure 138: Middle East and Africa Cloud Services Brokerage Industry Volume Share (%), by Enterprise 2024 & 2032
- Figure 139: Middle East and Africa Cloud Services Brokerage Industry Revenue (Million), by End-user Industry 2024 & 2032
- Figure 140: Middle East and Africa Cloud Services Brokerage Industry Volume (K Unit), by End-user Industry 2024 & 2032
- Figure 141: Middle East and Africa Cloud Services Brokerage Industry Revenue Share (%), by End-user Industry 2024 & 2032
- Figure 142: Middle East and Africa Cloud Services Brokerage Industry Volume Share (%), by End-user Industry 2024 & 2032
- Figure 143: Middle East and Africa Cloud Services Brokerage Industry Revenue (Million), by Country 2024 & 2032
- Figure 144: Middle East and Africa Cloud Services Brokerage Industry Volume (K Unit), by Country 2024 & 2032
- Figure 145: Middle East and Africa Cloud Services Brokerage Industry Revenue Share (%), by Country 2024 & 2032
- Figure 146: Middle East and Africa Cloud Services Brokerage Industry Volume Share (%), by Country 2024 & 2032
List of Tables
- Table 1: Global Cloud Services Brokerage Industry Revenue Million Forecast, by Region 2019 & 2032
- Table 2: Global Cloud Services Brokerage Industry Volume K Unit Forecast, by Region 2019 & 2032
- Table 3: Global Cloud Services Brokerage Industry Revenue Million Forecast, by Platform 2019 & 2032
- Table 4: Global Cloud Services Brokerage Industry Volume K Unit Forecast, by Platform 2019 & 2032
- Table 5: Global Cloud Services Brokerage Industry Revenue Million Forecast, by Deployment Model 2019 & 2032
- Table 6: Global Cloud Services Brokerage Industry Volume K Unit Forecast, by Deployment Model 2019 & 2032
- Table 7: Global Cloud Services Brokerage Industry Revenue Million Forecast, by Enterprise 2019 & 2032
- Table 8: Global Cloud Services Brokerage Industry Volume K Unit Forecast, by Enterprise 2019 & 2032
- Table 9: Global Cloud Services Brokerage Industry Revenue Million Forecast, by End-user Industry 2019 & 2032
- Table 10: Global Cloud Services Brokerage Industry Volume K Unit Forecast, by End-user Industry 2019 & 2032
- Table 11: Global Cloud Services Brokerage Industry Revenue Million Forecast, by Region 2019 & 2032
- Table 12: Global Cloud Services Brokerage Industry Volume K Unit Forecast, by Region 2019 & 2032
- Table 13: Global Cloud Services Brokerage Industry Revenue Million Forecast, by Country 2019 & 2032
- Table 14: Global Cloud Services Brokerage Industry Volume K Unit Forecast, by Country 2019 & 2032
- Table 15: United States Cloud Services Brokerage Industry Revenue (Million) Forecast, by Application 2019 & 2032
- Table 16: United States Cloud Services Brokerage Industry Volume (K Unit) Forecast, by Application 2019 & 2032
- Table 17: Canada Cloud Services Brokerage Industry Revenue (Million) Forecast, by Application 2019 & 2032
- Table 18: Canada Cloud Services Brokerage Industry Volume (K Unit) Forecast, by Application 2019 & 2032
- Table 19: Mexico Cloud Services Brokerage Industry Revenue (Million) Forecast, by Application 2019 & 2032
- Table 20: Mexico Cloud Services Brokerage Industry Volume (K Unit) Forecast, by Application 2019 & 2032
- Table 21: Global Cloud Services Brokerage Industry Revenue Million Forecast, by Country 2019 & 2032
- Table 22: Global Cloud Services Brokerage Industry Volume K Unit Forecast, by Country 2019 & 2032
- Table 23: Germany Cloud Services Brokerage Industry Revenue (Million) Forecast, by Application 2019 & 2032
- Table 24: Germany Cloud Services Brokerage Industry Volume (K Unit) Forecast, by Application 2019 & 2032
- Table 25: United Kingdom Cloud Services Brokerage Industry Revenue (Million) Forecast, by Application 2019 & 2032
- Table 26: United Kingdom Cloud Services Brokerage Industry Volume (K Unit) Forecast, by Application 2019 & 2032
- Table 27: France Cloud Services Brokerage Industry Revenue (Million) Forecast, by Application 2019 & 2032
- Table 28: France Cloud Services Brokerage Industry Volume (K Unit) Forecast, by Application 2019 & 2032
- Table 29: Spain Cloud Services Brokerage Industry Revenue (Million) Forecast, by Application 2019 & 2032
- Table 30: Spain Cloud Services Brokerage Industry Volume (K Unit) Forecast, by Application 2019 & 2032
- Table 31: Italy Cloud Services Brokerage Industry Revenue (Million) Forecast, by Application 2019 & 2032
- Table 32: Italy Cloud Services Brokerage Industry Volume (K Unit) Forecast, by Application 2019 & 2032
- Table 33: Spain Cloud Services Brokerage Industry Revenue (Million) Forecast, by Application 2019 & 2032
- Table 34: Spain Cloud Services Brokerage Industry Volume (K Unit) Forecast, by Application 2019 & 2032
- Table 35: Belgium Cloud Services Brokerage Industry Revenue (Million) Forecast, by Application 2019 & 2032
- Table 36: Belgium Cloud Services Brokerage Industry Volume (K Unit) Forecast, by Application 2019 & 2032
- Table 37: Netherland Cloud Services Brokerage Industry Revenue (Million) Forecast, by Application 2019 & 2032
- Table 38: Netherland Cloud Services Brokerage Industry Volume (K Unit) Forecast, by Application 2019 & 2032
- Table 39: Nordics Cloud Services Brokerage Industry Revenue (Million) Forecast, by Application 2019 & 2032
- Table 40: Nordics Cloud Services Brokerage Industry Volume (K Unit) Forecast, by Application 2019 & 2032
- Table 41: Rest of Europe Cloud Services Brokerage Industry Revenue (Million) Forecast, by Application 2019 & 2032
- Table 42: Rest of Europe Cloud Services Brokerage Industry Volume (K Unit) Forecast, by Application 2019 & 2032
- Table 43: Global Cloud Services Brokerage Industry Revenue Million Forecast, by Country 2019 & 2032
- Table 44: Global Cloud Services Brokerage Industry Volume K Unit Forecast, by Country 2019 & 2032
- Table 45: China Cloud Services Brokerage Industry Revenue (Million) Forecast, by Application 2019 & 2032
- Table 46: China Cloud Services Brokerage Industry Volume (K Unit) Forecast, by Application 2019 & 2032
- Table 47: Japan Cloud Services Brokerage Industry Revenue (Million) Forecast, by Application 2019 & 2032
- Table 48: Japan Cloud Services Brokerage Industry Volume (K Unit) Forecast, by Application 2019 & 2032
- Table 49: India Cloud Services Brokerage Industry Revenue (Million) Forecast, by Application 2019 & 2032
- Table 50: India Cloud Services Brokerage Industry Volume (K Unit) Forecast, by Application 2019 & 2032
- Table 51: South Korea Cloud Services Brokerage Industry Revenue (Million) Forecast, by Application 2019 & 2032
- Table 52: South Korea Cloud Services Brokerage Industry Volume (K Unit) Forecast, by Application 2019 & 2032
- Table 53: Southeast Asia Cloud Services Brokerage Industry Revenue (Million) Forecast, by Application 2019 & 2032
- Table 54: Southeast Asia Cloud Services Brokerage Industry Volume (K Unit) Forecast, by Application 2019 & 2032
- Table 55: Australia Cloud Services Brokerage Industry Revenue (Million) Forecast, by Application 2019 & 2032
- Table 56: Australia Cloud Services Brokerage Industry Volume (K Unit) Forecast, by Application 2019 & 2032
- Table 57: Indonesia Cloud Services Brokerage Industry Revenue (Million) Forecast, by Application 2019 & 2032
- Table 58: Indonesia Cloud Services Brokerage Industry Volume (K Unit) Forecast, by Application 2019 & 2032
- Table 59: Phillipes Cloud Services Brokerage Industry Revenue (Million) Forecast, by Application 2019 & 2032
- Table 60: Phillipes Cloud Services Brokerage Industry Volume (K Unit) Forecast, by Application 2019 & 2032
- Table 61: Singapore Cloud Services Brokerage Industry Revenue (Million) Forecast, by Application 2019 & 2032
- Table 62: Singapore Cloud Services Brokerage Industry Volume (K Unit) Forecast, by Application 2019 & 2032
- Table 63: Thailandc Cloud Services Brokerage Industry Revenue (Million) Forecast, by Application 2019 & 2032
- Table 64: Thailandc Cloud Services Brokerage Industry Volume (K Unit) Forecast, by Application 2019 & 2032
- Table 65: Rest of Asia Pacific Cloud Services Brokerage Industry Revenue (Million) Forecast, by Application 2019 & 2032
- Table 66: Rest of Asia Pacific Cloud Services Brokerage Industry Volume (K Unit) Forecast, by Application 2019 & 2032
- Table 67: Global Cloud Services Brokerage Industry Revenue Million Forecast, by Country 2019 & 2032
- Table 68: Global Cloud Services Brokerage Industry Volume K Unit Forecast, by Country 2019 & 2032
- Table 69: Brazil Cloud Services Brokerage Industry Revenue (Million) Forecast, by Application 2019 & 2032
- Table 70: Brazil Cloud Services Brokerage Industry Volume (K Unit) Forecast, by Application 2019 & 2032
- Table 71: Argentina Cloud Services Brokerage Industry Revenue (Million) Forecast, by Application 2019 & 2032
- Table 72: Argentina Cloud Services Brokerage Industry Volume (K Unit) Forecast, by Application 2019 & 2032
- Table 73: Peru Cloud Services Brokerage Industry Revenue (Million) Forecast, by Application 2019 & 2032
- Table 74: Peru Cloud Services Brokerage Industry Volume (K Unit) Forecast, by Application 2019 & 2032
- Table 75: Chile Cloud Services Brokerage Industry Revenue (Million) Forecast, by Application 2019 & 2032
- Table 76: Chile Cloud Services Brokerage Industry Volume (K Unit) Forecast, by Application 2019 & 2032
- Table 77: Colombia Cloud Services Brokerage Industry Revenue (Million) Forecast, by Application 2019 & 2032
- Table 78: Colombia Cloud Services Brokerage Industry Volume (K Unit) Forecast, by Application 2019 & 2032
- Table 79: Ecuador Cloud Services Brokerage Industry Revenue (Million) Forecast, by Application 2019 & 2032
- Table 80: Ecuador Cloud Services Brokerage Industry Volume (K Unit) Forecast, by Application 2019 & 2032
- Table 81: Venezuela Cloud Services Brokerage Industry Revenue (Million) Forecast, by Application 2019 & 2032
- Table 82: Venezuela Cloud Services Brokerage Industry Volume (K Unit) Forecast, by Application 2019 & 2032
- Table 83: Rest of South America Cloud Services Brokerage Industry Revenue (Million) Forecast, by Application 2019 & 2032
- Table 84: Rest of South America Cloud Services Brokerage Industry Volume (K Unit) Forecast, by Application 2019 & 2032
- Table 85: Global Cloud Services Brokerage Industry Revenue Million Forecast, by Country 2019 & 2032
- Table 86: Global Cloud Services Brokerage Industry Volume K Unit Forecast, by Country 2019 & 2032
- Table 87: United States Cloud Services Brokerage Industry Revenue (Million) Forecast, by Application 2019 & 2032
- Table 88: United States Cloud Services Brokerage Industry Volume (K Unit) Forecast, by Application 2019 & 2032
- Table 89: Canada Cloud Services Brokerage Industry Revenue (Million) Forecast, by Application 2019 & 2032
- Table 90: Canada Cloud Services Brokerage Industry Volume (K Unit) Forecast, by Application 2019 & 2032
- Table 91: Mexico Cloud Services Brokerage Industry Revenue (Million) Forecast, by Application 2019 & 2032
- Table 92: Mexico Cloud Services Brokerage Industry Volume (K Unit) Forecast, by Application 2019 & 2032
- Table 93: Global Cloud Services Brokerage Industry Revenue Million Forecast, by Country 2019 & 2032
- Table 94: Global Cloud Services Brokerage Industry Volume K Unit Forecast, by Country 2019 & 2032
- Table 95: United Arab Emirates Cloud Services Brokerage Industry Revenue (Million) Forecast, by Application 2019 & 2032
- Table 96: United Arab Emirates Cloud Services Brokerage Industry Volume (K Unit) Forecast, by Application 2019 & 2032
- Table 97: Saudi Arabia Cloud Services Brokerage Industry Revenue (Million) Forecast, by Application 2019 & 2032
- Table 98: Saudi Arabia Cloud Services Brokerage Industry Volume (K Unit) Forecast, by Application 2019 & 2032
- Table 99: South Africa Cloud Services Brokerage Industry Revenue (Million) Forecast, by Application 2019 & 2032
- Table 100: South Africa Cloud Services Brokerage Industry Volume (K Unit) Forecast, by Application 2019 & 2032
- Table 101: Rest of Middle East and Africa Cloud Services Brokerage Industry Revenue (Million) Forecast, by Application 2019 & 2032
- Table 102: Rest of Middle East and Africa Cloud Services Brokerage Industry Volume (K Unit) Forecast, by Application 2019 & 2032
- Table 103: Global Cloud Services Brokerage Industry Revenue Million Forecast, by Platform 2019 & 2032
- Table 104: Global Cloud Services Brokerage Industry Volume K Unit Forecast, by Platform 2019 & 2032
- Table 105: Global Cloud Services Brokerage Industry Revenue Million Forecast, by Deployment Model 2019 & 2032
- Table 106: Global Cloud Services Brokerage Industry Volume K Unit Forecast, by Deployment Model 2019 & 2032
- Table 107: Global Cloud Services Brokerage Industry Revenue Million Forecast, by Enterprise 2019 & 2032
- Table 108: Global Cloud Services Brokerage Industry Volume K Unit Forecast, by Enterprise 2019 & 2032
- Table 109: Global Cloud Services Brokerage Industry Revenue Million Forecast, by End-user Industry 2019 & 2032
- Table 110: Global Cloud Services Brokerage Industry Volume K Unit Forecast, by End-user Industry 2019 & 2032
- Table 111: Global Cloud Services Brokerage Industry Revenue Million Forecast, by Country 2019 & 2032
- Table 112: Global Cloud Services Brokerage Industry Volume K Unit Forecast, by Country 2019 & 2032
- Table 113: United States Cloud Services Brokerage Industry Revenue (Million) Forecast, by Application 2019 & 2032
- Table 114: United States Cloud Services Brokerage Industry Volume (K Unit) Forecast, by Application 2019 & 2032
- Table 115: Canada Cloud Services Brokerage Industry Revenue (Million) Forecast, by Application 2019 & 2032
- Table 116: Canada Cloud Services Brokerage Industry Volume (K Unit) Forecast, by Application 2019 & 2032
- Table 117: Global Cloud Services Brokerage Industry Revenue Million Forecast, by Platform 2019 & 2032
- Table 118: Global Cloud Services Brokerage Industry Volume K Unit Forecast, by Platform 2019 & 2032
- Table 119: Global Cloud Services Brokerage Industry Revenue Million Forecast, by Deployment Model 2019 & 2032
- Table 120: Global Cloud Services Brokerage Industry Volume K Unit Forecast, by Deployment Model 2019 & 2032
- Table 121: Global Cloud Services Brokerage Industry Revenue Million Forecast, by Enterprise 2019 & 2032
- Table 122: Global Cloud Services Brokerage Industry Volume K Unit Forecast, by Enterprise 2019 & 2032
- Table 123: Global Cloud Services Brokerage Industry Revenue Million Forecast, by End-user Industry 2019 & 2032
- Table 124: Global Cloud Services Brokerage Industry Volume K Unit Forecast, by End-user Industry 2019 & 2032
- Table 125: Global Cloud Services Brokerage Industry Revenue Million Forecast, by Country 2019 & 2032
- Table 126: Global Cloud Services Brokerage Industry Volume K Unit Forecast, by Country 2019 & 2032
- Table 127: Germany Cloud Services Brokerage Industry Revenue (Million) Forecast, by Application 2019 & 2032
- Table 128: Germany Cloud Services Brokerage Industry Volume (K Unit) Forecast, by Application 2019 & 2032
- Table 129: United Kingdom Cloud Services Brokerage Industry Revenue (Million) Forecast, by Application 2019 & 2032
- Table 130: United Kingdom Cloud Services Brokerage Industry Volume (K Unit) Forecast, by Application 2019 & 2032
- Table 131: France Cloud Services Brokerage Industry Revenue (Million) Forecast, by Application 2019 & 2032
- Table 132: France Cloud Services Brokerage Industry Volume (K Unit) Forecast, by Application 2019 & 2032
- Table 133: Global Cloud Services Brokerage Industry Revenue Million Forecast, by Platform 2019 & 2032
- Table 134: Global Cloud Services Brokerage Industry Volume K Unit Forecast, by Platform 2019 & 2032
- Table 135: Global Cloud Services Brokerage Industry Revenue Million Forecast, by Deployment Model 2019 & 2032
- Table 136: Global Cloud Services Brokerage Industry Volume K Unit Forecast, by Deployment Model 2019 & 2032
- Table 137: Global Cloud Services Brokerage Industry Revenue Million Forecast, by Enterprise 2019 & 2032
- Table 138: Global Cloud Services Brokerage Industry Volume K Unit Forecast, by Enterprise 2019 & 2032
- Table 139: Global Cloud Services Brokerage Industry Revenue Million Forecast, by End-user Industry 2019 & 2032
- Table 140: Global Cloud Services Brokerage Industry Volume K Unit Forecast, by End-user Industry 2019 & 2032
- Table 141: Global Cloud Services Brokerage Industry Revenue Million Forecast, by Country 2019 & 2032
- Table 142: Global Cloud Services Brokerage Industry Volume K Unit Forecast, by Country 2019 & 2032
- Table 143: China Cloud Services Brokerage Industry Revenue (Million) Forecast, by Application 2019 & 2032
- Table 144: China Cloud Services Brokerage Industry Volume (K Unit) Forecast, by Application 2019 & 2032
- Table 145: Japan Cloud Services Brokerage Industry Revenue (Million) Forecast, by Application 2019 & 2032
- Table 146: Japan Cloud Services Brokerage Industry Volume (K Unit) Forecast, by Application 2019 & 2032
- Table 147: India Cloud Services Brokerage Industry Revenue (Million) Forecast, by Application 2019 & 2032
- Table 148: India Cloud Services Brokerage Industry Volume (K Unit) Forecast, by Application 2019 & 2032
- Table 149: Global Cloud Services Brokerage Industry Revenue Million Forecast, by Platform 2019 & 2032
- Table 150: Global Cloud Services Brokerage Industry Volume K Unit Forecast, by Platform 2019 & 2032
- Table 151: Global Cloud Services Brokerage Industry Revenue Million Forecast, by Deployment Model 2019 & 2032
- Table 152: Global Cloud Services Brokerage Industry Volume K Unit Forecast, by Deployment Model 2019 & 2032
- Table 153: Global Cloud Services Brokerage Industry Revenue Million Forecast, by Enterprise 2019 & 2032
- Table 154: Global Cloud Services Brokerage Industry Volume K Unit Forecast, by Enterprise 2019 & 2032
- Table 155: Global Cloud Services Brokerage Industry Revenue Million Forecast, by End-user Industry 2019 & 2032
- Table 156: Global Cloud Services Brokerage Industry Volume K Unit Forecast, by End-user Industry 2019 & 2032
- Table 157: Global Cloud Services Brokerage Industry Revenue Million Forecast, by Country 2019 & 2032
- Table 158: Global Cloud Services Brokerage Industry Volume K Unit Forecast, by Country 2019 & 2032
- Table 159: Global Cloud Services Brokerage Industry Revenue Million Forecast, by Platform 2019 & 2032
- Table 160: Global Cloud Services Brokerage Industry Volume K Unit Forecast, by Platform 2019 & 2032
- Table 161: Global Cloud Services Brokerage Industry Revenue Million Forecast, by Deployment Model 2019 & 2032
- Table 162: Global Cloud Services Brokerage Industry Volume K Unit Forecast, by Deployment Model 2019 & 2032
- Table 163: Global Cloud Services Brokerage Industry Revenue Million Forecast, by Enterprise 2019 & 2032
- Table 164: Global Cloud Services Brokerage Industry Volume K Unit Forecast, by Enterprise 2019 & 2032
- Table 165: Global Cloud Services Brokerage Industry Revenue Million Forecast, by End-user Industry 2019 & 2032
- Table 166: Global Cloud Services Brokerage Industry Volume K Unit Forecast, by End-user Industry 2019 & 2032
- Table 167: Global Cloud Services Brokerage Industry Revenue Million Forecast, by Country 2019 & 2032
- Table 168: Global Cloud Services Brokerage Industry Volume K Unit Forecast, by Country 2019 & 2032
- Table 169: Mexico Cloud Services Brokerage Industry Revenue (Million) Forecast, by Application 2019 & 2032
- Table 170: Mexico Cloud Services Brokerage Industry Volume (K Unit) Forecast, by Application 2019 & 2032
- Table 171: Brazil Cloud Services Brokerage Industry Revenue (Million) Forecast, by Application 2019 & 2032
- Table 172: Brazil Cloud Services Brokerage Industry Volume (K Unit) Forecast, by Application 2019 & 2032
- Table 173: Argentina Cloud Services Brokerage Industry Revenue (Million) Forecast, by Application 2019 & 2032
- Table 174: Argentina Cloud Services Brokerage Industry Volume (K Unit) Forecast, by Application 2019 & 2032
- Table 175: Global Cloud Services Brokerage Industry Revenue Million Forecast, by Platform 2019 & 2032
- Table 176: Global Cloud Services Brokerage Industry Volume K Unit Forecast, by Platform 2019 & 2032
- Table 177: Global Cloud Services Brokerage Industry Revenue Million Forecast, by Deployment Model 2019 & 2032
- Table 178: Global Cloud Services Brokerage Industry Volume K Unit Forecast, by Deployment Model 2019 & 2032
- Table 179: Global Cloud Services Brokerage Industry Revenue Million Forecast, by Enterprise 2019 & 2032
- Table 180: Global Cloud Services Brokerage Industry Volume K Unit Forecast, by Enterprise 2019 & 2032
- Table 181: Global Cloud Services Brokerage Industry Revenue Million Forecast, by End-user Industry 2019 & 2032
- Table 182: Global Cloud Services Brokerage Industry Volume K Unit Forecast, by End-user Industry 2019 & 2032
- Table 183: Global Cloud Services Brokerage Industry Revenue Million Forecast, by Country 2019 & 2032
- Table 184: Global Cloud Services Brokerage Industry Volume K Unit Forecast, by Country 2019 & 2032
- Table 185: United Arab Emirates Cloud Services Brokerage Industry Revenue (Million) Forecast, by Application 2019 & 2032
- Table 186: United Arab Emirates Cloud Services Brokerage Industry Volume (K Unit) Forecast, by Application 2019 & 2032
- Table 187: Saudi Arabia Cloud Services Brokerage Industry Revenue (Million) Forecast, by Application 2019 & 2032
- Table 188: Saudi Arabia Cloud Services Brokerage Industry Volume (K Unit) Forecast, by Application 2019 & 2032
Frequently Asked Questions
1. What is the projected Compound Annual Growth Rate (CAGR) of the Cloud Services Brokerage Industry?
The projected CAGR is approximately 16.08%.
2. Which companies are prominent players in the Cloud Services Brokerage Industry?
Key companies in the market include Cognizant Technology Solutions Corp , Wipro Limited, Accenture PLC, IBM Corporation, Capgemini SE, NTT Data Inc, Rightscale Inc, DXC Technology Company, NEC Corporation.
3. What are the main segments of the Cloud Services Brokerage Industry?
The market segments include Platform, Deployment Model, Enterprise, End-user Industry.
4. Can you provide details about the market size?
The market size is estimated to be USD 8.60 Million as of 2022.
5. What are some drivers contributing to market growth?
Increasing Adoption of Hybrid and Multi-cloud Environment; Increasing Adoption of Cloud Computing Services.
6. What are the notable trends driving market growth?
Internal Cloud Services Brokerage is Expected to Hold the Major Share.
7. Are there any restraints impacting market growth?
Lack of Awareness and Security Concerns.
8. Can you provide examples of recent developments in the market?
January 2023: EY unveiled its innovative retail solution, which leverages the power of the Microsoft Cloud to enhance the seamlessness of the user shopping experience. This integrated solution seamlessly connects all consumer touchpoints, enabling shoppers to effortlessly transition between online shopping, mobile apps, physical stores, or contact centers at any time. By harnessing the capabilities of Microsoft Cloud and Cloud for Retail, this system gathers data from various channels. It transforms it into valuable insights using cutting-edge technologies such as artificial intelligence (AI), image recognition, and advanced analytics.
9. What pricing options are available for accessing the report?
Pricing options include single-user, multi-user, and enterprise licenses priced at USD 4750, USD 5250, and USD 8750 respectively.
10. Is the market size provided in terms of value or volume?
The market size is provided in terms of value, measured in Million and volume, measured in K Unit.
11. Are there any specific market keywords associated with the report?
Yes, the market keyword associated with the report is "Cloud Services Brokerage Industry," which aids in identifying and referencing the specific market segment covered.
12. How do I determine which pricing option suits my needs best?
The pricing options vary based on user requirements and access needs. Individual users may opt for single-user licenses, while businesses requiring broader access may choose multi-user or enterprise licenses for cost-effective access to the report.
13. Are there any additional resources or data provided in the Cloud Services Brokerage Industry report?
While the report offers comprehensive insights, it's advisable to review the specific contents or supplementary materials provided to ascertain if additional resources or data are available.
14. How can I stay updated on further developments or reports in the Cloud Services Brokerage Industry?
To stay informed about further developments, trends, and reports in the Cloud Services Brokerage Industry, consider subscribing to industry newsletters, following relevant companies and organizations, or regularly checking reputable industry news sources and publications.
Methodology
Step 1 - Identification of Relevant Samples Size from Population Database


Step 2 - Approaches for Defining Global Market Size (Value, Volume* & Price*)

Note*: In applicable scenarios
Step 3 - Data Sources
Primary Research
- Web Analytics
- Survey Reports
- Research Institute
- Latest Research Reports
- Opinion Leaders
Secondary Research
- Annual Reports
- White Paper
- Latest Press Release
- Industry Association
- Paid Database
- Investor Presentations

Step 4 - Data Triangulation
Involves using different sources of information in order to increase the validity of a study
These sources are likely to be stakeholders in a program - participants, other researchers, program staff, other community members, and so on.
Then we put all data in single framework & apply various statistical tools to find out the dynamic on the market.
During the analysis stage, feedback from the stakeholder groups would be compared to determine areas of agreement as well as areas of divergence


