
Key Insights
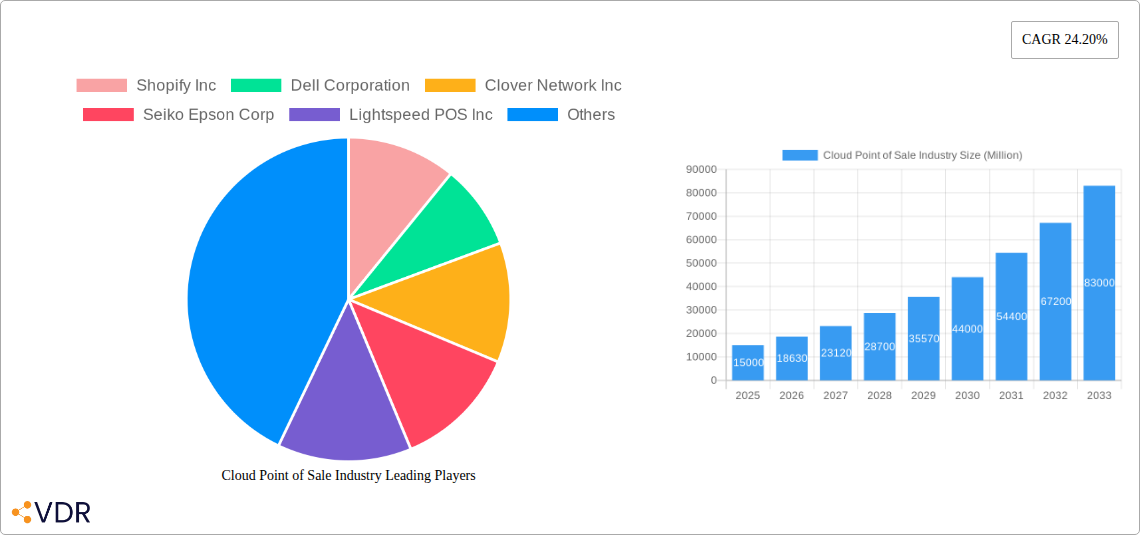
The Cloud Point of Sale (POS) industry is experiencing robust growth, driven by the increasing adoption of cloud-based technologies across various sectors. The market's 24.20% CAGR indicates a significant expansion, projected to reach substantial value within the forecast period (2025-2033). Key drivers include the enhanced scalability and flexibility offered by cloud-based systems, reduced infrastructure costs, improved data accessibility for real-time business intelligence, and seamless integration with other business applications. The shift towards mobile POS systems is further accelerating growth, empowering businesses with increased operational efficiency and customer engagement. While challenges such as data security concerns and internet dependency exist, the benefits of cloud POS are outweighing these concerns, especially within sectors like retail, hospitality, and healthcare, which are witnessing rapid digital transformation. The market segmentation reveals a strong demand across hardware, software, and services components, with mobile POS solutions gaining significant traction due to their portability and accessibility. Geographically, North America and Europe currently hold substantial market shares, though the Asia-Pacific region is poised for rapid growth given its burgeoning e-commerce and digitalization initiatives. Leading vendors are constantly innovating, introducing feature-rich solutions, and expanding their global presence to capitalize on this expansive market opportunity.
The competitive landscape is characterized by both established players and emerging technology providers. Established players like Shopify, NCR, and Oracle leverage their existing customer base and brand recognition, while newer entrants offer innovative solutions and competitive pricing. The strategic partnerships and acquisitions within the industry highlight the focus on expanding capabilities and market reach. Future growth will likely be influenced by advancements in Artificial Intelligence (AI) and machine learning integrated into POS systems, enabling predictive analytics and enhanced customer experience. Furthermore, the increasing integration of payment gateways and loyalty programs within cloud POS platforms will further propel market expansion. The focus on improving security protocols and addressing data privacy concerns will also be critical for sustained market growth in the coming years. The continuing trend towards omnichannel retail experiences and the increasing demand for mobile-first solutions ensure that the cloud POS industry is well-positioned for continued, significant expansion.
Cloud Point of Sale (POS) Industry Market Report: 2019-2033
This comprehensive report provides an in-depth analysis of the Cloud Point of Sale (POS) industry, encompassing market dynamics, growth trends, key players, and future outlook. The report covers the period from 2019 to 2033, with a focus on the base year 2025 and a forecast period of 2025-2033. The study segments the market by component (hardware, software & services), type (fixed and mobile POS), and end-user industry (entertainment, hospitality, healthcare, retail, and others). It leverages extensive market research to provide actionable insights for industry professionals and investors.
Cloud Point of Sale Industry Market Dynamics & Structure
This section analyzes the competitive landscape, technological advancements, regulatory influences, and market trends within the Cloud POS industry. The market is characterized by a combination of established players and emerging innovators, leading to a dynamic competitive environment. Market concentration is moderate, with several key players holding significant market share, but also with opportunities for smaller companies to gain traction through niche solutions and disruptive innovation.
- Market Concentration: The top 5 players hold an estimated xx% of the market share in 2025 (estimated). This share is projected to xx% by 2033.
- Technological Innovation: Cloud computing, mobile technologies, and AI are major drivers, leading to the development of more efficient and integrated POS systems. However, challenges exist in terms of data security and maintaining system reliability.
- Regulatory Frameworks: Compliance with payment card industry (PCI) standards and data privacy regulations (e.g., GDPR) significantly impact the design and implementation of Cloud POS systems. This necessitates ongoing investment in security technologies.
- Competitive Product Substitutes: The emergence of alternative payment methods and mobile wallets creates competition for traditional POS systems. The market is also seeing growth in integrated e-commerce platforms that incorporate POS functionalities.
- End-User Demographics: The target market encompasses businesses of all sizes, from small independent retailers to large multinational corporations, creating diverse requirements and preferences for POS solutions.
- M&A Trends: The Cloud POS market has seen a significant number of mergers and acquisitions (M&A) deals in recent years, estimated at xx deals annually between 2019-2024, with a projected xx deals annually between 2025-2033. These activities indicate consolidation and a shift toward integrated solutions.
Cloud Point of Sale Industry Growth Trends & Insights
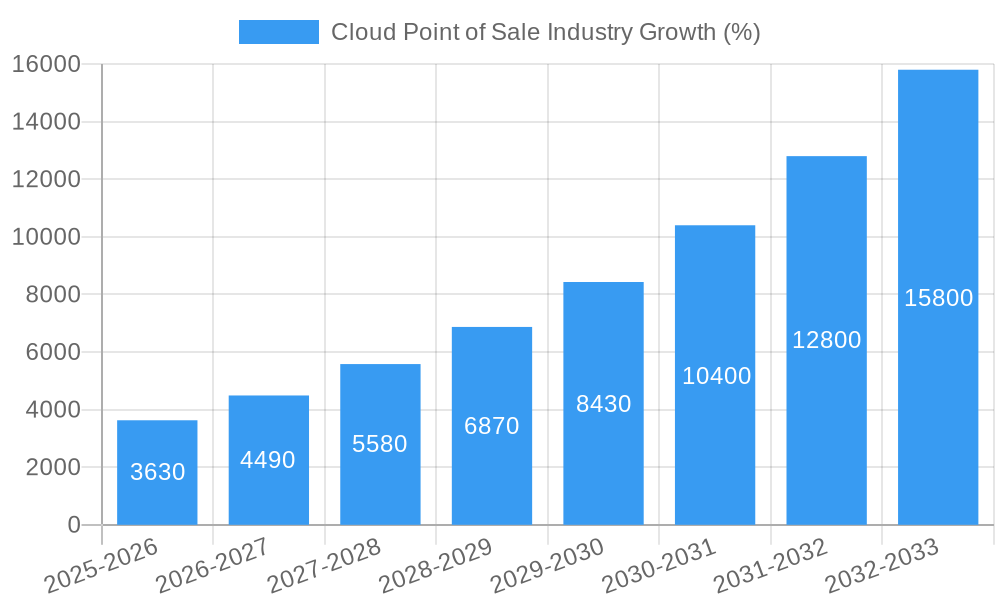
The Cloud POS market experienced substantial growth during the historical period (2019-2024), driven by the increasing adoption of cloud-based technologies and the shift towards digital transactions. The market size expanded from xx million units in 2019 to xx million units in 2024, registering a Compound Annual Growth Rate (CAGR) of xx%. This trend is projected to continue, with the market size expected to reach xx million units by 2025 and xx million units by 2033, achieving a projected CAGR of xx% during the forecast period (2025-2033). The growth is propelled by factors like increased consumer preference for contactless payments, the rising need for data-driven insights, and ongoing technological advancements in the cloud and mobile technologies. Market penetration is expected to increase from xx% in 2024 to xx% in 2033.
Dominant Regions, Countries, or Segments in Cloud Point of Sale Industry
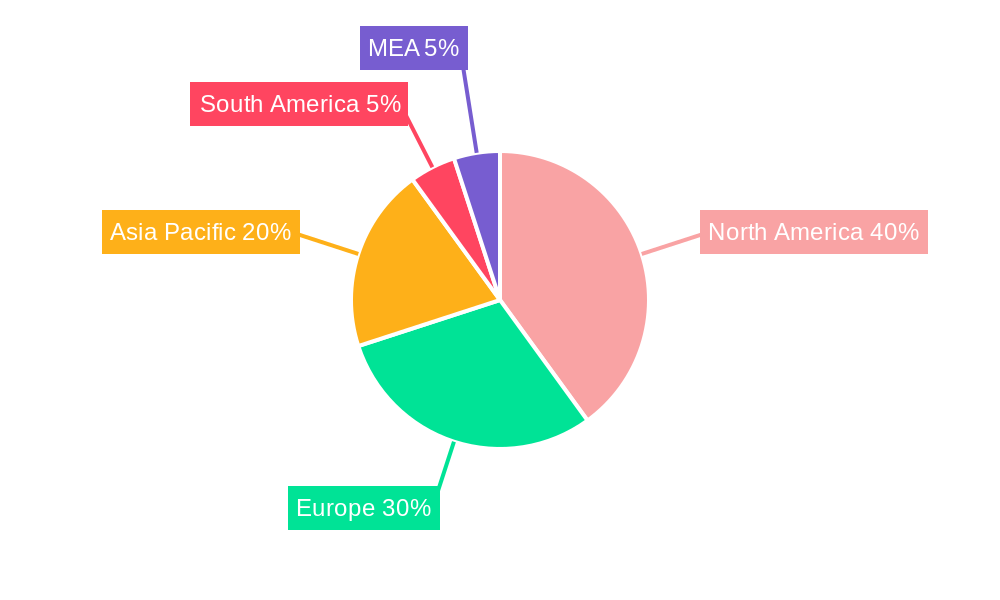
North America currently dominates the Cloud POS market, driven by factors such as high adoption rates, advanced technological infrastructure, and a large base of retail and hospitality businesses. However, significant growth potential exists in Asia-Pacific and other emerging markets.
By Component: The software and services segment is witnessing faster growth compared to the hardware segment due to the increasing demand for advanced features and functionalities offered through cloud-based solutions.
By Type: Mobile Point of Sale systems are gaining popularity due to their flexibility and portability, particularly for businesses with on-the-go operations. This is contributing to market growth in all regions.
By End-user Industry: The Retail sector remains the largest end-user industry for Cloud POS systems, followed by the Hospitality industry. The Healthcare and Entertainment sectors are also showing increasing adoption, offering further opportunities for market expansion. These sectors are driven by the demand for enhanced operational efficiency, better inventory management, and improved customer relationship management.
- Key Drivers: Government initiatives promoting digitalization, increasing internet penetration, improving technological infrastructure, and favorable economic conditions are significant growth drivers.
- Dominance Factors: North America's dominance stems from its advanced technological infrastructure, high disposable incomes, and early adoption of cloud-based solutions. Strong growth in Asia-Pacific is fueled by rising e-commerce adoption and a growing middle class.
Cloud Point of Sale Industry Product Landscape
Cloud POS systems are evolving rapidly, incorporating features like inventory management, customer relationship management (CRM), employee management, reporting and analytics, and seamless integration with e-commerce platforms. Innovations include AI-powered features for fraud detection, personalized customer experiences, and predictive analytics. Many systems offer APIs to integrate with existing business systems, improving overall workflow. Key selling propositions focus on cost-effectiveness, scalability, real-time data access, and improved operational efficiency.
Key Drivers, Barriers & Challenges in Cloud Point of Sale Industry
Key Drivers: The increasing demand for contactless and digital payments, the need for real-time data analysis, improved customer experiences, and increased operational efficiencies are major drivers. Government initiatives promoting digitalization further accelerate market growth.
Key Challenges: Data security concerns, reliance on internet connectivity, the cost of implementation and maintenance, integration challenges with existing systems, and competition from established players present significant challenges. Supply chain disruptions can also impact the availability of hardware components. The estimated impact of these challenges on annual growth is approximately xx million units.
Emerging Opportunities in Cloud Point of Sale Industry
Emerging opportunities include expansion into untapped markets, particularly in developing economies. There is also scope for innovation in areas like integrating blockchain technology for enhanced security and loyalty programs, as well as developing specialized solutions for niche market segments. Increased focus on omnichannel integration (e-commerce and physical store) presents a significant opportunity.
Growth Accelerators in the Cloud Point of Sale Industry Industry
Technological advancements like 5G network deployment and the development of more sophisticated AI-powered analytics are accelerating market growth. Strategic partnerships between POS providers and payment processors facilitate wider adoption. Furthermore, expansion into new geographic markets and industry segments offers significant growth potential.
Key Players Shaping the Cloud Point of Sale Industry Market
- Shopify Inc
- Dell Corporation
- Clover Network Inc
- Seiko Epson Corp
- Lightspeed POS Inc
- Intuit Inc
- Samsung Electronics Co Ltd
- NCR Corporation
- Hewlett Packard Enterprise
- Toshiba Global Commerce Solutions
- Vend Limited
- NEC Corporation
- Micros Retail Systems Inc (Oracle)
- Casio Computer Co Ltd
- Panasonic Corporation
- Block Inc
Notable Milestones in Cloud Point of Sale Industry Sector
- September 2022: Block, Inc. launched its Tap to Pay on iPhone feature, enabling millions of US vendors to accept contactless payments without additional hardware.
- January 2022: Visa introduced Visa Acceptance Cloud (VAC), enabling a cloud-based transition for payment processing.
In-Depth Cloud Point of Sale Industry Market Outlook
The Cloud POS market is poised for continued strong growth, driven by technological advancements, evolving consumer preferences, and increasing demand for efficient business solutions. Strategic partnerships, expansion into new markets, and the development of innovative solutions will further propel market growth, creating significant opportunities for industry players. The market is expected to evolve towards more integrated, AI-powered systems offering enhanced functionality and seamless omnichannel integration.
Cloud Point of Sale Industry Segmentation
-
1. Component
- 1.1. Hardware
- 1.2. Software & Services
-
2. Type
- 2.1. Fixed Point of Sale
- 2.2. Mobile Point of Sale
-
3. End-user Industry
- 3.1. Entertainment
- 3.2. Hospitality
- 3.3. Healthcare
- 3.4. Retail
- 3.5. Other End-user Industries
Cloud Point of Sale Industry Segmentation By Geography
- 1. North America
- 2. Europe
- 3. Asia Pacific
- 4. Latin America
- 5. Middle East and Africa
Cloud Point of Sale Industry REPORT HIGHLIGHTS
| Aspects | Details |
|---|---|
| Study Period | 2019-2033 |
| Base Year | 2024 |
| Estimated Year | 2025 |
| Forecast Period | 2025-2033 |
| Historical Period | 2019-2024 |
| Growth Rate | CAGR of 24.20% from 2019-2033 |
| Segmentation |
|
Table of Contents
- 1. Introduction
- 1.1. Research Scope
- 1.2. Market Segmentation
- 1.3. Research Methodology
- 1.4. Definitions and Assumptions
- 2. Executive Summary
- 2.1. Introduction
- 3. Market Dynamics
- 3.1. Introduction
- 3.2. Market Drivers
- 3.2.1. Increasing Cashless Transaction; Increased Business Mobility and Flexibility
- 3.3. Market Restrains
- 3.3.1. Lack of Infrastructure and High Dependence on Legacy Systems
- 3.4. Market Trends
- 3.4.1. Retail Segment is Expected to Hold Major Share
- 4. Market Factor Analysis
- 4.1. Porters Five Forces
- 4.2. Supply/Value Chain
- 4.3. PESTEL analysis
- 4.4. Market Entropy
- 4.5. Patent/Trademark Analysis
- 5. Global Cloud Point of Sale Industry Analysis, Insights and Forecast, 2019-2031
- 5.1. Market Analysis, Insights and Forecast - by Component
- 5.1.1. Hardware
- 5.1.2. Software & Services
- 5.2. Market Analysis, Insights and Forecast - by Type
- 5.2.1. Fixed Point of Sale
- 5.2.2. Mobile Point of Sale
- 5.3. Market Analysis, Insights and Forecast - by End-user Industry
- 5.3.1. Entertainment
- 5.3.2. Hospitality
- 5.3.3. Healthcare
- 5.3.4. Retail
- 5.3.5. Other End-user Industries
- 5.4. Market Analysis, Insights and Forecast - by Region
- 5.4.1. North America
- 5.4.2. Europe
- 5.4.3. Asia Pacific
- 5.4.4. Latin America
- 5.4.5. Middle East and Africa
- 5.1. Market Analysis, Insights and Forecast - by Component
- 6. North America Cloud Point of Sale Industry Analysis, Insights and Forecast, 2019-2031
- 6.1. Market Analysis, Insights and Forecast - by Component
- 6.1.1. Hardware
- 6.1.2. Software & Services
- 6.2. Market Analysis, Insights and Forecast - by Type
- 6.2.1. Fixed Point of Sale
- 6.2.2. Mobile Point of Sale
- 6.3. Market Analysis, Insights and Forecast - by End-user Industry
- 6.3.1. Entertainment
- 6.3.2. Hospitality
- 6.3.3. Healthcare
- 6.3.4. Retail
- 6.3.5. Other End-user Industries
- 6.1. Market Analysis, Insights and Forecast - by Component
- 7. Europe Cloud Point of Sale Industry Analysis, Insights and Forecast, 2019-2031
- 7.1. Market Analysis, Insights and Forecast - by Component
- 7.1.1. Hardware
- 7.1.2. Software & Services
- 7.2. Market Analysis, Insights and Forecast - by Type
- 7.2.1. Fixed Point of Sale
- 7.2.2. Mobile Point of Sale
- 7.3. Market Analysis, Insights and Forecast - by End-user Industry
- 7.3.1. Entertainment
- 7.3.2. Hospitality
- 7.3.3. Healthcare
- 7.3.4. Retail
- 7.3.5. Other End-user Industries
- 7.1. Market Analysis, Insights and Forecast - by Component
- 8. Asia Pacific Cloud Point of Sale Industry Analysis, Insights and Forecast, 2019-2031
- 8.1. Market Analysis, Insights and Forecast - by Component
- 8.1.1. Hardware
- 8.1.2. Software & Services
- 8.2. Market Analysis, Insights and Forecast - by Type
- 8.2.1. Fixed Point of Sale
- 8.2.2. Mobile Point of Sale
- 8.3. Market Analysis, Insights and Forecast - by End-user Industry
- 8.3.1. Entertainment
- 8.3.2. Hospitality
- 8.3.3. Healthcare
- 8.3.4. Retail
- 8.3.5. Other End-user Industries
- 8.1. Market Analysis, Insights and Forecast - by Component
- 9. Latin America Cloud Point of Sale Industry Analysis, Insights and Forecast, 2019-2031
- 9.1. Market Analysis, Insights and Forecast - by Component
- 9.1.1. Hardware
- 9.1.2. Software & Services
- 9.2. Market Analysis, Insights and Forecast - by Type
- 9.2.1. Fixed Point of Sale
- 9.2.2. Mobile Point of Sale
- 9.3. Market Analysis, Insights and Forecast - by End-user Industry
- 9.3.1. Entertainment
- 9.3.2. Hospitality
- 9.3.3. Healthcare
- 9.3.4. Retail
- 9.3.5. Other End-user Industries
- 9.1. Market Analysis, Insights and Forecast - by Component
- 10. Middle East and Africa Cloud Point of Sale Industry Analysis, Insights and Forecast, 2019-2031
- 10.1. Market Analysis, Insights and Forecast - by Component
- 10.1.1. Hardware
- 10.1.2. Software & Services
- 10.2. Market Analysis, Insights and Forecast - by Type
- 10.2.1. Fixed Point of Sale
- 10.2.2. Mobile Point of Sale
- 10.3. Market Analysis, Insights and Forecast - by End-user Industry
- 10.3.1. Entertainment
- 10.3.2. Hospitality
- 10.3.3. Healthcare
- 10.3.4. Retail
- 10.3.5. Other End-user Industries
- 10.1. Market Analysis, Insights and Forecast - by Component
- 11. North America Cloud Point of Sale Industry Analysis, Insights and Forecast, 2019-2031
- 11.1. Market Analysis, Insights and Forecast - By Country/Sub-region
- 11.1.1 United States
- 11.1.2 Canada
- 11.1.3 Mexico
- 12. Europe Cloud Point of Sale Industry Analysis, Insights and Forecast, 2019-2031
- 12.1. Market Analysis, Insights and Forecast - By Country/Sub-region
- 12.1.1 Germany
- 12.1.2 United Kingdom
- 12.1.3 France
- 12.1.4 Spain
- 12.1.5 Italy
- 12.1.6 Spain
- 12.1.7 Belgium
- 12.1.8 Netherland
- 12.1.9 Nordics
- 12.1.10 Rest of Europe
- 13. Asia Pacific Cloud Point of Sale Industry Analysis, Insights and Forecast, 2019-2031
- 13.1. Market Analysis, Insights and Forecast - By Country/Sub-region
- 13.1.1 China
- 13.1.2 Japan
- 13.1.3 India
- 13.1.4 South Korea
- 13.1.5 Southeast Asia
- 13.1.6 Australia
- 13.1.7 Indonesia
- 13.1.8 Phillipes
- 13.1.9 Singapore
- 13.1.10 Thailandc
- 13.1.11 Rest of Asia Pacific
- 14. South America Cloud Point of Sale Industry Analysis, Insights and Forecast, 2019-2031
- 14.1. Market Analysis, Insights and Forecast - By Country/Sub-region
- 14.1.1 Brazil
- 14.1.2 Argentina
- 14.1.3 Peru
- 14.1.4 Chile
- 14.1.5 Colombia
- 14.1.6 Ecuador
- 14.1.7 Venezuela
- 14.1.8 Rest of South America
- 15. North America Cloud Point of Sale Industry Analysis, Insights and Forecast, 2019-2031
- 15.1. Market Analysis, Insights and Forecast - By Country/Sub-region
- 15.1.1 United States
- 15.1.2 Canada
- 15.1.3 Mexico
- 16. MEA Cloud Point of Sale Industry Analysis, Insights and Forecast, 2019-2031
- 16.1. Market Analysis, Insights and Forecast - By Country/Sub-region
- 16.1.1 United Arab Emirates
- 16.1.2 Saudi Arabia
- 16.1.3 South Africa
- 16.1.4 Rest of Middle East and Africa
- 17. Competitive Analysis
- 17.1. Global Market Share Analysis 2024
- 17.2. Company Profiles
- 17.2.1 Shopify Inc
- 17.2.1.1. Overview
- 17.2.1.2. Products
- 17.2.1.3. SWOT Analysis
- 17.2.1.4. Recent Developments
- 17.2.1.5. Financials (Based on Availability)
- 17.2.2 Dell Corporation
- 17.2.2.1. Overview
- 17.2.2.2. Products
- 17.2.2.3. SWOT Analysis
- 17.2.2.4. Recent Developments
- 17.2.2.5. Financials (Based on Availability)
- 17.2.3 Clover Network Inc
- 17.2.3.1. Overview
- 17.2.3.2. Products
- 17.2.3.3. SWOT Analysis
- 17.2.3.4. Recent Developments
- 17.2.3.5. Financials (Based on Availability)
- 17.2.4 Seiko Epson Corp
- 17.2.4.1. Overview
- 17.2.4.2. Products
- 17.2.4.3. SWOT Analysis
- 17.2.4.4. Recent Developments
- 17.2.4.5. Financials (Based on Availability)
- 17.2.5 Lightspeed POS Inc
- 17.2.5.1. Overview
- 17.2.5.2. Products
- 17.2.5.3. SWOT Analysis
- 17.2.5.4. Recent Developments
- 17.2.5.5. Financials (Based on Availability)
- 17.2.6 Intuit Inc
- 17.2.6.1. Overview
- 17.2.6.2. Products
- 17.2.6.3. SWOT Analysis
- 17.2.6.4. Recent Developments
- 17.2.6.5. Financials (Based on Availability)
- 17.2.7 Samsung Electronics Co Ltd
- 17.2.7.1. Overview
- 17.2.7.2. Products
- 17.2.7.3. SWOT Analysis
- 17.2.7.4. Recent Developments
- 17.2.7.5. Financials (Based on Availability)
- 17.2.8 NCR Corporation
- 17.2.8.1. Overview
- 17.2.8.2. Products
- 17.2.8.3. SWOT Analysis
- 17.2.8.4. Recent Developments
- 17.2.8.5. Financials (Based on Availability)
- 17.2.9 Hewlett Packard Enterprise
- 17.2.9.1. Overview
- 17.2.9.2. Products
- 17.2.9.3. SWOT Analysis
- 17.2.9.4. Recent Developments
- 17.2.9.5. Financials (Based on Availability)
- 17.2.10 Toshiba Global Commerce Solutions
- 17.2.10.1. Overview
- 17.2.10.2. Products
- 17.2.10.3. SWOT Analysis
- 17.2.10.4. Recent Developments
- 17.2.10.5. Financials (Based on Availability)
- 17.2.11 Vend Limited
- 17.2.11.1. Overview
- 17.2.11.2. Products
- 17.2.11.3. SWOT Analysis
- 17.2.11.4. Recent Developments
- 17.2.11.5. Financials (Based on Availability)
- 17.2.12 NEC Corporation
- 17.2.12.1. Overview
- 17.2.12.2. Products
- 17.2.12.3. SWOT Analysis
- 17.2.12.4. Recent Developments
- 17.2.12.5. Financials (Based on Availability)
- 17.2.13 Micros Retail Systems Inc (Oracle)
- 17.2.13.1. Overview
- 17.2.13.2. Products
- 17.2.13.3. SWOT Analysis
- 17.2.13.4. Recent Developments
- 17.2.13.5. Financials (Based on Availability)
- 17.2.14 Casio Computer Co Ltd
- 17.2.14.1. Overview
- 17.2.14.2. Products
- 17.2.14.3. SWOT Analysis
- 17.2.14.4. Recent Developments
- 17.2.14.5. Financials (Based on Availability)
- 17.2.15 Panasonic Corporation
- 17.2.15.1. Overview
- 17.2.15.2. Products
- 17.2.15.3. SWOT Analysis
- 17.2.15.4. Recent Developments
- 17.2.15.5. Financials (Based on Availability)
- 17.2.16 Block Inc
- 17.2.16.1. Overview
- 17.2.16.2. Products
- 17.2.16.3. SWOT Analysis
- 17.2.16.4. Recent Developments
- 17.2.16.5. Financials (Based on Availability)
- 17.2.1 Shopify Inc
List of Figures
- Figure 1: Global Cloud Point of Sale Industry Revenue Breakdown (Million, %) by Region 2024 & 2032
- Figure 2: North America Cloud Point of Sale Industry Revenue (Million), by Country 2024 & 2032
- Figure 3: North America Cloud Point of Sale Industry Revenue Share (%), by Country 2024 & 2032
- Figure 4: Europe Cloud Point of Sale Industry Revenue (Million), by Country 2024 & 2032
- Figure 5: Europe Cloud Point of Sale Industry Revenue Share (%), by Country 2024 & 2032
- Figure 6: Asia Pacific Cloud Point of Sale Industry Revenue (Million), by Country 2024 & 2032
- Figure 7: Asia Pacific Cloud Point of Sale Industry Revenue Share (%), by Country 2024 & 2032
- Figure 8: South America Cloud Point of Sale Industry Revenue (Million), by Country 2024 & 2032
- Figure 9: South America Cloud Point of Sale Industry Revenue Share (%), by Country 2024 & 2032
- Figure 10: North America Cloud Point of Sale Industry Revenue (Million), by Country 2024 & 2032
- Figure 11: North America Cloud Point of Sale Industry Revenue Share (%), by Country 2024 & 2032
- Figure 12: MEA Cloud Point of Sale Industry Revenue (Million), by Country 2024 & 2032
- Figure 13: MEA Cloud Point of Sale Industry Revenue Share (%), by Country 2024 & 2032
- Figure 14: North America Cloud Point of Sale Industry Revenue (Million), by Component 2024 & 2032
- Figure 15: North America Cloud Point of Sale Industry Revenue Share (%), by Component 2024 & 2032
- Figure 16: North America Cloud Point of Sale Industry Revenue (Million), by Type 2024 & 2032
- Figure 17: North America Cloud Point of Sale Industry Revenue Share (%), by Type 2024 & 2032
- Figure 18: North America Cloud Point of Sale Industry Revenue (Million), by End-user Industry 2024 & 2032
- Figure 19: North America Cloud Point of Sale Industry Revenue Share (%), by End-user Industry 2024 & 2032
- Figure 20: North America Cloud Point of Sale Industry Revenue (Million), by Country 2024 & 2032
- Figure 21: North America Cloud Point of Sale Industry Revenue Share (%), by Country 2024 & 2032
- Figure 22: Europe Cloud Point of Sale Industry Revenue (Million), by Component 2024 & 2032
- Figure 23: Europe Cloud Point of Sale Industry Revenue Share (%), by Component 2024 & 2032
- Figure 24: Europe Cloud Point of Sale Industry Revenue (Million), by Type 2024 & 2032
- Figure 25: Europe Cloud Point of Sale Industry Revenue Share (%), by Type 2024 & 2032
- Figure 26: Europe Cloud Point of Sale Industry Revenue (Million), by End-user Industry 2024 & 2032
- Figure 27: Europe Cloud Point of Sale Industry Revenue Share (%), by End-user Industry 2024 & 2032
- Figure 28: Europe Cloud Point of Sale Industry Revenue (Million), by Country 2024 & 2032
- Figure 29: Europe Cloud Point of Sale Industry Revenue Share (%), by Country 2024 & 2032
- Figure 30: Asia Pacific Cloud Point of Sale Industry Revenue (Million), by Component 2024 & 2032
- Figure 31: Asia Pacific Cloud Point of Sale Industry Revenue Share (%), by Component 2024 & 2032
- Figure 32: Asia Pacific Cloud Point of Sale Industry Revenue (Million), by Type 2024 & 2032
- Figure 33: Asia Pacific Cloud Point of Sale Industry Revenue Share (%), by Type 2024 & 2032
- Figure 34: Asia Pacific Cloud Point of Sale Industry Revenue (Million), by End-user Industry 2024 & 2032
- Figure 35: Asia Pacific Cloud Point of Sale Industry Revenue Share (%), by End-user Industry 2024 & 2032
- Figure 36: Asia Pacific Cloud Point of Sale Industry Revenue (Million), by Country 2024 & 2032
- Figure 37: Asia Pacific Cloud Point of Sale Industry Revenue Share (%), by Country 2024 & 2032
- Figure 38: Latin America Cloud Point of Sale Industry Revenue (Million), by Component 2024 & 2032
- Figure 39: Latin America Cloud Point of Sale Industry Revenue Share (%), by Component 2024 & 2032
- Figure 40: Latin America Cloud Point of Sale Industry Revenue (Million), by Type 2024 & 2032
- Figure 41: Latin America Cloud Point of Sale Industry Revenue Share (%), by Type 2024 & 2032
- Figure 42: Latin America Cloud Point of Sale Industry Revenue (Million), by End-user Industry 2024 & 2032
- Figure 43: Latin America Cloud Point of Sale Industry Revenue Share (%), by End-user Industry 2024 & 2032
- Figure 44: Latin America Cloud Point of Sale Industry Revenue (Million), by Country 2024 & 2032
- Figure 45: Latin America Cloud Point of Sale Industry Revenue Share (%), by Country 2024 & 2032
- Figure 46: Middle East and Africa Cloud Point of Sale Industry Revenue (Million), by Component 2024 & 2032
- Figure 47: Middle East and Africa Cloud Point of Sale Industry Revenue Share (%), by Component 2024 & 2032
- Figure 48: Middle East and Africa Cloud Point of Sale Industry Revenue (Million), by Type 2024 & 2032
- Figure 49: Middle East and Africa Cloud Point of Sale Industry Revenue Share (%), by Type 2024 & 2032
- Figure 50: Middle East and Africa Cloud Point of Sale Industry Revenue (Million), by End-user Industry 2024 & 2032
- Figure 51: Middle East and Africa Cloud Point of Sale Industry Revenue Share (%), by End-user Industry 2024 & 2032
- Figure 52: Middle East and Africa Cloud Point of Sale Industry Revenue (Million), by Country 2024 & 2032
- Figure 53: Middle East and Africa Cloud Point of Sale Industry Revenue Share (%), by Country 2024 & 2032
List of Tables
- Table 1: Global Cloud Point of Sale Industry Revenue Million Forecast, by Region 2019 & 2032
- Table 2: Global Cloud Point of Sale Industry Revenue Million Forecast, by Component 2019 & 2032
- Table 3: Global Cloud Point of Sale Industry Revenue Million Forecast, by Type 2019 & 2032
- Table 4: Global Cloud Point of Sale Industry Revenue Million Forecast, by End-user Industry 2019 & 2032
- Table 5: Global Cloud Point of Sale Industry Revenue Million Forecast, by Region 2019 & 2032
- Table 6: Global Cloud Point of Sale Industry Revenue Million Forecast, by Country 2019 & 2032
- Table 7: United States Cloud Point of Sale Industry Revenue (Million) Forecast, by Application 2019 & 2032
- Table 8: Canada Cloud Point of Sale Industry Revenue (Million) Forecast, by Application 2019 & 2032
- Table 9: Mexico Cloud Point of Sale Industry Revenue (Million) Forecast, by Application 2019 & 2032
- Table 10: Global Cloud Point of Sale Industry Revenue Million Forecast, by Country 2019 & 2032
- Table 11: Germany Cloud Point of Sale Industry Revenue (Million) Forecast, by Application 2019 & 2032
- Table 12: United Kingdom Cloud Point of Sale Industry Revenue (Million) Forecast, by Application 2019 & 2032
- Table 13: France Cloud Point of Sale Industry Revenue (Million) Forecast, by Application 2019 & 2032
- Table 14: Spain Cloud Point of Sale Industry Revenue (Million) Forecast, by Application 2019 & 2032
- Table 15: Italy Cloud Point of Sale Industry Revenue (Million) Forecast, by Application 2019 & 2032
- Table 16: Spain Cloud Point of Sale Industry Revenue (Million) Forecast, by Application 2019 & 2032
- Table 17: Belgium Cloud Point of Sale Industry Revenue (Million) Forecast, by Application 2019 & 2032
- Table 18: Netherland Cloud Point of Sale Industry Revenue (Million) Forecast, by Application 2019 & 2032
- Table 19: Nordics Cloud Point of Sale Industry Revenue (Million) Forecast, by Application 2019 & 2032
- Table 20: Rest of Europe Cloud Point of Sale Industry Revenue (Million) Forecast, by Application 2019 & 2032
- Table 21: Global Cloud Point of Sale Industry Revenue Million Forecast, by Country 2019 & 2032
- Table 22: China Cloud Point of Sale Industry Revenue (Million) Forecast, by Application 2019 & 2032
- Table 23: Japan Cloud Point of Sale Industry Revenue (Million) Forecast, by Application 2019 & 2032
- Table 24: India Cloud Point of Sale Industry Revenue (Million) Forecast, by Application 2019 & 2032
- Table 25: South Korea Cloud Point of Sale Industry Revenue (Million) Forecast, by Application 2019 & 2032
- Table 26: Southeast Asia Cloud Point of Sale Industry Revenue (Million) Forecast, by Application 2019 & 2032
- Table 27: Australia Cloud Point of Sale Industry Revenue (Million) Forecast, by Application 2019 & 2032
- Table 28: Indonesia Cloud Point of Sale Industry Revenue (Million) Forecast, by Application 2019 & 2032
- Table 29: Phillipes Cloud Point of Sale Industry Revenue (Million) Forecast, by Application 2019 & 2032
- Table 30: Singapore Cloud Point of Sale Industry Revenue (Million) Forecast, by Application 2019 & 2032
- Table 31: Thailandc Cloud Point of Sale Industry Revenue (Million) Forecast, by Application 2019 & 2032
- Table 32: Rest of Asia Pacific Cloud Point of Sale Industry Revenue (Million) Forecast, by Application 2019 & 2032
- Table 33: Global Cloud Point of Sale Industry Revenue Million Forecast, by Country 2019 & 2032
- Table 34: Brazil Cloud Point of Sale Industry Revenue (Million) Forecast, by Application 2019 & 2032
- Table 35: Argentina Cloud Point of Sale Industry Revenue (Million) Forecast, by Application 2019 & 2032
- Table 36: Peru Cloud Point of Sale Industry Revenue (Million) Forecast, by Application 2019 & 2032
- Table 37: Chile Cloud Point of Sale Industry Revenue (Million) Forecast, by Application 2019 & 2032
- Table 38: Colombia Cloud Point of Sale Industry Revenue (Million) Forecast, by Application 2019 & 2032
- Table 39: Ecuador Cloud Point of Sale Industry Revenue (Million) Forecast, by Application 2019 & 2032
- Table 40: Venezuela Cloud Point of Sale Industry Revenue (Million) Forecast, by Application 2019 & 2032
- Table 41: Rest of South America Cloud Point of Sale Industry Revenue (Million) Forecast, by Application 2019 & 2032
- Table 42: Global Cloud Point of Sale Industry Revenue Million Forecast, by Country 2019 & 2032
- Table 43: United States Cloud Point of Sale Industry Revenue (Million) Forecast, by Application 2019 & 2032
- Table 44: Canada Cloud Point of Sale Industry Revenue (Million) Forecast, by Application 2019 & 2032
- Table 45: Mexico Cloud Point of Sale Industry Revenue (Million) Forecast, by Application 2019 & 2032
- Table 46: Global Cloud Point of Sale Industry Revenue Million Forecast, by Country 2019 & 2032
- Table 47: United Arab Emirates Cloud Point of Sale Industry Revenue (Million) Forecast, by Application 2019 & 2032
- Table 48: Saudi Arabia Cloud Point of Sale Industry Revenue (Million) Forecast, by Application 2019 & 2032
- Table 49: South Africa Cloud Point of Sale Industry Revenue (Million) Forecast, by Application 2019 & 2032
- Table 50: Rest of Middle East and Africa Cloud Point of Sale Industry Revenue (Million) Forecast, by Application 2019 & 2032
- Table 51: Global Cloud Point of Sale Industry Revenue Million Forecast, by Component 2019 & 2032
- Table 52: Global Cloud Point of Sale Industry Revenue Million Forecast, by Type 2019 & 2032
- Table 53: Global Cloud Point of Sale Industry Revenue Million Forecast, by End-user Industry 2019 & 2032
- Table 54: Global Cloud Point of Sale Industry Revenue Million Forecast, by Country 2019 & 2032
- Table 55: Global Cloud Point of Sale Industry Revenue Million Forecast, by Component 2019 & 2032
- Table 56: Global Cloud Point of Sale Industry Revenue Million Forecast, by Type 2019 & 2032
- Table 57: Global Cloud Point of Sale Industry Revenue Million Forecast, by End-user Industry 2019 & 2032
- Table 58: Global Cloud Point of Sale Industry Revenue Million Forecast, by Country 2019 & 2032
- Table 59: Global Cloud Point of Sale Industry Revenue Million Forecast, by Component 2019 & 2032
- Table 60: Global Cloud Point of Sale Industry Revenue Million Forecast, by Type 2019 & 2032
- Table 61: Global Cloud Point of Sale Industry Revenue Million Forecast, by End-user Industry 2019 & 2032
- Table 62: Global Cloud Point of Sale Industry Revenue Million Forecast, by Country 2019 & 2032
- Table 63: Global Cloud Point of Sale Industry Revenue Million Forecast, by Component 2019 & 2032
- Table 64: Global Cloud Point of Sale Industry Revenue Million Forecast, by Type 2019 & 2032
- Table 65: Global Cloud Point of Sale Industry Revenue Million Forecast, by End-user Industry 2019 & 2032
- Table 66: Global Cloud Point of Sale Industry Revenue Million Forecast, by Country 2019 & 2032
- Table 67: Global Cloud Point of Sale Industry Revenue Million Forecast, by Component 2019 & 2032
- Table 68: Global Cloud Point of Sale Industry Revenue Million Forecast, by Type 2019 & 2032
- Table 69: Global Cloud Point of Sale Industry Revenue Million Forecast, by End-user Industry 2019 & 2032
- Table 70: Global Cloud Point of Sale Industry Revenue Million Forecast, by Country 2019 & 2032
Frequently Asked Questions
1. What is the projected Compound Annual Growth Rate (CAGR) of the Cloud Point of Sale Industry?
The projected CAGR is approximately 24.20%.
2. Which companies are prominent players in the Cloud Point of Sale Industry?
Key companies in the market include Shopify Inc, Dell Corporation, Clover Network Inc, Seiko Epson Corp, Lightspeed POS Inc, Intuit Inc, Samsung Electronics Co Ltd, NCR Corporation, Hewlett Packard Enterprise, Toshiba Global Commerce Solutions, Vend Limited, NEC Corporation, Micros Retail Systems Inc (Oracle), Casio Computer Co Ltd, Panasonic Corporation, Block Inc.
3. What are the main segments of the Cloud Point of Sale Industry?
The market segments include Component, Type, End-user Industry.
4. Can you provide details about the market size?
The market size is estimated to be USD XX Million as of 2022.
5. What are some drivers contributing to market growth?
Increasing Cashless Transaction; Increased Business Mobility and Flexibility.
6. What are the notable trends driving market growth?
Retail Segment is Expected to Hold Major Share.
7. Are there any restraints impacting market growth?
Lack of Infrastructure and High Dependence on Legacy Systems.
8. Can you provide examples of recent developments in the market?
September 2022: Square, Inc. (now known as Block, Inc.) introduced millions of vendors across the United States to its Tap to Pay feature on iPhone. The feature, available within the Square Point of Sale iOS app, allowed merchants of all sizes to accept contactless payments directly from their iPhones, with no additional hardware requirement and at no additional costs to the seller.
9. What pricing options are available for accessing the report?
Pricing options include single-user, multi-user, and enterprise licenses priced at USD 4750, USD 5250, and USD 8750 respectively.
10. Is the market size provided in terms of value or volume?
The market size is provided in terms of value, measured in Million.
11. Are there any specific market keywords associated with the report?
Yes, the market keyword associated with the report is "Cloud Point of Sale Industry," which aids in identifying and referencing the specific market segment covered.
12. How do I determine which pricing option suits my needs best?
The pricing options vary based on user requirements and access needs. Individual users may opt for single-user licenses, while businesses requiring broader access may choose multi-user or enterprise licenses for cost-effective access to the report.
13. Are there any additional resources or data provided in the Cloud Point of Sale Industry report?
While the report offers comprehensive insights, it's advisable to review the specific contents or supplementary materials provided to ascertain if additional resources or data are available.
14. How can I stay updated on further developments or reports in the Cloud Point of Sale Industry?
To stay informed about further developments, trends, and reports in the Cloud Point of Sale Industry, consider subscribing to industry newsletters, following relevant companies and organizations, or regularly checking reputable industry news sources and publications.
Methodology
Step 1 - Identification of Relevant Samples Size from Population Database


Step 2 - Approaches for Defining Global Market Size (Value, Volume* & Price*)

Note*: In applicable scenarios
Step 3 - Data Sources
Primary Research
- Web Analytics
- Survey Reports
- Research Institute
- Latest Research Reports
- Opinion Leaders
Secondary Research
- Annual Reports
- White Paper
- Latest Press Release
- Industry Association
- Paid Database
- Investor Presentations

Step 4 - Data Triangulation
Involves using different sources of information in order to increase the validity of a study
These sources are likely to be stakeholders in a program - participants, other researchers, program staff, other community members, and so on.
Then we put all data in single framework & apply various statistical tools to find out the dynamic on the market.
During the analysis stage, feedback from the stakeholder groups would be compared to determine areas of agreement as well as areas of divergence


