
Key Insights
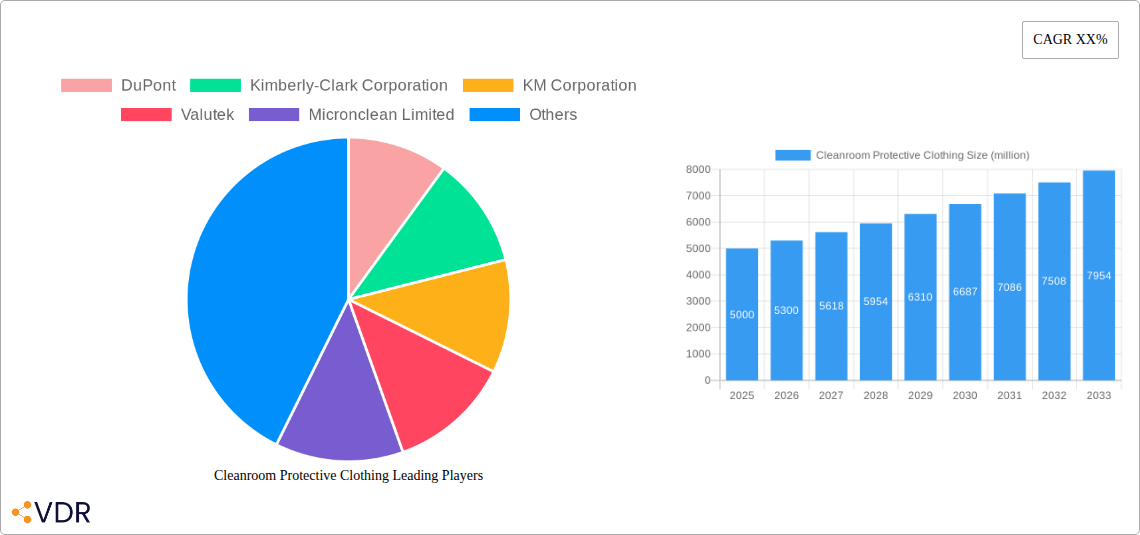
The global cleanroom protective clothing market is experiencing robust growth, driven by the increasing demand for contamination control across various industries. The market, estimated at $5 billion in 2025, is projected to witness a Compound Annual Growth Rate (CAGR) of 6% from 2025 to 2033, reaching a value exceeding $8 billion by the end of the forecast period. Key drivers include the burgeoning pharmaceutical and biotechnology sectors, the rising adoption of advanced manufacturing techniques in electronics and semiconductors, and stringent regulatory requirements for maintaining hygiene in healthcare settings. Trends such as the increasing demand for disposable garments, the development of innovative materials offering superior comfort and protection, and the growing adoption of sustainable and eco-friendly options are shaping the market landscape. While the initial investment in protective clothing can be a restraint for some businesses, the long-term benefits of preventing contamination and ensuring employee safety significantly outweigh this cost. Major players like DuPont, Kimberly-Clark, and Ansell are actively engaged in product innovation and expansion strategies to consolidate their market positions. Segmentation within the market includes various garment types (coveralls, gowns, hoods, gloves, etc.) and materials (polypropylene, polyester, Tyvek, etc.), catering to diverse industry-specific needs.
The geographical distribution of the market reveals strong performance across North America and Europe, driven by established manufacturing hubs and stringent regulatory frameworks. However, significant growth potential lies in emerging economies in Asia-Pacific and Latin America, fueled by expanding industrialization and increasing healthcare infrastructure investments. The market is expected to benefit further from technological advancements in fabric technology leading to improved breathability, comfort, and protection against a wider range of contaminants. Competitive rivalry remains intense, with companies focusing on differentiation through superior product quality, customization options, and efficient supply chain management. The market will continue to see consolidation through mergers and acquisitions as companies seek to expand their reach and product portfolios.
Cleanroom Protective Clothing Market Report: 2019-2033
This comprehensive report provides an in-depth analysis of the global cleanroom protective clothing market, encompassing market dynamics, growth trends, regional performance, product landscape, and competitive analysis. The report covers the period 2019-2033, with a focus on the forecast period 2025-2033 and a base year of 2025. The study segments the market by various parameters and includes detailed profiles of key players such as DuPont, Kimberly-Clark Corporation, KM Corporation, Valutek, Micronclean Limited, Ansell, and Lakeland. The report is invaluable for industry professionals, investors, and researchers seeking to understand this crucial sector.
Cleanroom Protective Clothing Market Dynamics & Structure
The global cleanroom protective clothing market, valued at $xx million in 2025, is characterized by moderate concentration, with key players holding significant market shares. Technological innovation, particularly in materials science and garment design, is a primary growth driver. Stringent regulatory frameworks, particularly in the pharmaceutical and semiconductor industries, heavily influence market dynamics. Competitive pressures from substitutes, such as alternative cleaning methods, are also present. The end-user demographics consist primarily of industries with stringent cleanliness requirements like pharmaceuticals, electronics, and healthcare. M&A activity in the sector has remained relatively steady in recent years, with approximately xx deals recorded between 2019 and 2024, largely focused on consolidation and expansion into new markets.
- Market Concentration: Moderately concentrated, with top 5 players holding approximately xx% market share in 2025.
- Technological Innovation: Focus on enhanced barrier properties, improved comfort, and sustainable materials.
- Regulatory Landscape: Stringent regulations in pharmaceuticals and healthcare drive demand for high-quality garments.
- Competitive Substitutes: Alternative cleaning and sterilization methods pose a moderate competitive threat.
- End-User Demographics: Pharmaceuticals, electronics, healthcare, and biotechnology sectors represent major end-users.
- M&A Activity: xx deals between 2019 and 2024, primarily focused on consolidation and market expansion.
Cleanroom Protective Clothing Growth Trends & Insights
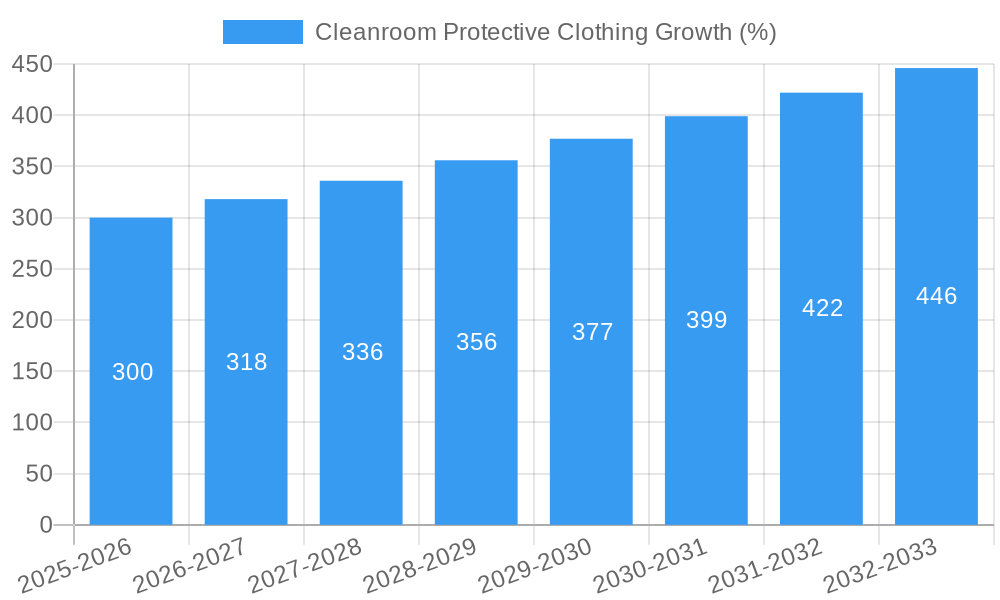
The cleanroom protective clothing market is projected to experience robust growth over the forecast period (2025-2033), with a Compound Annual Growth Rate (CAGR) of xx%. This growth is driven by factors including increasing demand from emerging economies, technological advancements, and rising awareness of contamination control in various industries. Market penetration remains relatively high in developed regions, but significant growth opportunities exist in developing nations. Technological disruptions, such as the introduction of innovative materials and smart garments, are changing consumer behavior, pushing demand for advanced protective solutions. The market size is expected to reach $xx million by 2033.
Dominant Regions, Countries, or Segments in Cleanroom Protective Clothing
North America currently dominates the cleanroom protective clothing market, driven by the strong presence of major pharmaceutical and semiconductor companies, stringent regulatory standards, and high disposable income. However, Asia-Pacific is projected to exhibit the fastest growth during the forecast period, fueled by rapid industrialization, rising investments in healthcare and technology sectors, and increasing awareness of hygiene and contamination control. Europe maintains a significant market share, driven by established pharmaceutical and biotechnology industries.
- North America: Strong regulatory environment, high disposable incomes, and established industrial base drive market dominance.
- Asia-Pacific: Rapid industrialization, growing healthcare and technology investments, and expanding awareness of hygiene contribute to rapid growth.
- Europe: Established pharmaceutical and biotechnology industries support significant market share.
- Key Drivers: Stringent regulatory frameworks, rising healthcare expenditure, technological advancements, and increasing awareness of hygiene and contamination control.
Cleanroom Protective Clothing Product Landscape
Cleanroom protective clothing encompasses a wide range of products, including coveralls, gowns, gloves, hoods, and shoe covers, each designed to meet specific cleanliness requirements. Recent innovations focus on enhanced breathability, improved comfort, and reduced particulate shedding. The integration of advanced materials, such as nanomaterials and antimicrobial fabrics, further enhances the performance and functionality of these garments. Key selling points include improved barrier protection, enhanced comfort and durability, and sustainable material options.
Key Drivers, Barriers & Challenges in Cleanroom Protective Clothing
Key Drivers:
- Increasing demand from pharmaceutical, semiconductor, and healthcare industries.
- Stringent regulatory requirements for contamination control.
- Technological advancements leading to improved product performance.
- Growing awareness of infection control and hygiene.
Key Challenges and Restraints:
- High cost of advanced materials can limit market accessibility.
- Supply chain disruptions caused by geopolitical instability.
- Intense competition from established and emerging players.
- Potential environmental impact of certain manufacturing processes.
Emerging Opportunities in Cleanroom Protective Clothing
Emerging opportunities lie in the development of sustainable and eco-friendly cleanroom garments, the integration of smart technology for enhanced monitoring and data collection, and the expansion into niche markets such as nanotechnology and aerospace. Personalized protective clothing solutions catering to specific body types and work environments also represent a significant growth opportunity. Untapped markets in developing countries present further potential for expansion.
Growth Accelerators in the Cleanroom Protective Clothing Industry
Long-term growth will be accelerated by strategic partnerships between material suppliers and garment manufacturers, the development of innovative materials with superior barrier properties and enhanced comfort, and a focus on sustainable and eco-friendly manufacturing practices. Expansion into new geographical markets, particularly in emerging economies, will further contribute to market growth.
Key Players Shaping the Cleanroom Protective Clothing Market
- DuPont
- Kimberly-Clark Corporation
- KM Corporation
- Valutek
- Micronclean Limited
- Ansell
- Lakeland
Notable Milestones in Cleanroom Protective Clothing Sector
- 2020: Introduction of a new generation of antimicrobial fabrics with enhanced protection against microbial contamination.
- 2022: Several key players launched sustainable and eco-friendly cleanroom garments made from recycled materials.
- 2023: Significant investments in research and development of smart cleanroom garments equipped with sensors and data tracking capabilities.
In-Depth Cleanroom Protective Clothing Market Outlook
The cleanroom protective clothing market is poised for significant growth over the next decade, driven by technological innovation, expanding end-user industries, and increasing awareness of contamination control. Strategic partnerships, expansion into new markets, and a focus on sustainability will be key factors driving future success. The market’s potential remains vast, particularly in emerging economies and specialized applications, offering lucrative opportunities for established and emerging players alike.
Cleanroom Protective Clothing Segmentation
-
1. Application
- 1.1. Electronic and Semiconductor
- 1.2. Pharmaceutical and Biotechnology
- 1.3. Medical Device Industry
- 1.4. Industrial
- 1.5. Others
-
2. Types
- 2.1. Antistatic Clothing
- 2.2. Flame and Arc Flash Protective Clothing
- 2.3. Others
Cleanroom Protective Clothing Segmentation By Geography
-
1. North America
- 1.1. United States
- 1.2. Canada
- 1.3. Mexico
-
2. South America
- 2.1. Brazil
- 2.2. Argentina
- 2.3. Rest of South America
-
3. Europe
- 3.1. United Kingdom
- 3.2. Germany
- 3.3. France
- 3.4. Italy
- 3.5. Spain
- 3.6. Russia
- 3.7. Benelux
- 3.8. Nordics
- 3.9. Rest of Europe
-
4. Middle East & Africa
- 4.1. Turkey
- 4.2. Israel
- 4.3. GCC
- 4.4. North Africa
- 4.5. South Africa
- 4.6. Rest of Middle East & Africa
-
5. Asia Pacific
- 5.1. China
- 5.2. India
- 5.3. Japan
- 5.4. South Korea
- 5.5. ASEAN
- 5.6. Oceania
- 5.7. Rest of Asia Pacific

Cleanroom Protective Clothing REPORT HIGHLIGHTS
| Aspects | Details |
|---|---|
| Study Period | 2019-2033 |
| Base Year | 2024 |
| Estimated Year | 2025 |
| Forecast Period | 2025-2033 |
| Historical Period | 2019-2024 |
| Growth Rate | CAGR of XX% from 2019-2033 |
| Segmentation |
|
Table of Contents
- 1. Introduction
- 1.1. Research Scope
- 1.2. Market Segmentation
- 1.3. Research Methodology
- 1.4. Definitions and Assumptions
- 2. Executive Summary
- 2.1. Introduction
- 3. Market Dynamics
- 3.1. Introduction
- 3.2. Market Drivers
- 3.3. Market Restrains
- 3.4. Market Trends
- 4. Market Factor Analysis
- 4.1. Porters Five Forces
- 4.2. Supply/Value Chain
- 4.3. PESTEL analysis
- 4.4. Market Entropy
- 4.5. Patent/Trademark Analysis
- 5. Global Cleanroom Protective Clothing Analysis, Insights and Forecast, 2019-2031
- 5.1. Market Analysis, Insights and Forecast - by Application
- 5.1.1. Electronic and Semiconductor
- 5.1.2. Pharmaceutical and Biotechnology
- 5.1.3. Medical Device Industry
- 5.1.4. Industrial
- 5.1.5. Others
- 5.2. Market Analysis, Insights and Forecast - by Types
- 5.2.1. Antistatic Clothing
- 5.2.2. Flame and Arc Flash Protective Clothing
- 5.2.3. Others
- 5.3. Market Analysis, Insights and Forecast - by Region
- 5.3.1. North America
- 5.3.2. South America
- 5.3.3. Europe
- 5.3.4. Middle East & Africa
- 5.3.5. Asia Pacific
- 5.1. Market Analysis, Insights and Forecast - by Application
- 6. North America Cleanroom Protective Clothing Analysis, Insights and Forecast, 2019-2031
- 6.1. Market Analysis, Insights and Forecast - by Application
- 6.1.1. Electronic and Semiconductor
- 6.1.2. Pharmaceutical and Biotechnology
- 6.1.3. Medical Device Industry
- 6.1.4. Industrial
- 6.1.5. Others
- 6.2. Market Analysis, Insights and Forecast - by Types
- 6.2.1. Antistatic Clothing
- 6.2.2. Flame and Arc Flash Protective Clothing
- 6.2.3. Others
- 6.1. Market Analysis, Insights and Forecast - by Application
- 7. South America Cleanroom Protective Clothing Analysis, Insights and Forecast, 2019-2031
- 7.1. Market Analysis, Insights and Forecast - by Application
- 7.1.1. Electronic and Semiconductor
- 7.1.2. Pharmaceutical and Biotechnology
- 7.1.3. Medical Device Industry
- 7.1.4. Industrial
- 7.1.5. Others
- 7.2. Market Analysis, Insights and Forecast - by Types
- 7.2.1. Antistatic Clothing
- 7.2.2. Flame and Arc Flash Protective Clothing
- 7.2.3. Others
- 7.1. Market Analysis, Insights and Forecast - by Application
- 8. Europe Cleanroom Protective Clothing Analysis, Insights and Forecast, 2019-2031
- 8.1. Market Analysis, Insights and Forecast - by Application
- 8.1.1. Electronic and Semiconductor
- 8.1.2. Pharmaceutical and Biotechnology
- 8.1.3. Medical Device Industry
- 8.1.4. Industrial
- 8.1.5. Others
- 8.2. Market Analysis, Insights and Forecast - by Types
- 8.2.1. Antistatic Clothing
- 8.2.2. Flame and Arc Flash Protective Clothing
- 8.2.3. Others
- 8.1. Market Analysis, Insights and Forecast - by Application
- 9. Middle East & Africa Cleanroom Protective Clothing Analysis, Insights and Forecast, 2019-2031
- 9.1. Market Analysis, Insights and Forecast - by Application
- 9.1.1. Electronic and Semiconductor
- 9.1.2. Pharmaceutical and Biotechnology
- 9.1.3. Medical Device Industry
- 9.1.4. Industrial
- 9.1.5. Others
- 9.2. Market Analysis, Insights and Forecast - by Types
- 9.2.1. Antistatic Clothing
- 9.2.2. Flame and Arc Flash Protective Clothing
- 9.2.3. Others
- 9.1. Market Analysis, Insights and Forecast - by Application
- 10. Asia Pacific Cleanroom Protective Clothing Analysis, Insights and Forecast, 2019-2031
- 10.1. Market Analysis, Insights and Forecast - by Application
- 10.1.1. Electronic and Semiconductor
- 10.1.2. Pharmaceutical and Biotechnology
- 10.1.3. Medical Device Industry
- 10.1.4. Industrial
- 10.1.5. Others
- 10.2. Market Analysis, Insights and Forecast - by Types
- 10.2.1. Antistatic Clothing
- 10.2.2. Flame and Arc Flash Protective Clothing
- 10.2.3. Others
- 10.1. Market Analysis, Insights and Forecast - by Application
- 11. Competitive Analysis
- 11.1. Global Market Share Analysis 2024
- 11.2. Company Profiles
- 11.2.1 DuPont
- 11.2.1.1. Overview
- 11.2.1.2. Products
- 11.2.1.3. SWOT Analysis
- 11.2.1.4. Recent Developments
- 11.2.1.5. Financials (Based on Availability)
- 11.2.2 Kimberly-Clark Corporation
- 11.2.2.1. Overview
- 11.2.2.2. Products
- 11.2.2.3. SWOT Analysis
- 11.2.2.4. Recent Developments
- 11.2.2.5. Financials (Based on Availability)
- 11.2.3 KM Corporation
- 11.2.3.1. Overview
- 11.2.3.2. Products
- 11.2.3.3. SWOT Analysis
- 11.2.3.4. Recent Developments
- 11.2.3.5. Financials (Based on Availability)
- 11.2.4 Valutek
- 11.2.4.1. Overview
- 11.2.4.2. Products
- 11.2.4.3. SWOT Analysis
- 11.2.4.4. Recent Developments
- 11.2.4.5. Financials (Based on Availability)
- 11.2.5 Micronclean Limited
- 11.2.5.1. Overview
- 11.2.5.2. Products
- 11.2.5.3. SWOT Analysis
- 11.2.5.4. Recent Developments
- 11.2.5.5. Financials (Based on Availability)
- 11.2.6 Ansell
- 11.2.6.1. Overview
- 11.2.6.2. Products
- 11.2.6.3. SWOT Analysis
- 11.2.6.4. Recent Developments
- 11.2.6.5. Financials (Based on Availability)
- 11.2.7 Lakeland
- 11.2.7.1. Overview
- 11.2.7.2. Products
- 11.2.7.3. SWOT Analysis
- 11.2.7.4. Recent Developments
- 11.2.7.5. Financials (Based on Availability)
- 11.2.1 DuPont
List of Figures
- Figure 1: Global Cleanroom Protective Clothing Revenue Breakdown (million, %) by Region 2024 & 2032
- Figure 2: North America Cleanroom Protective Clothing Revenue (million), by Application 2024 & 2032
- Figure 3: North America Cleanroom Protective Clothing Revenue Share (%), by Application 2024 & 2032
- Figure 4: North America Cleanroom Protective Clothing Revenue (million), by Types 2024 & 2032
- Figure 5: North America Cleanroom Protective Clothing Revenue Share (%), by Types 2024 & 2032
- Figure 6: North America Cleanroom Protective Clothing Revenue (million), by Country 2024 & 2032
- Figure 7: North America Cleanroom Protective Clothing Revenue Share (%), by Country 2024 & 2032
- Figure 8: South America Cleanroom Protective Clothing Revenue (million), by Application 2024 & 2032
- Figure 9: South America Cleanroom Protective Clothing Revenue Share (%), by Application 2024 & 2032
- Figure 10: South America Cleanroom Protective Clothing Revenue (million), by Types 2024 & 2032
- Figure 11: South America Cleanroom Protective Clothing Revenue Share (%), by Types 2024 & 2032
- Figure 12: South America Cleanroom Protective Clothing Revenue (million), by Country 2024 & 2032
- Figure 13: South America Cleanroom Protective Clothing Revenue Share (%), by Country 2024 & 2032
- Figure 14: Europe Cleanroom Protective Clothing Revenue (million), by Application 2024 & 2032
- Figure 15: Europe Cleanroom Protective Clothing Revenue Share (%), by Application 2024 & 2032
- Figure 16: Europe Cleanroom Protective Clothing Revenue (million), by Types 2024 & 2032
- Figure 17: Europe Cleanroom Protective Clothing Revenue Share (%), by Types 2024 & 2032
- Figure 18: Europe Cleanroom Protective Clothing Revenue (million), by Country 2024 & 2032
- Figure 19: Europe Cleanroom Protective Clothing Revenue Share (%), by Country 2024 & 2032
- Figure 20: Middle East & Africa Cleanroom Protective Clothing Revenue (million), by Application 2024 & 2032
- Figure 21: Middle East & Africa Cleanroom Protective Clothing Revenue Share (%), by Application 2024 & 2032
- Figure 22: Middle East & Africa Cleanroom Protective Clothing Revenue (million), by Types 2024 & 2032
- Figure 23: Middle East & Africa Cleanroom Protective Clothing Revenue Share (%), by Types 2024 & 2032
- Figure 24: Middle East & Africa Cleanroom Protective Clothing Revenue (million), by Country 2024 & 2032
- Figure 25: Middle East & Africa Cleanroom Protective Clothing Revenue Share (%), by Country 2024 & 2032
- Figure 26: Asia Pacific Cleanroom Protective Clothing Revenue (million), by Application 2024 & 2032
- Figure 27: Asia Pacific Cleanroom Protective Clothing Revenue Share (%), by Application 2024 & 2032
- Figure 28: Asia Pacific Cleanroom Protective Clothing Revenue (million), by Types 2024 & 2032
- Figure 29: Asia Pacific Cleanroom Protective Clothing Revenue Share (%), by Types 2024 & 2032
- Figure 30: Asia Pacific Cleanroom Protective Clothing Revenue (million), by Country 2024 & 2032
- Figure 31: Asia Pacific Cleanroom Protective Clothing Revenue Share (%), by Country 2024 & 2032
List of Tables
- Table 1: Global Cleanroom Protective Clothing Revenue million Forecast, by Region 2019 & 2032
- Table 2: Global Cleanroom Protective Clothing Revenue million Forecast, by Application 2019 & 2032
- Table 3: Global Cleanroom Protective Clothing Revenue million Forecast, by Types 2019 & 2032
- Table 4: Global Cleanroom Protective Clothing Revenue million Forecast, by Region 2019 & 2032
- Table 5: Global Cleanroom Protective Clothing Revenue million Forecast, by Application 2019 & 2032
- Table 6: Global Cleanroom Protective Clothing Revenue million Forecast, by Types 2019 & 2032
- Table 7: Global Cleanroom Protective Clothing Revenue million Forecast, by Country 2019 & 2032
- Table 8: United States Cleanroom Protective Clothing Revenue (million) Forecast, by Application 2019 & 2032
- Table 9: Canada Cleanroom Protective Clothing Revenue (million) Forecast, by Application 2019 & 2032
- Table 10: Mexico Cleanroom Protective Clothing Revenue (million) Forecast, by Application 2019 & 2032
- Table 11: Global Cleanroom Protective Clothing Revenue million Forecast, by Application 2019 & 2032
- Table 12: Global Cleanroom Protective Clothing Revenue million Forecast, by Types 2019 & 2032
- Table 13: Global Cleanroom Protective Clothing Revenue million Forecast, by Country 2019 & 2032
- Table 14: Brazil Cleanroom Protective Clothing Revenue (million) Forecast, by Application 2019 & 2032
- Table 15: Argentina Cleanroom Protective Clothing Revenue (million) Forecast, by Application 2019 & 2032
- Table 16: Rest of South America Cleanroom Protective Clothing Revenue (million) Forecast, by Application 2019 & 2032
- Table 17: Global Cleanroom Protective Clothing Revenue million Forecast, by Application 2019 & 2032
- Table 18: Global Cleanroom Protective Clothing Revenue million Forecast, by Types 2019 & 2032
- Table 19: Global Cleanroom Protective Clothing Revenue million Forecast, by Country 2019 & 2032
- Table 20: United Kingdom Cleanroom Protective Clothing Revenue (million) Forecast, by Application 2019 & 2032
- Table 21: Germany Cleanroom Protective Clothing Revenue (million) Forecast, by Application 2019 & 2032
- Table 22: France Cleanroom Protective Clothing Revenue (million) Forecast, by Application 2019 & 2032
- Table 23: Italy Cleanroom Protective Clothing Revenue (million) Forecast, by Application 2019 & 2032
- Table 24: Spain Cleanroom Protective Clothing Revenue (million) Forecast, by Application 2019 & 2032
- Table 25: Russia Cleanroom Protective Clothing Revenue (million) Forecast, by Application 2019 & 2032
- Table 26: Benelux Cleanroom Protective Clothing Revenue (million) Forecast, by Application 2019 & 2032
- Table 27: Nordics Cleanroom Protective Clothing Revenue (million) Forecast, by Application 2019 & 2032
- Table 28: Rest of Europe Cleanroom Protective Clothing Revenue (million) Forecast, by Application 2019 & 2032
- Table 29: Global Cleanroom Protective Clothing Revenue million Forecast, by Application 2019 & 2032
- Table 30: Global Cleanroom Protective Clothing Revenue million Forecast, by Types 2019 & 2032
- Table 31: Global Cleanroom Protective Clothing Revenue million Forecast, by Country 2019 & 2032
- Table 32: Turkey Cleanroom Protective Clothing Revenue (million) Forecast, by Application 2019 & 2032
- Table 33: Israel Cleanroom Protective Clothing Revenue (million) Forecast, by Application 2019 & 2032
- Table 34: GCC Cleanroom Protective Clothing Revenue (million) Forecast, by Application 2019 & 2032
- Table 35: North Africa Cleanroom Protective Clothing Revenue (million) Forecast, by Application 2019 & 2032
- Table 36: South Africa Cleanroom Protective Clothing Revenue (million) Forecast, by Application 2019 & 2032
- Table 37: Rest of Middle East & Africa Cleanroom Protective Clothing Revenue (million) Forecast, by Application 2019 & 2032
- Table 38: Global Cleanroom Protective Clothing Revenue million Forecast, by Application 2019 & 2032
- Table 39: Global Cleanroom Protective Clothing Revenue million Forecast, by Types 2019 & 2032
- Table 40: Global Cleanroom Protective Clothing Revenue million Forecast, by Country 2019 & 2032
- Table 41: China Cleanroom Protective Clothing Revenue (million) Forecast, by Application 2019 & 2032
- Table 42: India Cleanroom Protective Clothing Revenue (million) Forecast, by Application 2019 & 2032
- Table 43: Japan Cleanroom Protective Clothing Revenue (million) Forecast, by Application 2019 & 2032
- Table 44: South Korea Cleanroom Protective Clothing Revenue (million) Forecast, by Application 2019 & 2032
- Table 45: ASEAN Cleanroom Protective Clothing Revenue (million) Forecast, by Application 2019 & 2032
- Table 46: Oceania Cleanroom Protective Clothing Revenue (million) Forecast, by Application 2019 & 2032
- Table 47: Rest of Asia Pacific Cleanroom Protective Clothing Revenue (million) Forecast, by Application 2019 & 2032
Frequently Asked Questions
1. What is the projected Compound Annual Growth Rate (CAGR) of the Cleanroom Protective Clothing?
The projected CAGR is approximately XX%.
2. Which companies are prominent players in the Cleanroom Protective Clothing?
Key companies in the market include DuPont, Kimberly-Clark Corporation, KM Corporation, Valutek, Micronclean Limited, Ansell, Lakeland.
3. What are the main segments of the Cleanroom Protective Clothing?
The market segments include Application, Types.
4. Can you provide details about the market size?
The market size is estimated to be USD XXX million as of 2022.
5. What are some drivers contributing to market growth?
N/A
6. What are the notable trends driving market growth?
N/A
7. Are there any restraints impacting market growth?
N/A
8. Can you provide examples of recent developments in the market?
N/A
9. What pricing options are available for accessing the report?
Pricing options include single-user, multi-user, and enterprise licenses priced at USD 4900.00, USD 7350.00, and USD 9800.00 respectively.
10. Is the market size provided in terms of value or volume?
The market size is provided in terms of value, measured in million.
11. Are there any specific market keywords associated with the report?
Yes, the market keyword associated with the report is "Cleanroom Protective Clothing," which aids in identifying and referencing the specific market segment covered.
12. How do I determine which pricing option suits my needs best?
The pricing options vary based on user requirements and access needs. Individual users may opt for single-user licenses, while businesses requiring broader access may choose multi-user or enterprise licenses for cost-effective access to the report.
13. Are there any additional resources or data provided in the Cleanroom Protective Clothing report?
While the report offers comprehensive insights, it's advisable to review the specific contents or supplementary materials provided to ascertain if additional resources or data are available.
14. How can I stay updated on further developments or reports in the Cleanroom Protective Clothing?
To stay informed about further developments, trends, and reports in the Cleanroom Protective Clothing, consider subscribing to industry newsletters, following relevant companies and organizations, or regularly checking reputable industry news sources and publications.
Methodology
Step 1 - Identification of Relevant Samples Size from Population Database


Step 2 - Approaches for Defining Global Market Size (Value, Volume* & Price*)

Note*: In applicable scenarios
Step 3 - Data Sources
Primary Research
- Web Analytics
- Survey Reports
- Research Institute
- Latest Research Reports
- Opinion Leaders
Secondary Research
- Annual Reports
- White Paper
- Latest Press Release
- Industry Association
- Paid Database
- Investor Presentations

Step 4 - Data Triangulation
Involves using different sources of information in order to increase the validity of a study
These sources are likely to be stakeholders in a program - participants, other researchers, program staff, other community members, and so on.
Then we put all data in single framework & apply various statistical tools to find out the dynamic on the market.
During the analysis stage, feedback from the stakeholder groups would be compared to determine areas of agreement as well as areas of divergence


