
Key Insights
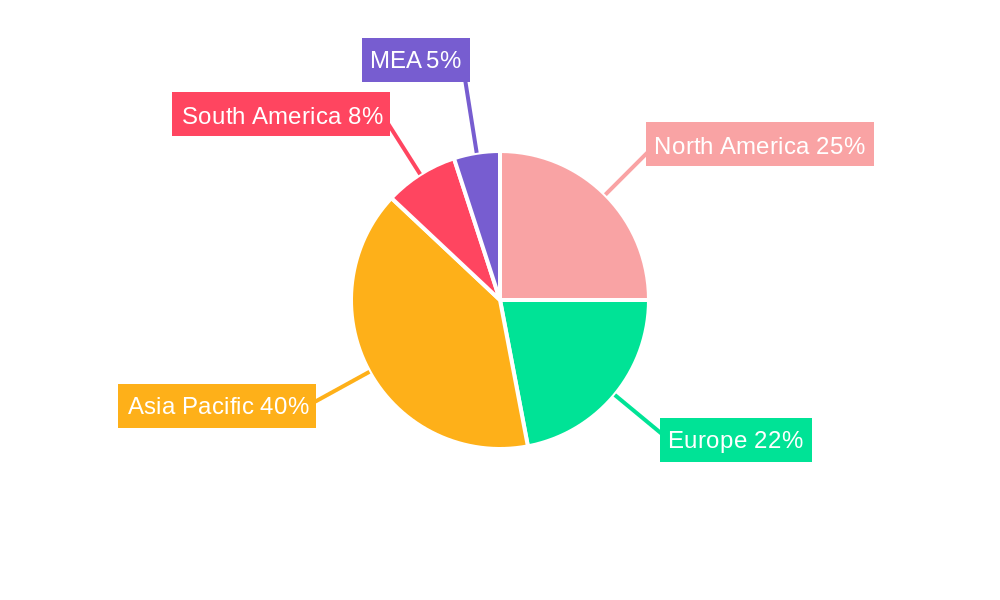
The global chromium market, valued at $22.6 billion in 2025, is projected to experience robust growth, driven by a compound annual growth rate (CAGR) of 5.5% from 2025 to 2033. This expansion is fueled by the increasing demand for stainless steel in construction, automotive, and consumer goods sectors. The chemical industry's reliance on chromium compounds for various applications, including chrome plating and leather tanning, further contributes to market growth. Furthermore, the rising use of chromium in metallurgical processes, particularly in high-temperature alloys and refractories, is a significant driver. While challenges exist, such as fluctuating raw material prices and environmental concerns surrounding chromium production and disposal, technological advancements in efficient extraction and sustainable practices are mitigating these risks. The Asia-Pacific region, particularly China and India, is expected to dominate the market due to substantial industrial growth and infrastructure development. North America and Europe also hold significant market shares, driven by established industries and ongoing investments in infrastructure renewal. Market segmentation by application reveals chemical, metallurgical, and refractory applications as key revenue generators, with other emerging applications like glass polishing, industrial catalysts, and pigments adding to the market’s diverse revenue streams. The competitive landscape features a mix of large multinational corporations and regional players, each striving for market share through innovation and strategic partnerships.
The forecast period of 2025-2033 promises continued growth, though the rate may fluctuate based on global economic conditions and policy changes. Companies are actively investing in research and development to improve production efficiency, explore alternative chromium sources, and develop more environmentally friendly processes. This commitment to sustainability, along with the inherent demand for chromium in key industries, suggests a positive outlook for the market's long-term expansion. However, careful consideration of geopolitical factors, supply chain vulnerabilities, and the potential for substitution by alternative materials will be crucial for future market performance. The market's segmentation provides opportunities for specialized players to target specific applications and geographic regions, enabling strategic growth and competitive advantage.

Chromium Market: A Comprehensive Market Analysis (2019-2033)
This in-depth report provides a comprehensive analysis of the global Chromium Market, encompassing market dynamics, growth trends, regional dominance, product landscape, key players, and future outlook. With a study period spanning 2019-2033, a base year of 2025, and a forecast period of 2025-2033, this report is an invaluable resource for industry professionals, investors, and strategic decision-makers. The parent market is the Metals and Minerals industry, while the child market is specifically Ferroalloys. The total market size is projected to reach XX Billion by 2033.
Chromium Market Dynamics & Structure
The Chromium market is characterized by moderate concentration, with a few major players holding significant market share. Technological innovation, primarily in extraction and refining processes, plays a crucial role in shaping market dynamics. Stringent environmental regulations influence production methods and operational costs. Competitive substitutes, such as alternative alloys, pose a challenge, while end-user demographics (primarily metallurgical and chemical industries) heavily influence demand. Mergers and acquisitions (M&A) activity is significant, reflecting industry consolidation and expansion strategies.
- Market Concentration: Moderately concentrated, with top 5 players holding approximately xx% market share in 2024.
- Technological Innovation: Focus on improving extraction efficiency, reducing environmental impact, and developing high-performance alloys.
- Regulatory Framework: Stringent environmental regulations impacting production costs and operational practices.
- Competitive Substitutes: Alternative alloys and materials pose a competitive threat, albeit limited in certain applications.
- End-User Demographics: Metallurgical, chemical, and refractory industries dominate demand.
- M&A Trends: Significant M&A activity driven by expansion strategies and consolidation within the industry; xx major deals recorded between 2019 and 2024, totaling approximately xx Billion USD.
Chromium Market Growth Trends & Insights
The Chromium market exhibits consistent growth, driven by increasing demand from diverse applications. The market size, valued at XX Billion in 2024, is projected to reach XX Billion by 2033, exhibiting a CAGR of xx%. This growth is attributed to expanding industrial sectors, infrastructure development, and technological advancements leading to higher chromium consumption. Adoption rates vary across applications, with metallurgical applications remaining the dominant segment. Technological disruptions, such as the development of more efficient extraction and processing methods, further accelerate market growth. Shifts in consumer behavior, towards eco-friendly materials, drive demand for sustainably produced chromium.

Dominant Regions, Countries, or Segments in Chromium Market
The metallurgical application segment currently dominates the Chromium market, contributing approximately xx% of the total market revenue in 2024. This is largely due to its extensive use in stainless steel production, which is a key driver of economic growth in several regions. South Africa and Kazakhstan emerge as dominant regions, characterized by abundant chromium ore reserves and established production infrastructure.
- Key Drivers:
- Robust growth in stainless steel production
- Increasing infrastructure development in emerging economies
- Government support and favorable economic policies in major producing countries
- Dominance Factors:
- Abundant chromium ore reserves
- Mature and established production infrastructure
- Competitive production costs
Chromium Market Product Landscape
Chromium products encompass various forms, including ferrochromium, chromium metal, and chromium chemicals. Continuous innovation focuses on improving alloy properties (e.g., higher corrosion resistance, enhanced strength), and optimizing production processes for efficiency and sustainability. Unique selling propositions are centred around product purity, consistent quality, and tailored solutions for specific applications. Advances in powder metallurgy techniques allow for the creation of novel alloys with enhanced performance characteristics.
Key Drivers, Barriers & Challenges in Chromium Market
Key Drivers:
- Growing demand from the stainless steel industry
- Expansion of the chemical and refractory sectors
- Infrastructure development in emerging economies
Challenges & Restraints:
- Fluctuations in raw material prices
- Environmental regulations and sustainability concerns
- Geopolitical risks and supply chain disruptions (estimated impact: xx% reduction in supply in certain periods)
Emerging Opportunities in Chromium Market
Emerging opportunities arise from the increasing demand for high-performance alloys in aerospace, automotive, and energy sectors. Untapped markets in developing economies offer substantial growth potential. Innovative applications, such as in 3D printing and advanced materials, further expand market horizons. Evolving consumer preferences for sustainable products drive demand for eco-friendly chromium extraction and processing techniques.
Growth Accelerators in the Chromium Market Industry
Long-term growth is fueled by technological breakthroughs in extraction and refining, enhancing efficiency and reducing environmental impact. Strategic partnerships between producers and end-users ensure stable supply chains and tailored product development. Market expansion strategies, including investments in new production facilities and exploration activities, further stimulate market growth.
Key Players Shaping the Chromium Market Market
- Tenaris
- MVC Holdings LLC
- CVK Madencilik
- Odisha Mining Corporation Ltd
- Glencore
- International Ferro Metals (IFM)
- Al Tamman Indsil FerroChrome L L C
- Kermas Investment Group
- Hernic Ferrochrome (Pty) Ltd (Hernic)
- YILDIRIM Group of Companies
- Assmang Proprietary Limited
Notable Milestones in Chromium Market Sector
- January 2022: Yildirim Group acquired Albchrome Holding, strengthening its global market position.
- June 2022: Tenaris invested USD 29 million to expand its high-chromium steel production capacity.
- November 2022: Yildirim Group acquired Elementis plc's chromium business for USD 170 million, significantly expanding its production capacity.
In-Depth Chromium Market Market Outlook
The Chromium market is poised for continued growth, driven by technological advancements, strategic partnerships, and expanding applications across diverse sectors. Strategic investments in sustainable production methods and exploration activities will further enhance market potential. Opportunities exist in developing specialized alloys for niche applications and tapping into emerging markets in developing economies. The focus on sustainability and resource efficiency will shape the future of the chromium market, attracting investment and innovation in this vital sector.
Chromium Market Segmentation
-
1. Application
- 1.1. Chemical
- 1.2. Metallurgical
- 1.3. Refractory
- 1.4. Other Ap
Chromium Market Segmentation By Geography
-
1. Asia Pacific
- 1.1. China
- 1.2. India
- 1.3. Japan
- 1.4. South Korea
- 1.5. Malaysia
- 1.6. Thailand
- 1.7. Indonesia
- 1.8. Vietnam
- 1.9. Rest of Asia Pacific
-
2. North America
- 2.1. United States
- 2.2. Canada
- 2.3. Mexico
-
3. Europe
- 3.1. Germany
- 3.2. United Kingdom
- 3.3. Italy
- 3.4. France
- 3.5. Spain
- 3.6. NORDIC
- 3.7. Turkey
- 3.8. Russia
- 3.9. Rest of Europe
-
4. South America
- 4.1. Brazil
- 4.2. Argentina
- 4.3. Colombia
- 4.4. Rest of South America
-
5. Middle East and Africa
- 5.1. Saudi Arabia
- 5.2. South Africa
- 5.3. Nigeria
- 5.4. Qatar
- 5.5. Egypt
- 5.6. United Arab Emirates
- 5.7. Rest of Middle East and Africa
Chromium Market REPORT HIGHLIGHTS
| Aspects | Details |
|---|---|
| Study Period | 2019-2033 |
| Base Year | 2024 |
| Estimated Year | 2025 |
| Forecast Period | 2025-2033 |
| Historical Period | 2019-2024 |
| Growth Rate | CAGR of 5.5% from 2019-2033 |
| Segmentation |
|
Table of Contents
- 1. Introduction
- 1.1. Research Scope
- 1.2. Market Segmentation
- 1.3. Research Methodology
- 1.4. Definitions and Assumptions
- 2. Executive Summary
- 2.1. Introduction
- 3. Market Dynamics
- 3.1. Introduction
- 3.2. Market Drivers
- 3.2.1. Growing Demand for Metallurgical Uses; Increasing Refractory Applications in Industries; Other Drivers
- 3.3. Market Restrains
- 3.3.1. Associated Health Effects; Other Restraints
- 3.4. Market Trends
- 3.4.1. Metallurgical Applications to Witness Growth in Future
- 4. Market Factor Analysis
- 4.1. Porters Five Forces
- 4.2. Supply/Value Chain
- 4.3. PESTEL analysis
- 4.4. Market Entropy
- 4.5. Patent/Trademark Analysis
- 5. Global Chromium Market Analysis, Insights and Forecast, 2019-2031
- 5.1. Market Analysis, Insights and Forecast - by Application
- 5.1.1. Chemical
- 5.1.2. Metallurgical
- 5.1.3. Refractory
- 5.1.4. Other Ap
- 5.2. Market Analysis, Insights and Forecast - by Region
- 5.2.1. Asia Pacific
- 5.2.2. North America
- 5.2.3. Europe
- 5.2.4. South America
- 5.2.5. Middle East and Africa
- 5.1. Market Analysis, Insights and Forecast - by Application
- 6. Asia Pacific Chromium Market Analysis, Insights and Forecast, 2019-2031
- 6.1. Market Analysis, Insights and Forecast - by Application
- 6.1.1. Chemical
- 6.1.2. Metallurgical
- 6.1.3. Refractory
- 6.1.4. Other Ap
- 6.1. Market Analysis, Insights and Forecast - by Application
- 7. North America Chromium Market Analysis, Insights and Forecast, 2019-2031
- 7.1. Market Analysis, Insights and Forecast - by Application
- 7.1.1. Chemical
- 7.1.2. Metallurgical
- 7.1.3. Refractory
- 7.1.4. Other Ap
- 7.1. Market Analysis, Insights and Forecast - by Application
- 8. Europe Chromium Market Analysis, Insights and Forecast, 2019-2031
- 8.1. Market Analysis, Insights and Forecast - by Application
- 8.1.1. Chemical
- 8.1.2. Metallurgical
- 8.1.3. Refractory
- 8.1.4. Other Ap
- 8.1. Market Analysis, Insights and Forecast - by Application
- 9. South America Chromium Market Analysis, Insights and Forecast, 2019-2031
- 9.1. Market Analysis, Insights and Forecast - by Application
- 9.1.1. Chemical
- 9.1.2. Metallurgical
- 9.1.3. Refractory
- 9.1.4. Other Ap
- 9.1. Market Analysis, Insights and Forecast - by Application
- 10. Middle East and Africa Chromium Market Analysis, Insights and Forecast, 2019-2031
- 10.1. Market Analysis, Insights and Forecast - by Application
- 10.1.1. Chemical
- 10.1.2. Metallurgical
- 10.1.3. Refractory
- 10.1.4. Other Ap
- 10.1. Market Analysis, Insights and Forecast - by Application
- 11. North America Chromium Market Analysis, Insights and Forecast, 2019-2031
- 11.1. Market Analysis, Insights and Forecast - By Country/Sub-region
- 11.1.1 United States
- 11.1.2 Canada
- 11.1.3 Mexico
- 12. Europe Chromium Market Analysis, Insights and Forecast, 2019-2031
- 12.1. Market Analysis, Insights and Forecast - By Country/Sub-region
- 12.1.1 Germany
- 12.1.2 France
- 12.1.3 Italy
- 12.1.4 United Kingdom
- 12.1.5 Netherlands
- 12.1.6 Rest of Europe
- 13. Asia Pacific Chromium Market Analysis, Insights and Forecast, 2019-2031
- 13.1. Market Analysis, Insights and Forecast - By Country/Sub-region
- 13.1.1 China
- 13.1.2 Japan
- 13.1.3 India
- 13.1.4 South Korea
- 13.1.5 Taiwan
- 13.1.6 Australia
- 13.1.7 Rest of Asia-Pacific
- 14. South America Chromium Market Analysis, Insights and Forecast, 2019-2031
- 14.1. Market Analysis, Insights and Forecast - By Country/Sub-region
- 14.1.1 Brazil
- 14.1.2 Argentina
- 14.1.3 Rest of South America
- 15. MEA Chromium Market Analysis, Insights and Forecast, 2019-2031
- 15.1. Market Analysis, Insights and Forecast - By Country/Sub-region
- 15.1.1 Middle East
- 15.1.2 Africa
- 16. Competitive Analysis
- 16.1. Global Market Share Analysis 2024
- 16.2. Company Profiles
- 16.2.1 Tenaris
- 16.2.1.1. Overview
- 16.2.1.2. Products
- 16.2.1.3. SWOT Analysis
- 16.2.1.4. Recent Developments
- 16.2.1.5. Financials (Based on Availability)
- 16.2.2 MVC Holdings LLC
- 16.2.2.1. Overview
- 16.2.2.2. Products
- 16.2.2.3. SWOT Analysis
- 16.2.2.4. Recent Developments
- 16.2.2.5. Financials (Based on Availability)
- 16.2.3 CVK Madencilik
- 16.2.3.1. Overview
- 16.2.3.2. Products
- 16.2.3.3. SWOT Analysis
- 16.2.3.4. Recent Developments
- 16.2.3.5. Financials (Based on Availability)
- 16.2.4 Odisha Mining Corporation Ltd
- 16.2.4.1. Overview
- 16.2.4.2. Products
- 16.2.4.3. SWOT Analysis
- 16.2.4.4. Recent Developments
- 16.2.4.5. Financials (Based on Availability)
- 16.2.5 Glencore
- 16.2.5.1. Overview
- 16.2.5.2. Products
- 16.2.5.3. SWOT Analysis
- 16.2.5.4. Recent Developments
- 16.2.5.5. Financials (Based on Availability)
- 16.2.6 International Ferro Metals (IFM)
- 16.2.6.1. Overview
- 16.2.6.2. Products
- 16.2.6.3. SWOT Analysis
- 16.2.6.4. Recent Developments
- 16.2.6.5. Financials (Based on Availability)
- 16.2.7 Al Tamman Indsil FerroChrome L L C
- 16.2.7.1. Overview
- 16.2.7.2. Products
- 16.2.7.3. SWOT Analysis
- 16.2.7.4. Recent Developments
- 16.2.7.5. Financials (Based on Availability)
- 16.2.8 Kermas Investment Group
- 16.2.8.1. Overview
- 16.2.8.2. Products
- 16.2.8.3. SWOT Analysis
- 16.2.8.4. Recent Developments
- 16.2.8.5. Financials (Based on Availability)
- 16.2.9 Hernic Ferrochrome (Pty) Ltd (Hernic)
- 16.2.9.1. Overview
- 16.2.9.2. Products
- 16.2.9.3. SWOT Analysis
- 16.2.9.4. Recent Developments
- 16.2.9.5. Financials (Based on Availability)
- 16.2.10 YILDIRIM Group of Companies
- 16.2.10.1. Overview
- 16.2.10.2. Products
- 16.2.10.3. SWOT Analysis
- 16.2.10.4. Recent Developments
- 16.2.10.5. Financials (Based on Availability)
- 16.2.11 Assmang Proprietary Limited
- 16.2.11.1. Overview
- 16.2.11.2. Products
- 16.2.11.3. SWOT Analysis
- 16.2.11.4. Recent Developments
- 16.2.11.5. Financials (Based on Availability)
- 16.2.1 Tenaris
List of Figures
- Figure 1: Global Chromium Market Revenue Breakdown (Billion, %) by Region 2024 & 2032
- Figure 2: Global Chromium Market Volume Breakdown (K Tons, %) by Region 2024 & 2032
- Figure 3: North America Chromium Market Revenue (Billion), by Country 2024 & 2032
- Figure 4: North America Chromium Market Volume (K Tons), by Country 2024 & 2032
- Figure 5: North America Chromium Market Revenue Share (%), by Country 2024 & 2032
- Figure 6: North America Chromium Market Volume Share (%), by Country 2024 & 2032
- Figure 7: Europe Chromium Market Revenue (Billion), by Country 2024 & 2032
- Figure 8: Europe Chromium Market Volume (K Tons), by Country 2024 & 2032
- Figure 9: Europe Chromium Market Revenue Share (%), by Country 2024 & 2032
- Figure 10: Europe Chromium Market Volume Share (%), by Country 2024 & 2032
- Figure 11: Asia Pacific Chromium Market Revenue (Billion), by Country 2024 & 2032
- Figure 12: Asia Pacific Chromium Market Volume (K Tons), by Country 2024 & 2032
- Figure 13: Asia Pacific Chromium Market Revenue Share (%), by Country 2024 & 2032
- Figure 14: Asia Pacific Chromium Market Volume Share (%), by Country 2024 & 2032
- Figure 15: South America Chromium Market Revenue (Billion), by Country 2024 & 2032
- Figure 16: South America Chromium Market Volume (K Tons), by Country 2024 & 2032
- Figure 17: South America Chromium Market Revenue Share (%), by Country 2024 & 2032
- Figure 18: South America Chromium Market Volume Share (%), by Country 2024 & 2032
- Figure 19: MEA Chromium Market Revenue (Billion), by Country 2024 & 2032
- Figure 20: MEA Chromium Market Volume (K Tons), by Country 2024 & 2032
- Figure 21: MEA Chromium Market Revenue Share (%), by Country 2024 & 2032
- Figure 22: MEA Chromium Market Volume Share (%), by Country 2024 & 2032
- Figure 23: Asia Pacific Chromium Market Revenue (Billion), by Application 2024 & 2032
- Figure 24: Asia Pacific Chromium Market Volume (K Tons), by Application 2024 & 2032
- Figure 25: Asia Pacific Chromium Market Revenue Share (%), by Application 2024 & 2032
- Figure 26: Asia Pacific Chromium Market Volume Share (%), by Application 2024 & 2032
- Figure 27: Asia Pacific Chromium Market Revenue (Billion), by Country 2024 & 2032
- Figure 28: Asia Pacific Chromium Market Volume (K Tons), by Country 2024 & 2032
- Figure 29: Asia Pacific Chromium Market Revenue Share (%), by Country 2024 & 2032
- Figure 30: Asia Pacific Chromium Market Volume Share (%), by Country 2024 & 2032
- Figure 31: North America Chromium Market Revenue (Billion), by Application 2024 & 2032
- Figure 32: North America Chromium Market Volume (K Tons), by Application 2024 & 2032
- Figure 33: North America Chromium Market Revenue Share (%), by Application 2024 & 2032
- Figure 34: North America Chromium Market Volume Share (%), by Application 2024 & 2032
- Figure 35: North America Chromium Market Revenue (Billion), by Country 2024 & 2032
- Figure 36: North America Chromium Market Volume (K Tons), by Country 2024 & 2032
- Figure 37: North America Chromium Market Revenue Share (%), by Country 2024 & 2032
- Figure 38: North America Chromium Market Volume Share (%), by Country 2024 & 2032
- Figure 39: Europe Chromium Market Revenue (Billion), by Application 2024 & 2032
- Figure 40: Europe Chromium Market Volume (K Tons), by Application 2024 & 2032
- Figure 41: Europe Chromium Market Revenue Share (%), by Application 2024 & 2032
- Figure 42: Europe Chromium Market Volume Share (%), by Application 2024 & 2032
- Figure 43: Europe Chromium Market Revenue (Billion), by Country 2024 & 2032
- Figure 44: Europe Chromium Market Volume (K Tons), by Country 2024 & 2032
- Figure 45: Europe Chromium Market Revenue Share (%), by Country 2024 & 2032
- Figure 46: Europe Chromium Market Volume Share (%), by Country 2024 & 2032
- Figure 47: South America Chromium Market Revenue (Billion), by Application 2024 & 2032
- Figure 48: South America Chromium Market Volume (K Tons), by Application 2024 & 2032
- Figure 49: South America Chromium Market Revenue Share (%), by Application 2024 & 2032
- Figure 50: South America Chromium Market Volume Share (%), by Application 2024 & 2032
- Figure 51: South America Chromium Market Revenue (Billion), by Country 2024 & 2032
- Figure 52: South America Chromium Market Volume (K Tons), by Country 2024 & 2032
- Figure 53: South America Chromium Market Revenue Share (%), by Country 2024 & 2032
- Figure 54: South America Chromium Market Volume Share (%), by Country 2024 & 2032
- Figure 55: Middle East and Africa Chromium Market Revenue (Billion), by Application 2024 & 2032
- Figure 56: Middle East and Africa Chromium Market Volume (K Tons), by Application 2024 & 2032
- Figure 57: Middle East and Africa Chromium Market Revenue Share (%), by Application 2024 & 2032
- Figure 58: Middle East and Africa Chromium Market Volume Share (%), by Application 2024 & 2032
- Figure 59: Middle East and Africa Chromium Market Revenue (Billion), by Country 2024 & 2032
- Figure 60: Middle East and Africa Chromium Market Volume (K Tons), by Country 2024 & 2032
- Figure 61: Middle East and Africa Chromium Market Revenue Share (%), by Country 2024 & 2032
- Figure 62: Middle East and Africa Chromium Market Volume Share (%), by Country 2024 & 2032
List of Tables
- Table 1: Global Chromium Market Revenue Billion Forecast, by Region 2019 & 2032
- Table 2: Global Chromium Market Volume K Tons Forecast, by Region 2019 & 2032
- Table 3: Global Chromium Market Revenue Billion Forecast, by Application 2019 & 2032
- Table 4: Global Chromium Market Volume K Tons Forecast, by Application 2019 & 2032
- Table 5: Global Chromium Market Revenue Billion Forecast, by Region 2019 & 2032
- Table 6: Global Chromium Market Volume K Tons Forecast, by Region 2019 & 2032
- Table 7: Global Chromium Market Revenue Billion Forecast, by Country 2019 & 2032
- Table 8: Global Chromium Market Volume K Tons Forecast, by Country 2019 & 2032
- Table 9: United States Chromium Market Revenue (Billion) Forecast, by Application 2019 & 2032
- Table 10: United States Chromium Market Volume (K Tons) Forecast, by Application 2019 & 2032
- Table 11: Canada Chromium Market Revenue (Billion) Forecast, by Application 2019 & 2032
- Table 12: Canada Chromium Market Volume (K Tons) Forecast, by Application 2019 & 2032
- Table 13: Mexico Chromium Market Revenue (Billion) Forecast, by Application 2019 & 2032
- Table 14: Mexico Chromium Market Volume (K Tons) Forecast, by Application 2019 & 2032
- Table 15: Global Chromium Market Revenue Billion Forecast, by Country 2019 & 2032
- Table 16: Global Chromium Market Volume K Tons Forecast, by Country 2019 & 2032
- Table 17: Germany Chromium Market Revenue (Billion) Forecast, by Application 2019 & 2032
- Table 18: Germany Chromium Market Volume (K Tons) Forecast, by Application 2019 & 2032
- Table 19: France Chromium Market Revenue (Billion) Forecast, by Application 2019 & 2032
- Table 20: France Chromium Market Volume (K Tons) Forecast, by Application 2019 & 2032
- Table 21: Italy Chromium Market Revenue (Billion) Forecast, by Application 2019 & 2032
- Table 22: Italy Chromium Market Volume (K Tons) Forecast, by Application 2019 & 2032
- Table 23: United Kingdom Chromium Market Revenue (Billion) Forecast, by Application 2019 & 2032
- Table 24: United Kingdom Chromium Market Volume (K Tons) Forecast, by Application 2019 & 2032
- Table 25: Netherlands Chromium Market Revenue (Billion) Forecast, by Application 2019 & 2032
- Table 26: Netherlands Chromium Market Volume (K Tons) Forecast, by Application 2019 & 2032
- Table 27: Rest of Europe Chromium Market Revenue (Billion) Forecast, by Application 2019 & 2032
- Table 28: Rest of Europe Chromium Market Volume (K Tons) Forecast, by Application 2019 & 2032
- Table 29: Global Chromium Market Revenue Billion Forecast, by Country 2019 & 2032
- Table 30: Global Chromium Market Volume K Tons Forecast, by Country 2019 & 2032
- Table 31: China Chromium Market Revenue (Billion) Forecast, by Application 2019 & 2032
- Table 32: China Chromium Market Volume (K Tons) Forecast, by Application 2019 & 2032
- Table 33: Japan Chromium Market Revenue (Billion) Forecast, by Application 2019 & 2032
- Table 34: Japan Chromium Market Volume (K Tons) Forecast, by Application 2019 & 2032
- Table 35: India Chromium Market Revenue (Billion) Forecast, by Application 2019 & 2032
- Table 36: India Chromium Market Volume (K Tons) Forecast, by Application 2019 & 2032
- Table 37: South Korea Chromium Market Revenue (Billion) Forecast, by Application 2019 & 2032
- Table 38: South Korea Chromium Market Volume (K Tons) Forecast, by Application 2019 & 2032
- Table 39: Taiwan Chromium Market Revenue (Billion) Forecast, by Application 2019 & 2032
- Table 40: Taiwan Chromium Market Volume (K Tons) Forecast, by Application 2019 & 2032
- Table 41: Australia Chromium Market Revenue (Billion) Forecast, by Application 2019 & 2032
- Table 42: Australia Chromium Market Volume (K Tons) Forecast, by Application 2019 & 2032
- Table 43: Rest of Asia-Pacific Chromium Market Revenue (Billion) Forecast, by Application 2019 & 2032
- Table 44: Rest of Asia-Pacific Chromium Market Volume (K Tons) Forecast, by Application 2019 & 2032
- Table 45: Global Chromium Market Revenue Billion Forecast, by Country 2019 & 2032
- Table 46: Global Chromium Market Volume K Tons Forecast, by Country 2019 & 2032
- Table 47: Brazil Chromium Market Revenue (Billion) Forecast, by Application 2019 & 2032
- Table 48: Brazil Chromium Market Volume (K Tons) Forecast, by Application 2019 & 2032
- Table 49: Argentina Chromium Market Revenue (Billion) Forecast, by Application 2019 & 2032
- Table 50: Argentina Chromium Market Volume (K Tons) Forecast, by Application 2019 & 2032
- Table 51: Rest of South America Chromium Market Revenue (Billion) Forecast, by Application 2019 & 2032
- Table 52: Rest of South America Chromium Market Volume (K Tons) Forecast, by Application 2019 & 2032
- Table 53: Global Chromium Market Revenue Billion Forecast, by Country 2019 & 2032
- Table 54: Global Chromium Market Volume K Tons Forecast, by Country 2019 & 2032
- Table 55: Middle East Chromium Market Revenue (Billion) Forecast, by Application 2019 & 2032
- Table 56: Middle East Chromium Market Volume (K Tons) Forecast, by Application 2019 & 2032
- Table 57: Africa Chromium Market Revenue (Billion) Forecast, by Application 2019 & 2032
- Table 58: Africa Chromium Market Volume (K Tons) Forecast, by Application 2019 & 2032
- Table 59: Global Chromium Market Revenue Billion Forecast, by Application 2019 & 2032
- Table 60: Global Chromium Market Volume K Tons Forecast, by Application 2019 & 2032
- Table 61: Global Chromium Market Revenue Billion Forecast, by Country 2019 & 2032
- Table 62: Global Chromium Market Volume K Tons Forecast, by Country 2019 & 2032
- Table 63: China Chromium Market Revenue (Billion) Forecast, by Application 2019 & 2032
- Table 64: China Chromium Market Volume (K Tons) Forecast, by Application 2019 & 2032
- Table 65: India Chromium Market Revenue (Billion) Forecast, by Application 2019 & 2032
- Table 66: India Chromium Market Volume (K Tons) Forecast, by Application 2019 & 2032
- Table 67: Japan Chromium Market Revenue (Billion) Forecast, by Application 2019 & 2032
- Table 68: Japan Chromium Market Volume (K Tons) Forecast, by Application 2019 & 2032
- Table 69: South Korea Chromium Market Revenue (Billion) Forecast, by Application 2019 & 2032
- Table 70: South Korea Chromium Market Volume (K Tons) Forecast, by Application 2019 & 2032
- Table 71: Malaysia Chromium Market Revenue (Billion) Forecast, by Application 2019 & 2032
- Table 72: Malaysia Chromium Market Volume (K Tons) Forecast, by Application 2019 & 2032
- Table 73: Thailand Chromium Market Revenue (Billion) Forecast, by Application 2019 & 2032
- Table 74: Thailand Chromium Market Volume (K Tons) Forecast, by Application 2019 & 2032
- Table 75: Indonesia Chromium Market Revenue (Billion) Forecast, by Application 2019 & 2032
- Table 76: Indonesia Chromium Market Volume (K Tons) Forecast, by Application 2019 & 2032
- Table 77: Vietnam Chromium Market Revenue (Billion) Forecast, by Application 2019 & 2032
- Table 78: Vietnam Chromium Market Volume (K Tons) Forecast, by Application 2019 & 2032
- Table 79: Rest of Asia Pacific Chromium Market Revenue (Billion) Forecast, by Application 2019 & 2032
- Table 80: Rest of Asia Pacific Chromium Market Volume (K Tons) Forecast, by Application 2019 & 2032
- Table 81: Global Chromium Market Revenue Billion Forecast, by Application 2019 & 2032
- Table 82: Global Chromium Market Volume K Tons Forecast, by Application 2019 & 2032
- Table 83: Global Chromium Market Revenue Billion Forecast, by Country 2019 & 2032
- Table 84: Global Chromium Market Volume K Tons Forecast, by Country 2019 & 2032
- Table 85: United States Chromium Market Revenue (Billion) Forecast, by Application 2019 & 2032
- Table 86: United States Chromium Market Volume (K Tons) Forecast, by Application 2019 & 2032
- Table 87: Canada Chromium Market Revenue (Billion) Forecast, by Application 2019 & 2032
- Table 88: Canada Chromium Market Volume (K Tons) Forecast, by Application 2019 & 2032
- Table 89: Mexico Chromium Market Revenue (Billion) Forecast, by Application 2019 & 2032
- Table 90: Mexico Chromium Market Volume (K Tons) Forecast, by Application 2019 & 2032
- Table 91: Global Chromium Market Revenue Billion Forecast, by Application 2019 & 2032
- Table 92: Global Chromium Market Volume K Tons Forecast, by Application 2019 & 2032
- Table 93: Global Chromium Market Revenue Billion Forecast, by Country 2019 & 2032
- Table 94: Global Chromium Market Volume K Tons Forecast, by Country 2019 & 2032
- Table 95: Germany Chromium Market Revenue (Billion) Forecast, by Application 2019 & 2032
- Table 96: Germany Chromium Market Volume (K Tons) Forecast, by Application 2019 & 2032
- Table 97: United Kingdom Chromium Market Revenue (Billion) Forecast, by Application 2019 & 2032
- Table 98: United Kingdom Chromium Market Volume (K Tons) Forecast, by Application 2019 & 2032
- Table 99: Italy Chromium Market Revenue (Billion) Forecast, by Application 2019 & 2032
- Table 100: Italy Chromium Market Volume (K Tons) Forecast, by Application 2019 & 2032
- Table 101: France Chromium Market Revenue (Billion) Forecast, by Application 2019 & 2032
- Table 102: France Chromium Market Volume (K Tons) Forecast, by Application 2019 & 2032
- Table 103: Spain Chromium Market Revenue (Billion) Forecast, by Application 2019 & 2032
- Table 104: Spain Chromium Market Volume (K Tons) Forecast, by Application 2019 & 2032
- Table 105: NORDIC Chromium Market Revenue (Billion) Forecast, by Application 2019 & 2032
- Table 106: NORDIC Chromium Market Volume (K Tons) Forecast, by Application 2019 & 2032
- Table 107: Turkey Chromium Market Revenue (Billion) Forecast, by Application 2019 & 2032
- Table 108: Turkey Chromium Market Volume (K Tons) Forecast, by Application 2019 & 2032
- Table 109: Russia Chromium Market Revenue (Billion) Forecast, by Application 2019 & 2032
- Table 110: Russia Chromium Market Volume (K Tons) Forecast, by Application 2019 & 2032
- Table 111: Rest of Europe Chromium Market Revenue (Billion) Forecast, by Application 2019 & 2032
- Table 112: Rest of Europe Chromium Market Volume (K Tons) Forecast, by Application 2019 & 2032
- Table 113: Global Chromium Market Revenue Billion Forecast, by Application 2019 & 2032
- Table 114: Global Chromium Market Volume K Tons Forecast, by Application 2019 & 2032
- Table 115: Global Chromium Market Revenue Billion Forecast, by Country 2019 & 2032
- Table 116: Global Chromium Market Volume K Tons Forecast, by Country 2019 & 2032
- Table 117: Brazil Chromium Market Revenue (Billion) Forecast, by Application 2019 & 2032
- Table 118: Brazil Chromium Market Volume (K Tons) Forecast, by Application 2019 & 2032
- Table 119: Argentina Chromium Market Revenue (Billion) Forecast, by Application 2019 & 2032
- Table 120: Argentina Chromium Market Volume (K Tons) Forecast, by Application 2019 & 2032
- Table 121: Colombia Chromium Market Revenue (Billion) Forecast, by Application 2019 & 2032
- Table 122: Colombia Chromium Market Volume (K Tons) Forecast, by Application 2019 & 2032
- Table 123: Rest of South America Chromium Market Revenue (Billion) Forecast, by Application 2019 & 2032
- Table 124: Rest of South America Chromium Market Volume (K Tons) Forecast, by Application 2019 & 2032
- Table 125: Global Chromium Market Revenue Billion Forecast, by Application 2019 & 2032
- Table 126: Global Chromium Market Volume K Tons Forecast, by Application 2019 & 2032
- Table 127: Global Chromium Market Revenue Billion Forecast, by Country 2019 & 2032
- Table 128: Global Chromium Market Volume K Tons Forecast, by Country 2019 & 2032
- Table 129: Saudi Arabia Chromium Market Revenue (Billion) Forecast, by Application 2019 & 2032
- Table 130: Saudi Arabia Chromium Market Volume (K Tons) Forecast, by Application 2019 & 2032
- Table 131: South Africa Chromium Market Revenue (Billion) Forecast, by Application 2019 & 2032
- Table 132: South Africa Chromium Market Volume (K Tons) Forecast, by Application 2019 & 2032
- Table 133: Nigeria Chromium Market Revenue (Billion) Forecast, by Application 2019 & 2032
- Table 134: Nigeria Chromium Market Volume (K Tons) Forecast, by Application 2019 & 2032
- Table 135: Qatar Chromium Market Revenue (Billion) Forecast, by Application 2019 & 2032
- Table 136: Qatar Chromium Market Volume (K Tons) Forecast, by Application 2019 & 2032
- Table 137: Egypt Chromium Market Revenue (Billion) Forecast, by Application 2019 & 2032
- Table 138: Egypt Chromium Market Volume (K Tons) Forecast, by Application 2019 & 2032
- Table 139: United Arab Emirates Chromium Market Revenue (Billion) Forecast, by Application 2019 & 2032
- Table 140: United Arab Emirates Chromium Market Volume (K Tons) Forecast, by Application 2019 & 2032
- Table 141: Rest of Middle East and Africa Chromium Market Revenue (Billion) Forecast, by Application 2019 & 2032
- Table 142: Rest of Middle East and Africa Chromium Market Volume (K Tons) Forecast, by Application 2019 & 2032
Frequently Asked Questions
1. What is the projected Compound Annual Growth Rate (CAGR) of the Chromium Market?
The projected CAGR is approximately 5.5%.
2. Which companies are prominent players in the Chromium Market?
Key companies in the market include Tenaris, MVC Holdings LLC, CVK Madencilik, Odisha Mining Corporation Ltd, Glencore, International Ferro Metals (IFM), Al Tamman Indsil FerroChrome L L C, Kermas Investment Group, Hernic Ferrochrome (Pty) Ltd (Hernic), YILDIRIM Group of Companies, Assmang Proprietary Limited.
3. What are the main segments of the Chromium Market?
The market segments include Application.
4. Can you provide details about the market size?
The market size is estimated to be USD 22.6 Billion as of 2022.
5. What are some drivers contributing to market growth?
Growing Demand for Metallurgical Uses; Increasing Refractory Applications in Industries; Other Drivers.
6. What are the notable trends driving market growth?
Metallurgical Applications to Witness Growth in Future.
7. Are there any restraints impacting market growth?
Associated Health Effects; Other Restraints.
8. Can you provide examples of recent developments in the market?
November 2022: Yildirim Group announced the acquisition of 100% shares of Elementis plc's chromium business for an enterprise value of USD 170 million. With this agreement in place, Yildirim Group has acquired Elementis Chromium's two production facilities in Corpus Christi (TX) and Castle Hayne (NC), as well as three facilities in Amarillo (TX), Dakota (NE) and Milwaukee (WI).
9. What pricing options are available for accessing the report?
Pricing options include single-user, multi-user, and enterprise licenses priced at USD 3,950, USD 4,950, and USD 6,950 respectively.
10. Is the market size provided in terms of value or volume?
The market size is provided in terms of value, measured in Billion and volume, measured in K Tons.
11. Are there any specific market keywords associated with the report?
Yes, the market keyword associated with the report is "Chromium Market," which aids in identifying and referencing the specific market segment covered.
12. How do I determine which pricing option suits my needs best?
The pricing options vary based on user requirements and access needs. Individual users may opt for single-user licenses, while businesses requiring broader access may choose multi-user or enterprise licenses for cost-effective access to the report.
13. Are there any additional resources or data provided in the Chromium Market report?
While the report offers comprehensive insights, it's advisable to review the specific contents or supplementary materials provided to ascertain if additional resources or data are available.
14. How can I stay updated on further developments or reports in the Chromium Market?
To stay informed about further developments, trends, and reports in the Chromium Market, consider subscribing to industry newsletters, following relevant companies and organizations, or regularly checking reputable industry news sources and publications.
Methodology
Step 1 - Identification of Relevant Samples Size from Population Database


Step 2 - Approaches for Defining Global Market Size (Value, Volume* & Price*)

Note*: In applicable scenarios
Step 3 - Data Sources
Primary Research
- Web Analytics
- Survey Reports
- Research Institute
- Latest Research Reports
- Opinion Leaders
Secondary Research
- Annual Reports
- White Paper
- Latest Press Release
- Industry Association
- Paid Database
- Investor Presentations

Step 4 - Data Triangulation
Involves using different sources of information in order to increase the validity of a study
These sources are likely to be stakeholders in a program - participants, other researchers, program staff, other community members, and so on.
Then we put all data in single framework & apply various statistical tools to find out the dynamic on the market.
During the analysis stage, feedback from the stakeholder groups would be compared to determine areas of agreement as well as areas of divergence


