

Key Insights
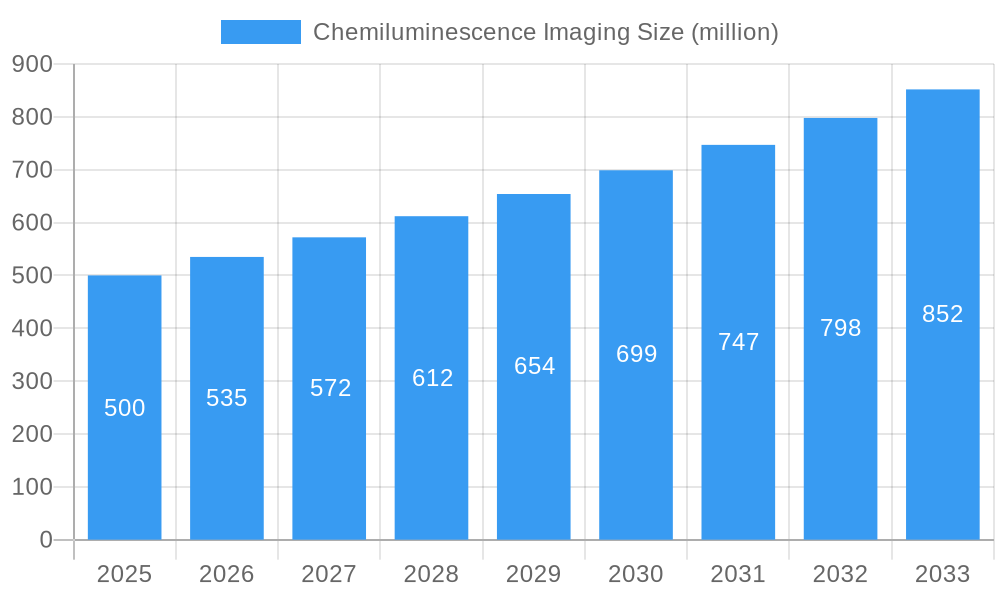
The chemiluminescence imaging market is experiencing robust growth, driven by increasing applications in life sciences research, drug discovery, and clinical diagnostics. The market's expansion is fueled by the technology's high sensitivity and specificity in detecting bioluminescent and chemiluminescent signals, enabling researchers to visualize and quantify biological processes with unprecedented precision. Advances in detector technology, including the development of high-resolution CCD and CMOS cameras, are further enhancing image quality and analysis capabilities. The integration of advanced image analysis software is streamlining workflows and facilitating quantitative data analysis, contributing significantly to market growth. Furthermore, the growing adoption of chemiluminescence imaging in high-throughput screening assays and automated platforms is driving demand for sophisticated and efficient imaging systems. We estimate the market size in 2025 to be approximately $500 million, with a compound annual growth rate (CAGR) of 7% projected from 2025 to 2033, indicating a significant market opportunity.
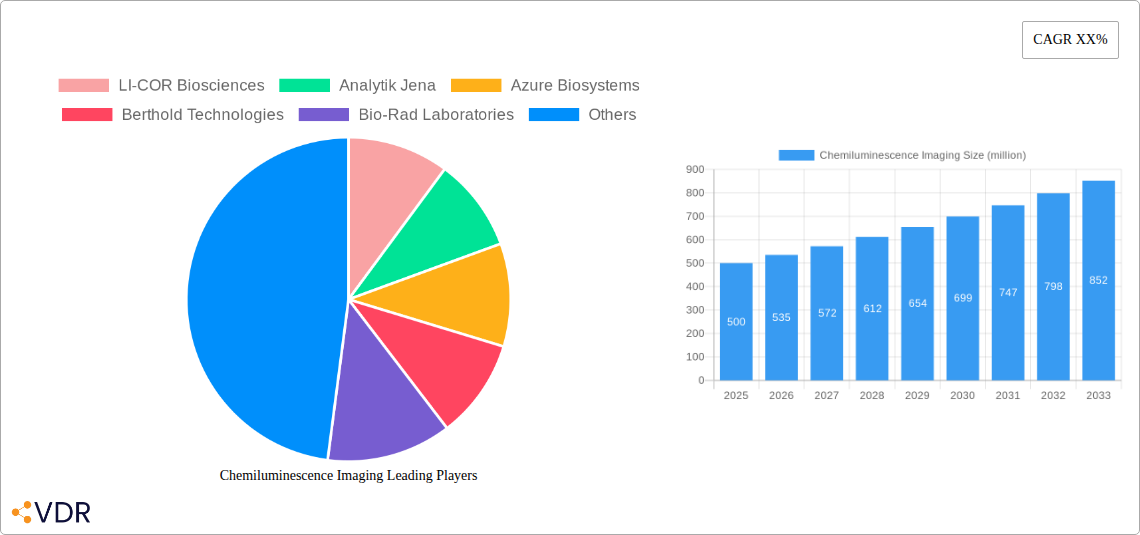
Chemiluminescence Imaging Market Size (In Million)
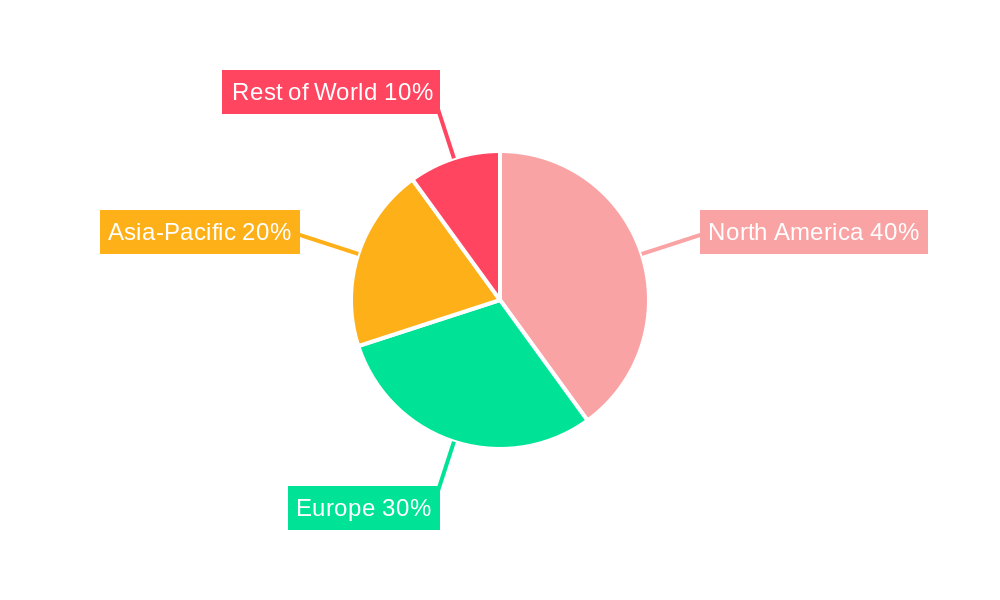
Despite the positive outlook, certain restraints affect market growth. The high cost of sophisticated chemiluminescence imaging systems can be a barrier for smaller research institutions and laboratories. Moreover, the need for specialized training and expertise in image acquisition and analysis can limit adoption, particularly in regions with limited resources. However, the ongoing development of user-friendly systems and comprehensive training programs is expected to mitigate these challenges. Competitive landscape is highly fragmented with numerous established companies such as LI-COR Biosciences, PerkinElmer, and Thermo Fisher Scientific competing alongside smaller players, resulting in innovation and competitive pricing. The market is further segmented by application (e.g., proteomics, genomics, immunoblotting), technology (e.g., CCD, CMOS), and end-user (e.g., academic research, pharmaceutical companies). The North American market currently holds a significant share, driven by substantial investments in life science research and development, followed by Europe and Asia-Pacific.
Chemiluminescence Imaging Company Market Share
Chemiluminescence Imaging Market Report: 2019-2033
This comprehensive report provides a detailed analysis of the chemiluminescence imaging market, encompassing market dynamics, growth trends, regional segmentation, product landscape, key players, and future outlook. The study period covers 2019-2033, with 2025 as the base and estimated year. The forecast period spans 2025-2033, and the historical period covers 2019-2024. This report is essential for industry professionals, investors, and researchers seeking a deep understanding of this rapidly evolving market, valued at xx million USD in 2025 and projected to reach xx million USD by 2033. Parent market is the in-vitro diagnostics market, while the child market includes life science research and clinical diagnostics.
Chemiluminescence Imaging Market Dynamics & Structure
The chemiluminescence imaging market is characterized by moderate concentration, with key players like LI-COR Biosciences, Analytik Jena, and Azure Biosystems holding significant market share. Technological innovation, driven by advancements in detector sensitivity and software analytics, is a major growth driver. Stringent regulatory frameworks, particularly in healthcare applications, influence market access and adoption. Competitive substitutes, such as fluorescence imaging, exert pressure, necessitating continuous innovation. The end-user base comprises academic research institutions, pharmaceutical companies, and clinical diagnostic laboratories. M&A activity in the past five years has been moderate, with approximately xx deals recorded, mostly focused on enhancing product portfolios and geographic reach.
- Market Concentration: Moderately concentrated, with top 5 players holding approximately xx% market share in 2025.
- Innovation Drivers: Improved detector sensitivity, advanced image analysis software, miniaturization of systems.
- Regulatory Framework: Stringent regulations in healthcare applications (e.g., FDA approvals) impact market entry and adoption.
- Competitive Substitutes: Fluorescence imaging and other detection technologies present competitive pressure.
- End-User Demographics: Primarily academic research, pharmaceutical R&D, and clinical diagnostics.
- M&A Trends: Moderate M&A activity, with xx deals recorded between 2020-2024, focused on expansion and technology acquisition.
Chemiluminescence Imaging Growth Trends & Insights
The chemiluminescence imaging market exhibited a CAGR of xx% during the historical period (2019-2024), driven by increasing adoption in life science research and clinical diagnostics. Market size is expected to grow at a CAGR of xx% from 2025 to 2033, reaching xx million USD by 2033. Technological disruptions, such as the integration of AI-powered image analysis, are accelerating adoption rates and enhancing workflow efficiency. Consumer behavior shifts towards high-throughput screening and automation are fueling demand for advanced chemiluminescence imaging systems. Market penetration in emerging economies is expected to increase significantly, contributing to overall market growth.
Dominant Regions, Countries, or Segments in Chemiluminescence Imaging
North America holds the dominant position in the chemiluminescence imaging market, owing to strong research infrastructure, high adoption rates in pharmaceutical and biotechnology sectors, and favorable regulatory environment. Europe follows as a significant market, driven by robust research funding and advanced healthcare infrastructure. Asia-Pacific is anticipated to exhibit the fastest growth rate due to increasing investments in healthcare and life science research.
- Key Drivers in North America: Strong R&D investments, high adoption in pharmaceutical & biotech, favorable regulatory landscape.
- Key Drivers in Europe: Significant research funding, advanced healthcare infrastructure, increasing focus on personalized medicine.
- Key Drivers in Asia-Pacific: Rising healthcare spending, increasing research activities, growing awareness of advanced diagnostic technologies.
- Market Share: North America (xx%), Europe (xx%), Asia-Pacific (xx%), Rest of World (xx%) in 2025.
Chemiluminescence Imaging Product Landscape
Chemiluminescence imaging systems are characterized by diverse functionalities, encompassing high sensitivity, quantitative image analysis, and versatile applications. Recent product innovations include enhanced dynamic range, improved resolution, and integrated software solutions for automated data analysis. Unique selling propositions include user-friendly interfaces, rapid imaging capabilities, and compatibility with various sample types. Technological advancements focus on improved light detection efficiency, reducing background noise, and enhancing image quality.
Key Drivers, Barriers & Challenges in Chemiluminescence Imaging
Key Drivers: Increasing demand from life science research, growing adoption in clinical diagnostics, advancements in detector technology, and integration with automation platforms. For example, the development of high-sensitivity cameras has significantly improved the detection limit of chemiluminescence.
Key Challenges & Restraints: High initial investment costs, complex system operation, and the presence of alternative imaging techniques limit market growth. Regulatory hurdles and variations in healthcare reimbursement policies across different regions pose significant challenges. Supply chain disruptions, particularly concerning specialized components, may impact availability and pricing. These factors are estimated to negatively impact the market by approximately xx% by 2030.
Emerging Opportunities in Chemiluminescence Imaging
Untapped markets in developing countries, along with the increasing application of chemiluminescence imaging in new areas like point-of-care diagnostics, represent significant growth opportunities. The development of portable and cost-effective systems specifically targeted for use in resource-limited settings holds considerable potential. Evolving consumer preferences towards user-friendly, automated, and data-rich systems will continue to shape market trends.
Growth Accelerators in the Chemiluminescence Imaging Industry
Technological breakthroughs, particularly in detector technology and image analysis software, are driving significant growth. Strategic partnerships between imaging equipment manufacturers and life science companies are accelerating market penetration. Expansion strategies, including targeted marketing efforts and the development of tailored solutions for specific applications, will further drive market growth.
Key Players Shaping the Chemiluminescence Imaging Market
- LI-COR Biosciences
- Analytik Jena
- Azure Biosystems
- Berthold Technologies
- Bio-Rad Laboratories
- Cleaver Scientific
- Next Advance
- Syngene (SDI Group)
- GE Healthcare
- Vilber Smart Imaging
- Thermo Fisher Scientific
- PerkinElmer
- ANALIS
- DiaSorin
- Pop-Bio
- UVITEC
Notable Milestones in Chemiluminescence Imaging Sector
- 2021-Q3: LI-COR Biosciences launched a new generation of its Odyssey imaging system with enhanced sensitivity.
- 2022-Q1: Analytik Jena acquired a smaller chemiluminescence imaging company, expanding its product portfolio.
- 2023-Q2: Azure Biosystems released upgraded software with improved image analysis capabilities. (Further milestones will be added based on market developments)
In-Depth Chemiluminescence Imaging Market Outlook
The chemiluminescence imaging market is poised for sustained growth driven by continued technological advancements, increased adoption in emerging markets, and the expansion into new applications. Strategic opportunities exist for companies that can develop innovative, cost-effective systems and provide comprehensive support and service. The market's future potential hinges on overcoming challenges related to cost, accessibility, and regulatory hurdles. Significant growth is anticipated in the clinical diagnostics sector, specifically in high-throughput screening and personalized medicine.
Chemiluminescence Imaging Segmentation
-
1. Application
- 1.1. Proteomics
- 1.2. Genomics
- 1.3. Other
-
2. Types
- 2.1. Chemical for Chemiluminescence
- 2.2. Biochemical for Bioluminescence
- 2.3. Electromagnetic as Electroluminescence
- 2.4. Photons as Photoluminescence
Chemiluminescence Imaging Segmentation By Geography
-
1. North America
- 1.1. United States
- 1.2. Canada
- 1.3. Mexico
-
2. South America
- 2.1. Brazil
- 2.2. Argentina
- 2.3. Rest of South America
-
3. Europe
- 3.1. United Kingdom
- 3.2. Germany
- 3.3. France
- 3.4. Italy
- 3.5. Spain
- 3.6. Russia
- 3.7. Benelux
- 3.8. Nordics
- 3.9. Rest of Europe
-
4. Middle East & Africa
- 4.1. Turkey
- 4.2. Israel
- 4.3. GCC
- 4.4. North Africa
- 4.5. South Africa
- 4.6. Rest of Middle East & Africa
-
5. Asia Pacific
- 5.1. China
- 5.2. India
- 5.3. Japan
- 5.4. South Korea
- 5.5. ASEAN
- 5.6. Oceania
- 5.7. Rest of Asia Pacific
Chemiluminescence Imaging Regional Market Share
Geographic Coverage of Chemiluminescence Imaging
Chemiluminescence Imaging REPORT HIGHLIGHTS
| Aspects | Details |
|---|---|
| Study Period | 2020-2034 |
| Base Year | 2025 |
| Estimated Year | 2026 |
| Forecast Period | 2026-2034 |
| Historical Period | 2020-2025 |
| Growth Rate | CAGR of 9% from 2020-2034 |
| Segmentation |
|
Table of Contents
- 1. Introduction
- 1.1. Research Scope
- 1.2. Market Segmentation
- 1.3. Research Objective
- 1.4. Definitions and Assumptions
- 2. Executive Summary
- 2.1. Market Snapshot
- 3. Market Dynamics
- 3.1. Market Drivers
- 3.2. Market Restrains
- 3.3. Market Trends
- 3.4. Market Opportunities
- 4. Market Factor Analysis
- 4.1. Porters Five Forces
- 4.1.1. Bargaining Power of Suppliers
- 4.1.2. Bargaining Power of Buyers
- 4.1.3. Threat of New Entrants
- 4.1.4. Threat of Substitutes
- 4.1.5. Competitive Rivalry
- 4.2. PESTEL analysis
- 4.3. BCG Analysis
- 4.3.1. Stars (High Growth, High Market Share)
- 4.3.2. Cash Cows (Low Growth, High Market Share)
- 4.3.3. Question Mark (High Growth, Low Market Share)
- 4.3.4. Dogs (Low Growth, Low Market Share)
- 4.4. Ansoff Matrix Analysis
- 4.5. Supply Chain Analysis
- 4.6. Regulatory Landscape
- 4.7. Current Market Potential and Opportunity Assessment (TAM–SAM–SOM Framework)
- 4.8. VDR Analyst Note
- 4.1. Porters Five Forces
- 5. Market Analysis, Insights and Forecast 2021-2033
- 5.1. Market Analysis, Insights and Forecast - by Application
- 5.1.1. Proteomics
- 5.1.2. Genomics
- 5.1.3. Other
- 5.2. Market Analysis, Insights and Forecast - by Types
- 5.2.1. Chemical for Chemiluminescence
- 5.2.2. Biochemical for Bioluminescence
- 5.2.3. Electromagnetic as Electroluminescence
- 5.2.4. Photons as Photoluminescence
- 5.3. Market Analysis, Insights and Forecast - by Region
- 5.3.1. North America
- 5.3.2. South America
- 5.3.3. Europe
- 5.3.4. Middle East & Africa
- 5.3.5. Asia Pacific
- 5.1. Market Analysis, Insights and Forecast - by Application
- 6. Global Chemiluminescence Imaging Analysis, Insights and Forecast, 2021-2033
- 6.1. Market Analysis, Insights and Forecast - by Application
- 6.1.1. Proteomics
- 6.1.2. Genomics
- 6.1.3. Other
- 6.2. Market Analysis, Insights and Forecast - by Types
- 6.2.1. Chemical for Chemiluminescence
- 6.2.2. Biochemical for Bioluminescence
- 6.2.3. Electromagnetic as Electroluminescence
- 6.2.4. Photons as Photoluminescence
- 6.1. Market Analysis, Insights and Forecast - by Application
- 7. North America Chemiluminescence Imaging Analysis, Insights and Forecast, 2021-2033
- 7.1. Market Analysis, Insights and Forecast - by Application
- 7.1.1. Proteomics
- 7.1.2. Genomics
- 7.1.3. Other
- 7.2. Market Analysis, Insights and Forecast - by Types
- 7.2.1. Chemical for Chemiluminescence
- 7.2.2. Biochemical for Bioluminescence
- 7.2.3. Electromagnetic as Electroluminescence
- 7.2.4. Photons as Photoluminescence
- 7.1. Market Analysis, Insights and Forecast - by Application
- 8. South America Chemiluminescence Imaging Analysis, Insights and Forecast, 2021-2033
- 8.1. Market Analysis, Insights and Forecast - by Application
- 8.1.1. Proteomics
- 8.1.2. Genomics
- 8.1.3. Other
- 8.2. Market Analysis, Insights and Forecast - by Types
- 8.2.1. Chemical for Chemiluminescence
- 8.2.2. Biochemical for Bioluminescence
- 8.2.3. Electromagnetic as Electroluminescence
- 8.2.4. Photons as Photoluminescence
- 8.1. Market Analysis, Insights and Forecast - by Application
- 9. Europe Chemiluminescence Imaging Analysis, Insights and Forecast, 2021-2033
- 9.1. Market Analysis, Insights and Forecast - by Application
- 9.1.1. Proteomics
- 9.1.2. Genomics
- 9.1.3. Other
- 9.2. Market Analysis, Insights and Forecast - by Types
- 9.2.1. Chemical for Chemiluminescence
- 9.2.2. Biochemical for Bioluminescence
- 9.2.3. Electromagnetic as Electroluminescence
- 9.2.4. Photons as Photoluminescence
- 9.1. Market Analysis, Insights and Forecast - by Application
- 10. Middle East & Africa Chemiluminescence Imaging Analysis, Insights and Forecast, 2021-2033
- 10.1. Market Analysis, Insights and Forecast - by Application
- 10.1.1. Proteomics
- 10.1.2. Genomics
- 10.1.3. Other
- 10.2. Market Analysis, Insights and Forecast - by Types
- 10.2.1. Chemical for Chemiluminescence
- 10.2.2. Biochemical for Bioluminescence
- 10.2.3. Electromagnetic as Electroluminescence
- 10.2.4. Photons as Photoluminescence
- 10.1. Market Analysis, Insights and Forecast - by Application
- 11. Asia Pacific Chemiluminescence Imaging Analysis, Insights and Forecast, 2021-2033
- 11.1. Market Analysis, Insights and Forecast - by Application
- 11.1.1. Proteomics
- 11.1.2. Genomics
- 11.1.3. Other
- 11.2. Market Analysis, Insights and Forecast - by Types
- 11.2.1. Chemical for Chemiluminescence
- 11.2.2. Biochemical for Bioluminescence
- 11.2.3. Electromagnetic as Electroluminescence
- 11.2.4. Photons as Photoluminescence
- 11.1. Market Analysis, Insights and Forecast - by Application
- 12. Competitive Analysis
- 12.1. Company Profiles
- 12.1.1 LI-COR Biosciences
- 12.1.1.1. Company Overview
- 12.1.1.2. Products
- 12.1.1.3. Company Financials
- 12.1.1.4. SWOT Analysis
- 12.1.2 Analytik Jena
- 12.1.2.1. Company Overview
- 12.1.2.2. Products
- 12.1.2.3. Company Financials
- 12.1.2.4. SWOT Analysis
- 12.1.3 Azure Biosystems
- 12.1.3.1. Company Overview
- 12.1.3.2. Products
- 12.1.3.3. Company Financials
- 12.1.3.4. SWOT Analysis
- 12.1.4 Berthold Technologies
- 12.1.4.1. Company Overview
- 12.1.4.2. Products
- 12.1.4.3. Company Financials
- 12.1.4.4. SWOT Analysis
- 12.1.5 Bio-Rad Laboratories
- 12.1.5.1. Company Overview
- 12.1.5.2. Products
- 12.1.5.3. Company Financials
- 12.1.5.4. SWOT Analysis
- 12.1.6 Cleaver Scientific
- 12.1.6.1. Company Overview
- 12.1.6.2. Products
- 12.1.6.3. Company Financials
- 12.1.6.4. SWOT Analysis
- 12.1.7 Next Advance
- 12.1.7.1. Company Overview
- 12.1.7.2. Products
- 12.1.7.3. Company Financials
- 12.1.7.4. SWOT Analysis
- 12.1.8 Syngene (SDI Group)
- 12.1.8.1. Company Overview
- 12.1.8.2. Products
- 12.1.8.3. Company Financials
- 12.1.8.4. SWOT Analysis
- 12.1.9 GE Healthcare
- 12.1.9.1. Company Overview
- 12.1.9.2. Products
- 12.1.9.3. Company Financials
- 12.1.9.4. SWOT Analysis
- 12.1.10 Vilber Smart Imaging
- 12.1.10.1. Company Overview
- 12.1.10.2. Products
- 12.1.10.3. Company Financials
- 12.1.10.4. SWOT Analysis
- 12.1.11 Thermo Fisher Scientific
- 12.1.11.1. Company Overview
- 12.1.11.2. Products
- 12.1.11.3. Company Financials
- 12.1.11.4. SWOT Analysis
- 12.1.12 PerkinElmer
- 12.1.12.1. Company Overview
- 12.1.12.2. Products
- 12.1.12.3. Company Financials
- 12.1.12.4. SWOT Analysis
- 12.1.13 ANALIS
- 12.1.13.1. Company Overview
- 12.1.13.2. Products
- 12.1.13.3. Company Financials
- 12.1.13.4. SWOT Analysis
- 12.1.14 DiaSorin
- 12.1.14.1. Company Overview
- 12.1.14.2. Products
- 12.1.14.3. Company Financials
- 12.1.14.4. SWOT Analysis
- 12.1.15 Pop-Bio
- 12.1.15.1. Company Overview
- 12.1.15.2. Products
- 12.1.15.3. Company Financials
- 12.1.15.4. SWOT Analysis
- 12.1.16 UVITEC
- 12.1.16.1. Company Overview
- 12.1.16.2. Products
- 12.1.16.3. Company Financials
- 12.1.16.4. SWOT Analysis
- 12.1.1 LI-COR Biosciences
- 12.2. Market Entropy
- 12.2.1 Company's Key Areas Served
- 12.2.2 Recent Developments
- 12.3. Company Market Share Analysis 2025
- 12.3.1 Top 5 Companies Market Share Analysis
- 12.3.2 Top 3 Companies Market Share Analysis
- 12.4. List of Potential Customers
- 13. Research Methodology
List of Figures
- Figure 1: Global Chemiluminescence Imaging Revenue Breakdown (undefined, %) by Region 2025 & 2033
- Figure 2: North America Chemiluminescence Imaging Revenue (undefined), by Application 2025 & 2033
- Figure 3: North America Chemiluminescence Imaging Revenue Share (%), by Application 2025 & 2033
- Figure 4: North America Chemiluminescence Imaging Revenue (undefined), by Types 2025 & 2033
- Figure 5: North America Chemiluminescence Imaging Revenue Share (%), by Types 2025 & 2033
- Figure 6: North America Chemiluminescence Imaging Revenue (undefined), by Country 2025 & 2033
- Figure 7: North America Chemiluminescence Imaging Revenue Share (%), by Country 2025 & 2033
- Figure 8: South America Chemiluminescence Imaging Revenue (undefined), by Application 2025 & 2033
- Figure 9: South America Chemiluminescence Imaging Revenue Share (%), by Application 2025 & 2033
- Figure 10: South America Chemiluminescence Imaging Revenue (undefined), by Types 2025 & 2033
- Figure 11: South America Chemiluminescence Imaging Revenue Share (%), by Types 2025 & 2033
- Figure 12: South America Chemiluminescence Imaging Revenue (undefined), by Country 2025 & 2033
- Figure 13: South America Chemiluminescence Imaging Revenue Share (%), by Country 2025 & 2033
- Figure 14: Europe Chemiluminescence Imaging Revenue (undefined), by Application 2025 & 2033
- Figure 15: Europe Chemiluminescence Imaging Revenue Share (%), by Application 2025 & 2033
- Figure 16: Europe Chemiluminescence Imaging Revenue (undefined), by Types 2025 & 2033
- Figure 17: Europe Chemiluminescence Imaging Revenue Share (%), by Types 2025 & 2033
- Figure 18: Europe Chemiluminescence Imaging Revenue (undefined), by Country 2025 & 2033
- Figure 19: Europe Chemiluminescence Imaging Revenue Share (%), by Country 2025 & 2033
- Figure 20: Middle East & Africa Chemiluminescence Imaging Revenue (undefined), by Application 2025 & 2033
- Figure 21: Middle East & Africa Chemiluminescence Imaging Revenue Share (%), by Application 2025 & 2033
- Figure 22: Middle East & Africa Chemiluminescence Imaging Revenue (undefined), by Types 2025 & 2033
- Figure 23: Middle East & Africa Chemiluminescence Imaging Revenue Share (%), by Types 2025 & 2033
- Figure 24: Middle East & Africa Chemiluminescence Imaging Revenue (undefined), by Country 2025 & 2033
- Figure 25: Middle East & Africa Chemiluminescence Imaging Revenue Share (%), by Country 2025 & 2033
- Figure 26: Asia Pacific Chemiluminescence Imaging Revenue (undefined), by Application 2025 & 2033
- Figure 27: Asia Pacific Chemiluminescence Imaging Revenue Share (%), by Application 2025 & 2033
- Figure 28: Asia Pacific Chemiluminescence Imaging Revenue (undefined), by Types 2025 & 2033
- Figure 29: Asia Pacific Chemiluminescence Imaging Revenue Share (%), by Types 2025 & 2033
- Figure 30: Asia Pacific Chemiluminescence Imaging Revenue (undefined), by Country 2025 & 2033
- Figure 31: Asia Pacific Chemiluminescence Imaging Revenue Share (%), by Country 2025 & 2033
List of Tables
- Table 1: Global Chemiluminescence Imaging Revenue undefined Forecast, by Application 2020 & 2033
- Table 2: Global Chemiluminescence Imaging Revenue undefined Forecast, by Types 2020 & 2033
- Table 3: Global Chemiluminescence Imaging Revenue undefined Forecast, by Region 2020 & 2033
- Table 4: Global Chemiluminescence Imaging Revenue undefined Forecast, by Application 2020 & 2033
- Table 5: Global Chemiluminescence Imaging Revenue undefined Forecast, by Types 2020 & 2033
- Table 6: Global Chemiluminescence Imaging Revenue undefined Forecast, by Country 2020 & 2033
- Table 7: United States Chemiluminescence Imaging Revenue (undefined) Forecast, by Application 2020 & 2033
- Table 8: Canada Chemiluminescence Imaging Revenue (undefined) Forecast, by Application 2020 & 2033
- Table 9: Mexico Chemiluminescence Imaging Revenue (undefined) Forecast, by Application 2020 & 2033
- Table 10: Global Chemiluminescence Imaging Revenue undefined Forecast, by Application 2020 & 2033
- Table 11: Global Chemiluminescence Imaging Revenue undefined Forecast, by Types 2020 & 2033
- Table 12: Global Chemiluminescence Imaging Revenue undefined Forecast, by Country 2020 & 2033
- Table 13: Brazil Chemiluminescence Imaging Revenue (undefined) Forecast, by Application 2020 & 2033
- Table 14: Argentina Chemiluminescence Imaging Revenue (undefined) Forecast, by Application 2020 & 2033
- Table 15: Rest of South America Chemiluminescence Imaging Revenue (undefined) Forecast, by Application 2020 & 2033
- Table 16: Global Chemiluminescence Imaging Revenue undefined Forecast, by Application 2020 & 2033
- Table 17: Global Chemiluminescence Imaging Revenue undefined Forecast, by Types 2020 & 2033
- Table 18: Global Chemiluminescence Imaging Revenue undefined Forecast, by Country 2020 & 2033
- Table 19: United Kingdom Chemiluminescence Imaging Revenue (undefined) Forecast, by Application 2020 & 2033
- Table 20: Germany Chemiluminescence Imaging Revenue (undefined) Forecast, by Application 2020 & 2033
- Table 21: France Chemiluminescence Imaging Revenue (undefined) Forecast, by Application 2020 & 2033
- Table 22: Italy Chemiluminescence Imaging Revenue (undefined) Forecast, by Application 2020 & 2033
- Table 23: Spain Chemiluminescence Imaging Revenue (undefined) Forecast, by Application 2020 & 2033
- Table 24: Russia Chemiluminescence Imaging Revenue (undefined) Forecast, by Application 2020 & 2033
- Table 25: Benelux Chemiluminescence Imaging Revenue (undefined) Forecast, by Application 2020 & 2033
- Table 26: Nordics Chemiluminescence Imaging Revenue (undefined) Forecast, by Application 2020 & 2033
- Table 27: Rest of Europe Chemiluminescence Imaging Revenue (undefined) Forecast, by Application 2020 & 2033
- Table 28: Global Chemiluminescence Imaging Revenue undefined Forecast, by Application 2020 & 2033
- Table 29: Global Chemiluminescence Imaging Revenue undefined Forecast, by Types 2020 & 2033
- Table 30: Global Chemiluminescence Imaging Revenue undefined Forecast, by Country 2020 & 2033
- Table 31: Turkey Chemiluminescence Imaging Revenue (undefined) Forecast, by Application 2020 & 2033
- Table 32: Israel Chemiluminescence Imaging Revenue (undefined) Forecast, by Application 2020 & 2033
- Table 33: GCC Chemiluminescence Imaging Revenue (undefined) Forecast, by Application 2020 & 2033
- Table 34: North Africa Chemiluminescence Imaging Revenue (undefined) Forecast, by Application 2020 & 2033
- Table 35: South Africa Chemiluminescence Imaging Revenue (undefined) Forecast, by Application 2020 & 2033
- Table 36: Rest of Middle East & Africa Chemiluminescence Imaging Revenue (undefined) Forecast, by Application 2020 & 2033
- Table 37: Global Chemiluminescence Imaging Revenue undefined Forecast, by Application 2020 & 2033
- Table 38: Global Chemiluminescence Imaging Revenue undefined Forecast, by Types 2020 & 2033
- Table 39: Global Chemiluminescence Imaging Revenue undefined Forecast, by Country 2020 & 2033
- Table 40: China Chemiluminescence Imaging Revenue (undefined) Forecast, by Application 2020 & 2033
- Table 41: India Chemiluminescence Imaging Revenue (undefined) Forecast, by Application 2020 & 2033
- Table 42: Japan Chemiluminescence Imaging Revenue (undefined) Forecast, by Application 2020 & 2033
- Table 43: South Korea Chemiluminescence Imaging Revenue (undefined) Forecast, by Application 2020 & 2033
- Table 44: ASEAN Chemiluminescence Imaging Revenue (undefined) Forecast, by Application 2020 & 2033
- Table 45: Oceania Chemiluminescence Imaging Revenue (undefined) Forecast, by Application 2020 & 2033
- Table 46: Rest of Asia Pacific Chemiluminescence Imaging Revenue (undefined) Forecast, by Application 2020 & 2033
Frequently Asked Questions
1. What is the projected Compound Annual Growth Rate (CAGR) of the Chemiluminescence Imaging?
The projected CAGR is approximately 9%.
2. Which companies are prominent players in the Chemiluminescence Imaging?
Key companies in the market include LI-COR Biosciences, Analytik Jena, Azure Biosystems, Berthold Technologies, Bio-Rad Laboratories, Cleaver Scientific, Next Advance, Syngene (SDI Group), GE Healthcare, Vilber Smart Imaging, Thermo Fisher Scientific, PerkinElmer, ANALIS, DiaSorin, Pop-Bio, UVITEC.
3. What are the main segments of the Chemiluminescence Imaging?
The market segments include Application, Types.
4. Can you provide details about the market size?
The market size is estimated to be USD XXX N/A as of 2022.
5. What are some drivers contributing to market growth?
N/A
6. What are the notable trends driving market growth?
N/A
7. Are there any restraints impacting market growth?
N/A
8. Can you provide examples of recent developments in the market?
N/A
9. What pricing options are available for accessing the report?
Pricing options include single-user, multi-user, and enterprise licenses priced at USD 3950.00, USD 5925.00, and USD 7900.00 respectively.
10. Is the market size provided in terms of value or volume?
The market size is provided in terms of value, measured in N/A.
11. Are there any specific market keywords associated with the report?
Yes, the market keyword associated with the report is "Chemiluminescence Imaging," which aids in identifying and referencing the specific market segment covered.
12. How do I determine which pricing option suits my needs best?
The pricing options vary based on user requirements and access needs. Individual users may opt for single-user licenses, while businesses requiring broader access may choose multi-user or enterprise licenses for cost-effective access to the report.
13. Are there any additional resources or data provided in the Chemiluminescence Imaging report?
While the report offers comprehensive insights, it's advisable to review the specific contents or supplementary materials provided to ascertain if additional resources or data are available.
14. How can I stay updated on further developments or reports in the Chemiluminescence Imaging?
To stay informed about further developments, trends, and reports in the Chemiluminescence Imaging, consider subscribing to industry newsletters, following relevant companies and organizations, or regularly checking reputable industry news sources and publications.
Methodology
Step 1 - Identification of Relevant Samples Size from Population Database


Step 2 - Approaches for Defining Global Market Size (Value, Volume* & Price*)

Note*: In applicable scenarios
Step 3 - Data Sources
Primary Research
- Web Analytics
- Survey Reports
- Research Institute
- Latest Research Reports
- Opinion Leaders
Secondary Research
- Annual Reports
- White Paper
- Latest Press Release
- Industry Association
- Paid Database
- Investor Presentations

Step 4 - Data Triangulation
Involves using different sources of information in order to increase the validity of a study
These sources are likely to be stakeholders in a program - participants, other researchers, program staff, other community members, and so on.
Then we put all data in single framework & apply various statistical tools to find out the dynamic on the market.
During the analysis stage, feedback from the stakeholder groups would be compared to determine areas of agreement as well as areas of divergence