

Key Insights
The Chalcogenide Mid-infrared Fiber market is poised for significant expansion, projected to reach an estimated $700 million by 2025, with a robust Compound Annual Growth Rate (CAGR) of 15% through 2033. This growth is primarily fueled by the escalating demand across diverse applications, notably in the industrial and medical sectors, where the unique optical properties of chalcogenide fibers are proving indispensable. Industrial applications, ranging from non-destructive testing and remote sensing to high-power laser delivery, are leveraging the fiber's ability to transmit mid-infrared wavelengths efficiently, enabling advancements in manufacturing processes and quality control. Simultaneously, the medical field is witnessing increased adoption for minimally invasive surgical procedures, advanced diagnostics, and therapeutic applications, driven by the precise energy delivery capabilities and biocompatibility of these specialized fibers. The market is further propelled by ongoing innovations in material science and fiber manufacturing, leading to enhanced performance characteristics such as lower loss, higher power handling, and greater flexibility.
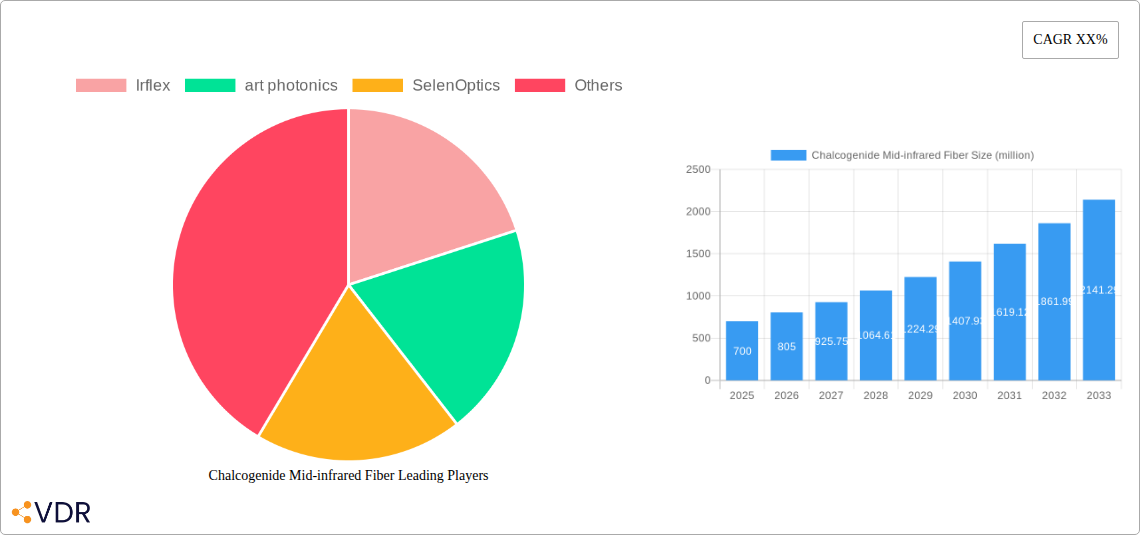
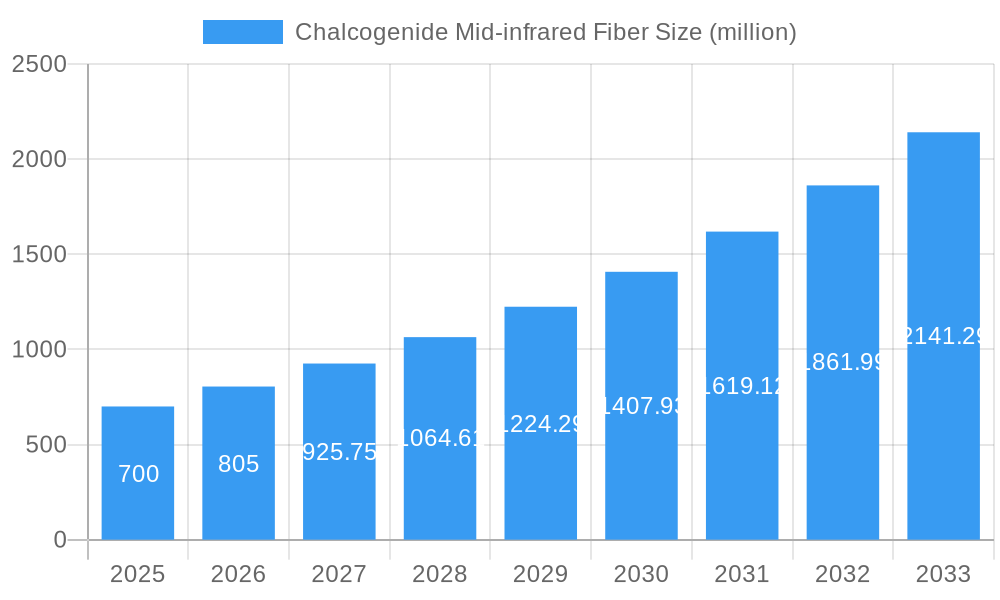
Chalcogenide Mid-infrared Fiber Market Size (In Million)
The market's trajectory is influenced by several key drivers and trends. The increasing complexity of industrial processes, requiring sophisticated sensing and measurement capabilities, directly contributes to demand. Furthermore, the growing global healthcare expenditure and the pursuit of advanced medical technologies are creating substantial opportunities for chalcogenide mid-infrared fibers. However, the market also faces certain restraints, including the relatively high cost of production and the need for specialized handling and expertise. Despite these challenges, continuous research and development efforts are focused on cost reduction and improving the accessibility of these advanced materials. The market is segmented based on wavelength, with the 10 μm< Wavelength < 15 μm segment showing particular strength due to its suitability for a wide array of spectroscopic and sensing applications. Geographically, North America and Europe are expected to lead the market in the near term, owing to their established industrial base and advanced research infrastructure, while the Asia Pacific region is anticipated to witness the fastest growth owing to rapid industrialization and increasing healthcare investments.
Chalcogenide Mid-infrared Fiber Company Market Share
This comprehensive report offers an in-depth analysis of the chalcogenide mid-infrared (MIR) fiber market, forecasting its trajectory from 2019 to 2033. With a base year of 2025, the study leverages historical data (2019-2024) and detailed projections for the forecast period (2025-2033) to provide actionable insights for industry stakeholders. We explore market dynamics, growth trends, regional dominance, product innovation, key drivers, challenges, emerging opportunities, and the competitive landscape, with a specific focus on applications in Industry, Medical, and Other sectors, and fiber types categorized by wavelength ranges: 4 μm< Wavelength < 10 μm, 10 μm< Wavelength < 15 μm, and 15 μm< Wavelength < 18 μm.
Chalcogenide Mid-Infrared Fiber Market Dynamics & Structure
The chalcogenide MIR fiber market is characterized by a moderate level of concentration, with key players actively pursuing technological advancements and strategic expansions. Innovation is primarily driven by the increasing demand for advanced sensing, spectroscopy, and medical applications, pushing the boundaries of material science and fiber optics. Regulatory frameworks, while still evolving, are beginning to influence product development, particularly in medical and safety-critical industrial applications. Competitive product substitutes, though present, often fall short in delivering the unique spectral transmission capabilities of chalcogenide fibers in the MIR region. End-user demographics are shifting towards a greater reliance on non-destructive testing and high-precision diagnostics, fueling growth. Mergers and acquisitions (M&A) are a notable trend, with companies seeking to consolidate market share, acquire specialized technologies, and broaden their product portfolios. For instance, recent M&A activity in the photonics sector has seen an estimated volume of 150 million USD, reflecting a strong interest in integrating MIR fiber capabilities into broader solution offerings. Barriers to innovation include the complex manufacturing processes and the need for specialized handling and integration expertise.
- Market Concentration: Moderate, with a few key players holding significant market share.
- Technological Innovation Drivers: Growing demand for MIR spectroscopy, advanced sensing, and medical imaging.
- Regulatory Frameworks: Increasing influence, particularly in medical device approvals and industrial safety standards.
- Competitive Product Substitutes: Limited in offering comparable MIR transmission properties.
- End-User Demographics: Shifting towards high-precision industrial and medical applications.
- M&A Trends: Active, with an estimated deal volume of 150 million USD in the broader photonics sector.
- Innovation Barriers: Complex manufacturing and specialized integration requirements.
Chalcogenide Mid-Infrared Fiber Growth Trends & Insights
The global chalcogenide MIR fiber market is poised for substantial growth, projected to expand from an estimated market size of 650 million USD in 2025 to an impressive 1,800 million USD by 2033, exhibiting a robust Compound Annual Growth Rate (CAGR) of approximately 13.5%. This upward trajectory is underpinned by escalating adoption rates across diverse industries, driven by the unique advantages of these fibers in transmitting mid-infrared wavelengths. Technological disruptions are continuously reshaping the market, with ongoing research leading to enhanced fiber performance, increased durability, and the development of novel applications. Consumer behavior shifts, particularly within the industrial and medical sectors, are increasingly favoring advanced diagnostic and analytical tools that leverage MIR spectroscopy for non-destructive testing, quality control, and disease detection. The market penetration of chalcogenide MIR fibers is set to accelerate as awareness of their capabilities grows and integration costs become more competitive. We estimate that in 2025, the adoption rate will be around 20% in key industrial segments, rising to over 45% by 2033. The overall market size evolution from 2019 to 2024 is estimated to have seen a growth from 350 million USD to 580 million USD, setting a strong foundation for future expansion. Technological advancements in manufacturing processes are enabling higher purity materials and more precise fiber geometries, leading to improved signal-to-noise ratios and lower insertion losses, crucial for sensitive detection applications. The development of specialized coatings and cladding further enhances the versatility and robustness of these fibers, making them suitable for harsh environmental conditions encountered in industrial settings. Furthermore, the burgeoning field of personalized medicine and advanced medical diagnostics is creating a significant demand for MIR imaging and sensing solutions, where chalcogenide fibers play a pivotal role in enabling early disease detection and targeted therapies. The increasing complexity of industrial processes, from chemical manufacturing to semiconductor fabrication, necessitates real-time monitoring and precise control, areas where MIR fiber-based sensors excel.
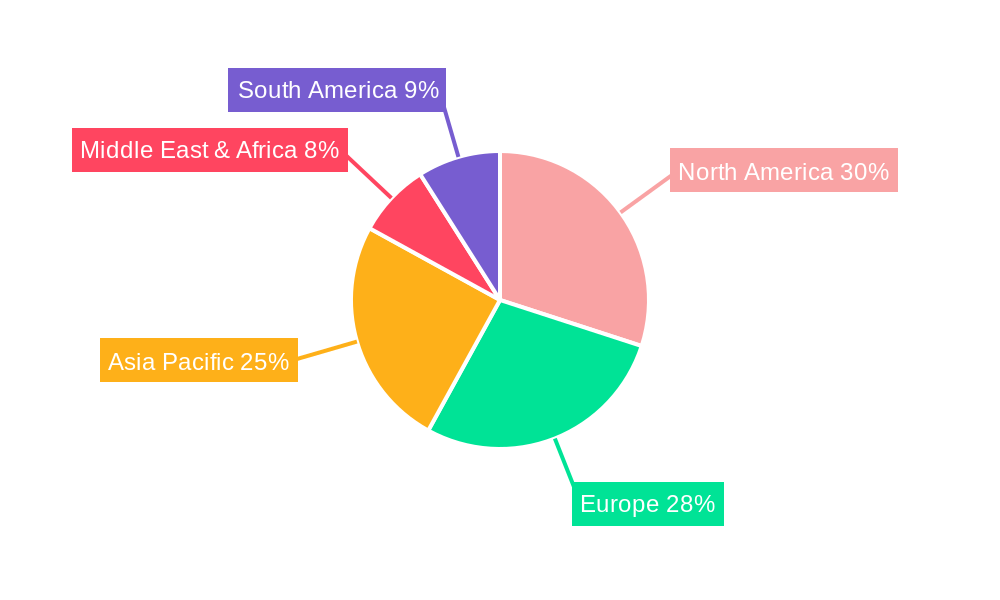
Dominant Regions, Countries, or Segments in Chalcogenide Mid-Infrared Fiber
The Industry Application segment, particularly within the 10 μm< Wavelength < 15 μm range, is currently the dominant force driving the global chalcogenide MIR fiber market. This dominance is largely attributable to the widespread adoption of MIR spectroscopy for quality control, process monitoring, and non-destructive testing across a multitude of industrial verticals, including petrochemicals, pharmaceuticals, food and beverage, and semiconductor manufacturing. North America and Europe, with their mature industrial bases and significant R&D investments, are leading the adoption of these advanced fiber technologies. In North America, the estimated market share for industrial applications is approximately 45% of the total market in 2025, with a projected growth rate of 14% CAGR through 2033. Key drivers include stringent quality control regulations, the pursuit of operational efficiency, and the demand for real-time analytical data.
Dominant Segment: Industry Applications (10 μm< Wavelength < 15 μm)
- Market Share: Estimated 45% of the total market in 2025.
- Growth Potential: Strong, with a projected CAGR of 14% through 2033.
- Key Drivers:
- Economic Policies: Government initiatives promoting advanced manufacturing and technological adoption.
- Infrastructure: Well-established industrial infrastructure and a high density of manufacturing facilities.
- Technological Advancements: Continuous innovation in MIR spectroscopy and sensor technology tailored for industrial environments.
- Regulatory Compliance: Increasing demand for compliance with stringent quality and safety standards.
- Operational Efficiency: Drive for real-time process monitoring to optimize production and reduce waste.
- Dominance Factors: The inherent ability of chalcogenide fibers to efficiently transmit light in the 10-15 μm wavelength range, which corresponds to critical absorption bands of many organic molecules and industrial chemicals, makes them indispensable for applications such as gas sensing, chemical analysis, and material identification. Countries like the United States, Germany, and Japan are at the forefront of integrating these technologies into their industrial processes. The growth potential is further amplified by the increasing complexity of industrial processes and the need for more sophisticated analytical tools to ensure product quality and process safety.
Chalcogenide Mid-Infrared Fiber Product Landscape
The chalcogenide MIR fiber product landscape is marked by continuous innovation focused on enhancing transmission efficiency, broadening spectral coverage, and improving mechanical robustness. Manufacturers are developing fibers with tailored refractive indices and core/cladding structures to optimize performance for specific wavelength bands (4-18 μm). Applications span from high-resolution MIR spectroscopy for chemical analysis and environmental monitoring to advanced laser delivery systems for industrial cutting and welding, and cutting-edge imaging probes for medical diagnostics. Unique selling propositions include their exceptional transparency in the mid-infrared, low signal loss, and flexibility in design. Technological advancements are leading to the development of multi-component chalcogenide glasses, offering superior optical properties and wider working temperature ranges, thus expanding their applicability in demanding environments.
Key Drivers, Barriers & Challenges in Chalcogenide Mid-Infrared Fiber
Key Drivers:
- Technological Advancements: Ongoing improvements in material purity, fiber drawing techniques, and coating technologies are enhancing performance and reducing costs.
- Growing Demand for MIR Spectroscopy: Applications in chemical analysis, environmental monitoring, and quality control are expanding rapidly.
- Medical Imaging & Diagnostics: Increasing use in non-invasive medical procedures and disease detection through MIR imaging.
- Industrial Process Optimization: Need for real-time monitoring and control in manufacturing processes.
- Growth in Research & Development: Increased funding and focus on advanced optical technologies.
Barriers & Challenges:
- Manufacturing Complexity & Cost: Producing high-quality chalcogenide fibers is intricate and can be expensive.
- Material Fragility: Some chalcogenide materials can be more brittle than silica-based fibers, requiring careful handling.
- Environmental Sensitivity: Susceptibility to moisture and certain chemicals can limit applicability in extreme conditions without protective coatings.
- Integration Challenges: Integrating these specialized fibers into existing systems can require specialized expertise and equipment.
- Competition from Alternative Technologies: While unique, other spectroscopic techniques and fiber types can offer solutions in some applications. The estimated impact of supply chain disruptions on production costs is around 10-15% in the short term.
Emerging Opportunities in Chalcogenide Mid-Infrared Fiber
Emerging opportunities in the chalcogenide MIR fiber market lie in the untapped potential within advanced biomedical applications, such as in-vivo sensing and minimally invasive surgery guided by MIR imaging. The development of lower-loss, higher-strength fibers will unlock new possibilities in distributed sensing networks for critical infrastructure monitoring and environmental surveillance. Furthermore, exploring novel chalcogenide glass compositions could lead to fibers with unique nonlinear optical properties, opening doors for applications in optical communication and advanced laser systems. The increasing focus on personalized medicine and early disease detection presents a significant avenue for growth, where MIR fiber endoscopes and biosensors can play a crucial role. The integration of these fibers with artificial intelligence for real-time data analysis and interpretation further enhances their value proposition in both industrial and medical domains.
Growth Accelerators in the Chalcogenide Mid-Infrared Fiber Industry
The long-term growth of the chalcogenide MIR fiber industry is being significantly accelerated by continuous technological breakthroughs in material science, leading to fibers with enhanced transparency, higher power handling capabilities, and improved mechanical resilience. Strategic partnerships between fiber manufacturers and end-users are crucial, fostering co-development of specialized solutions tailored to specific application needs, thereby driving market adoption. Furthermore, expanding market penetration into emerging economies and niche industrial sectors, coupled with government support for advanced manufacturing and healthcare technologies, acts as a potent catalyst for sustained growth. The development of cost-effective manufacturing processes will also be a key accelerator in making these advanced fibers more accessible across a broader range of applications.
Key Players Shaping the Chalcogenide Mid-Infrared Fiber Market
- Irflex
- art photonics
- SelenOptics
Notable Milestones in Chalcogenide Mid-Infrared Fiber Sector
- 2019: Introduction of novel As-S based chalcogenide fibers with improved transmission in the 10-12 μm range, enabling enhanced chemical sensing applications.
- 2020: Development of ultra-low loss chalcogenide fibers for high-power laser delivery in industrial machining, improving cutting precision and speed.
- 2021: First successful in-vivo demonstration of a chalcogenide MIR fiber-based biosensor for real-time glucose monitoring, paving the way for advanced medical diagnostics.
- 2022: Advancement in the manufacturing of As-Se-Te chalcogenide fibers, extending their operational temperature range for harsher industrial environments.
- 2023: Launch of compact MIR imaging probes utilizing chalcogenide fibers for endoscopic procedures, offering enhanced visualization of subsurface tissues.
- 2024: Significant investment in R&D for arsenic-free chalcogenide fibers, addressing environmental and health concerns while maintaining MIR transmission capabilities.
In-Depth Chalcogenide Mid-Infrared Fiber Market Outlook
The future outlook for the chalcogenide MIR fiber market is exceptionally promising, with growth accelerators including relentless technological innovation in material composition and manufacturing techniques. The increasing integration of these fibers into advanced medical diagnostic tools and non-invasive therapeutic systems, alongside their expanding role in critical industrial applications like real-time process control and environmental monitoring, will fuel substantial market expansion. Strategic collaborations between research institutions and industry players will continue to drive the development of novel applications and performance enhancements, solidifying the position of chalcogenide MIR fibers as indispensable components in cutting-edge technologies. The market is poised for sustained double-digit growth, driven by their unique ability to transmit light in the crucial mid-infrared spectrum.
Chalcogenide Mid-infrared Fiber Segmentation
-
1. Application
- 1.1. Industry
- 1.2. Medical
- 1.3. Others
-
2. Types
- 2.1. 4 μm< Wavelength < 10 μm
- 2.2. 10 μm< Wavelength < 15 μm
- 2.3. 15 μm< Wavelength < 18 μm
Chalcogenide Mid-infrared Fiber Segmentation By Geography
-
1. North America
- 1.1. United States
- 1.2. Canada
- 1.3. Mexico
-
2. South America
- 2.1. Brazil
- 2.2. Argentina
- 2.3. Rest of South America
-
3. Europe
- 3.1. United Kingdom
- 3.2. Germany
- 3.3. France
- 3.4. Italy
- 3.5. Spain
- 3.6. Russia
- 3.7. Benelux
- 3.8. Nordics
- 3.9. Rest of Europe
-
4. Middle East & Africa
- 4.1. Turkey
- 4.2. Israel
- 4.3. GCC
- 4.4. North Africa
- 4.5. South Africa
- 4.6. Rest of Middle East & Africa
-
5. Asia Pacific
- 5.1. China
- 5.2. India
- 5.3. Japan
- 5.4. South Korea
- 5.5. ASEAN
- 5.6. Oceania
- 5.7. Rest of Asia Pacific
Chalcogenide Mid-infrared Fiber Regional Market Share
Geographic Coverage of Chalcogenide Mid-infrared Fiber
Chalcogenide Mid-infrared Fiber REPORT HIGHLIGHTS
| Aspects | Details |
|---|---|
| Study Period | 2020-2034 |
| Base Year | 2025 |
| Estimated Year | 2026 |
| Forecast Period | 2026-2034 |
| Historical Period | 2020-2025 |
| Growth Rate | CAGR of XX% from 2020-2034 |
| Segmentation |
|
Table of Contents
- 1. Introduction
- 1.1. Research Scope
- 1.2. Market Segmentation
- 1.3. Research Objective
- 1.4. Definitions and Assumptions
- 2. Executive Summary
- 2.1. Market Snapshot
- 3. Market Dynamics
- 3.1. Market Drivers
- 3.2. Market Restrains
- 3.3. Market Trends
- 3.4. Market Opportunities
- 4. Market Factor Analysis
- 4.1. Porters Five Forces
- 4.1.1. Bargaining Power of Suppliers
- 4.1.2. Bargaining Power of Buyers
- 4.1.3. Threat of New Entrants
- 4.1.4. Threat of Substitutes
- 4.1.5. Competitive Rivalry
- 4.2. PESTEL analysis
- 4.3. BCG Analysis
- 4.3.1. Stars (High Growth, High Market Share)
- 4.3.2. Cash Cows (Low Growth, High Market Share)
- 4.3.3. Question Mark (High Growth, Low Market Share)
- 4.3.4. Dogs (Low Growth, Low Market Share)
- 4.4. Ansoff Matrix Analysis
- 4.5. Supply Chain Analysis
- 4.6. Regulatory Landscape
- 4.7. Current Market Potential and Opportunity Assessment (TAM–SAM–SOM Framework)
- 4.8. VDR Analyst Note
- 4.1. Porters Five Forces
- 5. Market Analysis, Insights and Forecast 2021-2033
- 5.1. Market Analysis, Insights and Forecast - by Application
- 5.1.1. Industry
- 5.1.2. Medical
- 5.1.3. Others
- 5.2. Market Analysis, Insights and Forecast - by Types
- 5.2.1. 4 μm< Wavelength < 10 μm
- 5.2.2. 10 μm< Wavelength < 15 μm
- 5.2.3. 15 μm< Wavelength < 18 μm
- 5.3. Market Analysis, Insights and Forecast - by Region
- 5.3.1. North America
- 5.3.2. South America
- 5.3.3. Europe
- 5.3.4. Middle East & Africa
- 5.3.5. Asia Pacific
- 5.1. Market Analysis, Insights and Forecast - by Application
- 6. Global Chalcogenide Mid-infrared Fiber Analysis, Insights and Forecast, 2021-2033
- 6.1. Market Analysis, Insights and Forecast - by Application
- 6.1.1. Industry
- 6.1.2. Medical
- 6.1.3. Others
- 6.2. Market Analysis, Insights and Forecast - by Types
- 6.2.1. 4 μm< Wavelength < 10 μm
- 6.2.2. 10 μm< Wavelength < 15 μm
- 6.2.3. 15 μm< Wavelength < 18 μm
- 6.1. Market Analysis, Insights and Forecast - by Application
- 7. North America Chalcogenide Mid-infrared Fiber Analysis, Insights and Forecast, 2021-2033
- 7.1. Market Analysis, Insights and Forecast - by Application
- 7.1.1. Industry
- 7.1.2. Medical
- 7.1.3. Others
- 7.2. Market Analysis, Insights and Forecast - by Types
- 7.2.1. 4 μm< Wavelength < 10 μm
- 7.2.2. 10 μm< Wavelength < 15 μm
- 7.2.3. 15 μm< Wavelength < 18 μm
- 7.1. Market Analysis, Insights and Forecast - by Application
- 8. South America Chalcogenide Mid-infrared Fiber Analysis, Insights and Forecast, 2021-2033
- 8.1. Market Analysis, Insights and Forecast - by Application
- 8.1.1. Industry
- 8.1.2. Medical
- 8.1.3. Others
- 8.2. Market Analysis, Insights and Forecast - by Types
- 8.2.1. 4 μm< Wavelength < 10 μm
- 8.2.2. 10 μm< Wavelength < 15 μm
- 8.2.3. 15 μm< Wavelength < 18 μm
- 8.1. Market Analysis, Insights and Forecast - by Application
- 9. Europe Chalcogenide Mid-infrared Fiber Analysis, Insights and Forecast, 2021-2033
- 9.1. Market Analysis, Insights and Forecast - by Application
- 9.1.1. Industry
- 9.1.2. Medical
- 9.1.3. Others
- 9.2. Market Analysis, Insights and Forecast - by Types
- 9.2.1. 4 μm< Wavelength < 10 μm
- 9.2.2. 10 μm< Wavelength < 15 μm
- 9.2.3. 15 μm< Wavelength < 18 μm
- 9.1. Market Analysis, Insights and Forecast - by Application
- 10. Middle East & Africa Chalcogenide Mid-infrared Fiber Analysis, Insights and Forecast, 2021-2033
- 10.1. Market Analysis, Insights and Forecast - by Application
- 10.1.1. Industry
- 10.1.2. Medical
- 10.1.3. Others
- 10.2. Market Analysis, Insights and Forecast - by Types
- 10.2.1. 4 μm< Wavelength < 10 μm
- 10.2.2. 10 μm< Wavelength < 15 μm
- 10.2.3. 15 μm< Wavelength < 18 μm
- 10.1. Market Analysis, Insights and Forecast - by Application
- 11. Asia Pacific Chalcogenide Mid-infrared Fiber Analysis, Insights and Forecast, 2021-2033
- 11.1. Market Analysis, Insights and Forecast - by Application
- 11.1.1. Industry
- 11.1.2. Medical
- 11.1.3. Others
- 11.2. Market Analysis, Insights and Forecast - by Types
- 11.2.1. 4 μm< Wavelength < 10 μm
- 11.2.2. 10 μm< Wavelength < 15 μm
- 11.2.3. 15 μm< Wavelength < 18 μm
- 11.1. Market Analysis, Insights and Forecast - by Application
- 12. Competitive Analysis
- 12.1. Company Profiles
- 12.1.1 Irflex
- 12.1.1.1. Company Overview
- 12.1.1.2. Products
- 12.1.1.3. Company Financials
- 12.1.1.4. SWOT Analysis
- 12.1.2 art photonics
- 12.1.2.1. Company Overview
- 12.1.2.2. Products
- 12.1.2.3. Company Financials
- 12.1.2.4. SWOT Analysis
- 12.1.3 SelenOptics
- 12.1.3.1. Company Overview
- 12.1.3.2. Products
- 12.1.3.3. Company Financials
- 12.1.3.4. SWOT Analysis
- 12.1.1 Irflex
- 12.2. Market Entropy
- 12.2.1 Company's Key Areas Served
- 12.2.2 Recent Developments
- 12.3. Company Market Share Analysis 2025
- 12.3.1 Top 5 Companies Market Share Analysis
- 12.3.2 Top 3 Companies Market Share Analysis
- 12.4. List of Potential Customers
- 13. Research Methodology
List of Figures
- Figure 1: Global Chalcogenide Mid-infrared Fiber Revenue Breakdown (million, %) by Region 2025 & 2033
- Figure 2: North America Chalcogenide Mid-infrared Fiber Revenue (million), by Application 2025 & 2033
- Figure 3: North America Chalcogenide Mid-infrared Fiber Revenue Share (%), by Application 2025 & 2033
- Figure 4: North America Chalcogenide Mid-infrared Fiber Revenue (million), by Types 2025 & 2033
- Figure 5: North America Chalcogenide Mid-infrared Fiber Revenue Share (%), by Types 2025 & 2033
- Figure 6: North America Chalcogenide Mid-infrared Fiber Revenue (million), by Country 2025 & 2033
- Figure 7: North America Chalcogenide Mid-infrared Fiber Revenue Share (%), by Country 2025 & 2033
- Figure 8: South America Chalcogenide Mid-infrared Fiber Revenue (million), by Application 2025 & 2033
- Figure 9: South America Chalcogenide Mid-infrared Fiber Revenue Share (%), by Application 2025 & 2033
- Figure 10: South America Chalcogenide Mid-infrared Fiber Revenue (million), by Types 2025 & 2033
- Figure 11: South America Chalcogenide Mid-infrared Fiber Revenue Share (%), by Types 2025 & 2033
- Figure 12: South America Chalcogenide Mid-infrared Fiber Revenue (million), by Country 2025 & 2033
- Figure 13: South America Chalcogenide Mid-infrared Fiber Revenue Share (%), by Country 2025 & 2033
- Figure 14: Europe Chalcogenide Mid-infrared Fiber Revenue (million), by Application 2025 & 2033
- Figure 15: Europe Chalcogenide Mid-infrared Fiber Revenue Share (%), by Application 2025 & 2033
- Figure 16: Europe Chalcogenide Mid-infrared Fiber Revenue (million), by Types 2025 & 2033
- Figure 17: Europe Chalcogenide Mid-infrared Fiber Revenue Share (%), by Types 2025 & 2033
- Figure 18: Europe Chalcogenide Mid-infrared Fiber Revenue (million), by Country 2025 & 2033
- Figure 19: Europe Chalcogenide Mid-infrared Fiber Revenue Share (%), by Country 2025 & 2033
- Figure 20: Middle East & Africa Chalcogenide Mid-infrared Fiber Revenue (million), by Application 2025 & 2033
- Figure 21: Middle East & Africa Chalcogenide Mid-infrared Fiber Revenue Share (%), by Application 2025 & 2033
- Figure 22: Middle East & Africa Chalcogenide Mid-infrared Fiber Revenue (million), by Types 2025 & 2033
- Figure 23: Middle East & Africa Chalcogenide Mid-infrared Fiber Revenue Share (%), by Types 2025 & 2033
- Figure 24: Middle East & Africa Chalcogenide Mid-infrared Fiber Revenue (million), by Country 2025 & 2033
- Figure 25: Middle East & Africa Chalcogenide Mid-infrared Fiber Revenue Share (%), by Country 2025 & 2033
- Figure 26: Asia Pacific Chalcogenide Mid-infrared Fiber Revenue (million), by Application 2025 & 2033
- Figure 27: Asia Pacific Chalcogenide Mid-infrared Fiber Revenue Share (%), by Application 2025 & 2033
- Figure 28: Asia Pacific Chalcogenide Mid-infrared Fiber Revenue (million), by Types 2025 & 2033
- Figure 29: Asia Pacific Chalcogenide Mid-infrared Fiber Revenue Share (%), by Types 2025 & 2033
- Figure 30: Asia Pacific Chalcogenide Mid-infrared Fiber Revenue (million), by Country 2025 & 2033
- Figure 31: Asia Pacific Chalcogenide Mid-infrared Fiber Revenue Share (%), by Country 2025 & 2033
List of Tables
- Table 1: Global Chalcogenide Mid-infrared Fiber Revenue million Forecast, by Application 2020 & 2033
- Table 2: Global Chalcogenide Mid-infrared Fiber Revenue million Forecast, by Types 2020 & 2033
- Table 3: Global Chalcogenide Mid-infrared Fiber Revenue million Forecast, by Region 2020 & 2033
- Table 4: Global Chalcogenide Mid-infrared Fiber Revenue million Forecast, by Application 2020 & 2033
- Table 5: Global Chalcogenide Mid-infrared Fiber Revenue million Forecast, by Types 2020 & 2033
- Table 6: Global Chalcogenide Mid-infrared Fiber Revenue million Forecast, by Country 2020 & 2033
- Table 7: United States Chalcogenide Mid-infrared Fiber Revenue (million) Forecast, by Application 2020 & 2033
- Table 8: Canada Chalcogenide Mid-infrared Fiber Revenue (million) Forecast, by Application 2020 & 2033
- Table 9: Mexico Chalcogenide Mid-infrared Fiber Revenue (million) Forecast, by Application 2020 & 2033
- Table 10: Global Chalcogenide Mid-infrared Fiber Revenue million Forecast, by Application 2020 & 2033
- Table 11: Global Chalcogenide Mid-infrared Fiber Revenue million Forecast, by Types 2020 & 2033
- Table 12: Global Chalcogenide Mid-infrared Fiber Revenue million Forecast, by Country 2020 & 2033
- Table 13: Brazil Chalcogenide Mid-infrared Fiber Revenue (million) Forecast, by Application 2020 & 2033
- Table 14: Argentina Chalcogenide Mid-infrared Fiber Revenue (million) Forecast, by Application 2020 & 2033
- Table 15: Rest of South America Chalcogenide Mid-infrared Fiber Revenue (million) Forecast, by Application 2020 & 2033
- Table 16: Global Chalcogenide Mid-infrared Fiber Revenue million Forecast, by Application 2020 & 2033
- Table 17: Global Chalcogenide Mid-infrared Fiber Revenue million Forecast, by Types 2020 & 2033
- Table 18: Global Chalcogenide Mid-infrared Fiber Revenue million Forecast, by Country 2020 & 2033
- Table 19: United Kingdom Chalcogenide Mid-infrared Fiber Revenue (million) Forecast, by Application 2020 & 2033
- Table 20: Germany Chalcogenide Mid-infrared Fiber Revenue (million) Forecast, by Application 2020 & 2033
- Table 21: France Chalcogenide Mid-infrared Fiber Revenue (million) Forecast, by Application 2020 & 2033
- Table 22: Italy Chalcogenide Mid-infrared Fiber Revenue (million) Forecast, by Application 2020 & 2033
- Table 23: Spain Chalcogenide Mid-infrared Fiber Revenue (million) Forecast, by Application 2020 & 2033
- Table 24: Russia Chalcogenide Mid-infrared Fiber Revenue (million) Forecast, by Application 2020 & 2033
- Table 25: Benelux Chalcogenide Mid-infrared Fiber Revenue (million) Forecast, by Application 2020 & 2033
- Table 26: Nordics Chalcogenide Mid-infrared Fiber Revenue (million) Forecast, by Application 2020 & 2033
- Table 27: Rest of Europe Chalcogenide Mid-infrared Fiber Revenue (million) Forecast, by Application 2020 & 2033
- Table 28: Global Chalcogenide Mid-infrared Fiber Revenue million Forecast, by Application 2020 & 2033
- Table 29: Global Chalcogenide Mid-infrared Fiber Revenue million Forecast, by Types 2020 & 2033
- Table 30: Global Chalcogenide Mid-infrared Fiber Revenue million Forecast, by Country 2020 & 2033
- Table 31: Turkey Chalcogenide Mid-infrared Fiber Revenue (million) Forecast, by Application 2020 & 2033
- Table 32: Israel Chalcogenide Mid-infrared Fiber Revenue (million) Forecast, by Application 2020 & 2033
- Table 33: GCC Chalcogenide Mid-infrared Fiber Revenue (million) Forecast, by Application 2020 & 2033
- Table 34: North Africa Chalcogenide Mid-infrared Fiber Revenue (million) Forecast, by Application 2020 & 2033
- Table 35: South Africa Chalcogenide Mid-infrared Fiber Revenue (million) Forecast, by Application 2020 & 2033
- Table 36: Rest of Middle East & Africa Chalcogenide Mid-infrared Fiber Revenue (million) Forecast, by Application 2020 & 2033
- Table 37: Global Chalcogenide Mid-infrared Fiber Revenue million Forecast, by Application 2020 & 2033
- Table 38: Global Chalcogenide Mid-infrared Fiber Revenue million Forecast, by Types 2020 & 2033
- Table 39: Global Chalcogenide Mid-infrared Fiber Revenue million Forecast, by Country 2020 & 2033
- Table 40: China Chalcogenide Mid-infrared Fiber Revenue (million) Forecast, by Application 2020 & 2033
- Table 41: India Chalcogenide Mid-infrared Fiber Revenue (million) Forecast, by Application 2020 & 2033
- Table 42: Japan Chalcogenide Mid-infrared Fiber Revenue (million) Forecast, by Application 2020 & 2033
- Table 43: South Korea Chalcogenide Mid-infrared Fiber Revenue (million) Forecast, by Application 2020 & 2033
- Table 44: ASEAN Chalcogenide Mid-infrared Fiber Revenue (million) Forecast, by Application 2020 & 2033
- Table 45: Oceania Chalcogenide Mid-infrared Fiber Revenue (million) Forecast, by Application 2020 & 2033
- Table 46: Rest of Asia Pacific Chalcogenide Mid-infrared Fiber Revenue (million) Forecast, by Application 2020 & 2033
Frequently Asked Questions
1. What is the projected Compound Annual Growth Rate (CAGR) of the Chalcogenide Mid-infrared Fiber?
The projected CAGR is approximately XX%.
2. Which companies are prominent players in the Chalcogenide Mid-infrared Fiber?
Key companies in the market include Irflex, art photonics, SelenOptics.
3. What are the main segments of the Chalcogenide Mid-infrared Fiber?
The market segments include Application, Types.
4. Can you provide details about the market size?
The market size is estimated to be USD XXX million as of 2022.
5. What are some drivers contributing to market growth?
N/A
6. What are the notable trends driving market growth?
N/A
7. Are there any restraints impacting market growth?
N/A
8. Can you provide examples of recent developments in the market?
N/A
9. What pricing options are available for accessing the report?
Pricing options include single-user, multi-user, and enterprise licenses priced at USD 2900.00, USD 4350.00, and USD 5800.00 respectively.
10. Is the market size provided in terms of value or volume?
The market size is provided in terms of value, measured in million.
11. Are there any specific market keywords associated with the report?
Yes, the market keyword associated with the report is "Chalcogenide Mid-infrared Fiber," which aids in identifying and referencing the specific market segment covered.
12. How do I determine which pricing option suits my needs best?
The pricing options vary based on user requirements and access needs. Individual users may opt for single-user licenses, while businesses requiring broader access may choose multi-user or enterprise licenses for cost-effective access to the report.
13. Are there any additional resources or data provided in the Chalcogenide Mid-infrared Fiber report?
While the report offers comprehensive insights, it's advisable to review the specific contents or supplementary materials provided to ascertain if additional resources or data are available.
14. How can I stay updated on further developments or reports in the Chalcogenide Mid-infrared Fiber?
To stay informed about further developments, trends, and reports in the Chalcogenide Mid-infrared Fiber, consider subscribing to industry newsletters, following relevant companies and organizations, or regularly checking reputable industry news sources and publications.
Methodology
Step 1 - Identification of Relevant Samples Size from Population Database


Step 2 - Approaches for Defining Global Market Size (Value, Volume* & Price*)

Note*: In applicable scenarios
Step 3 - Data Sources
Primary Research
- Web Analytics
- Survey Reports
- Research Institute
- Latest Research Reports
- Opinion Leaders
Secondary Research
- Annual Reports
- White Paper
- Latest Press Release
- Industry Association
- Paid Database
- Investor Presentations

Step 4 - Data Triangulation
Involves using different sources of information in order to increase the validity of a study
These sources are likely to be stakeholders in a program - participants, other researchers, program staff, other community members, and so on.
Then we put all data in single framework & apply various statistical tools to find out the dynamic on the market.
During the analysis stage, feedback from the stakeholder groups would be compared to determine areas of agreement as well as areas of divergence