

Key Insights
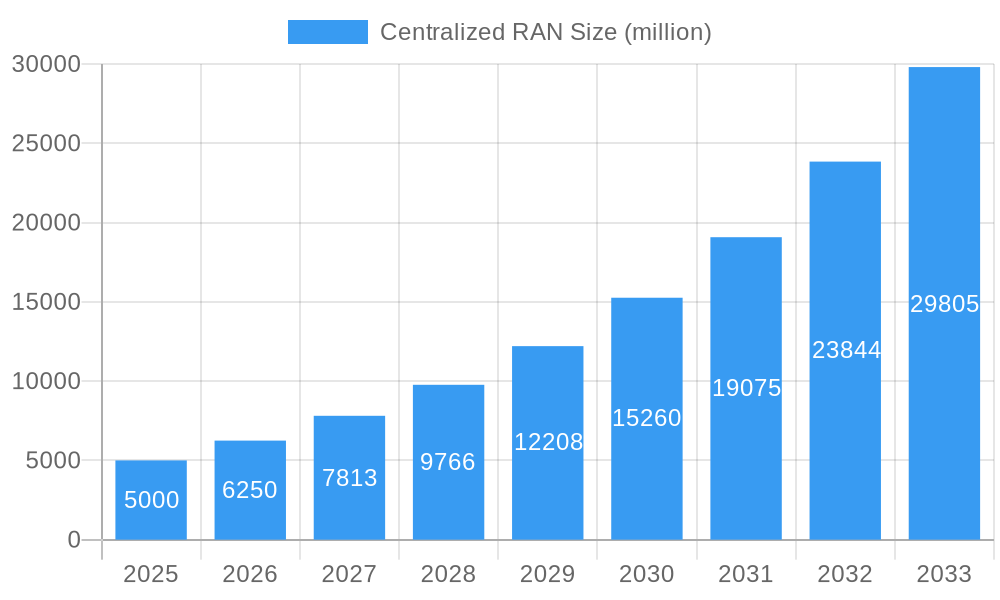
The Centralized Radio Access Network (C-RAN) market is experiencing robust growth, driven by the increasing demand for high-bandwidth, low-latency 5G and future 6G networks. The shift towards cloud-native architectures and the need for efficient network management are key catalysts. This allows for centralized processing of radio signals, leading to improved network efficiency, reduced operational costs, and enhanced flexibility in deploying and managing network resources. Major players like Ericsson, Nokia, Cisco, and Huawei are heavily investing in C-RAN technologies, fueling competition and innovation within the sector. The market is segmented by components (hardware, software, services), deployment type (cloud, on-premise), and application (enterprise, residential). We project a market size of approximately $5 billion in 2025, exhibiting a Compound Annual Growth Rate (CAGR) of 25% over the forecast period (2025-2033). This significant growth is attributed to the widespread adoption of 5G, the increasing demand for edge computing capabilities, and the ongoing digital transformation across various industries.
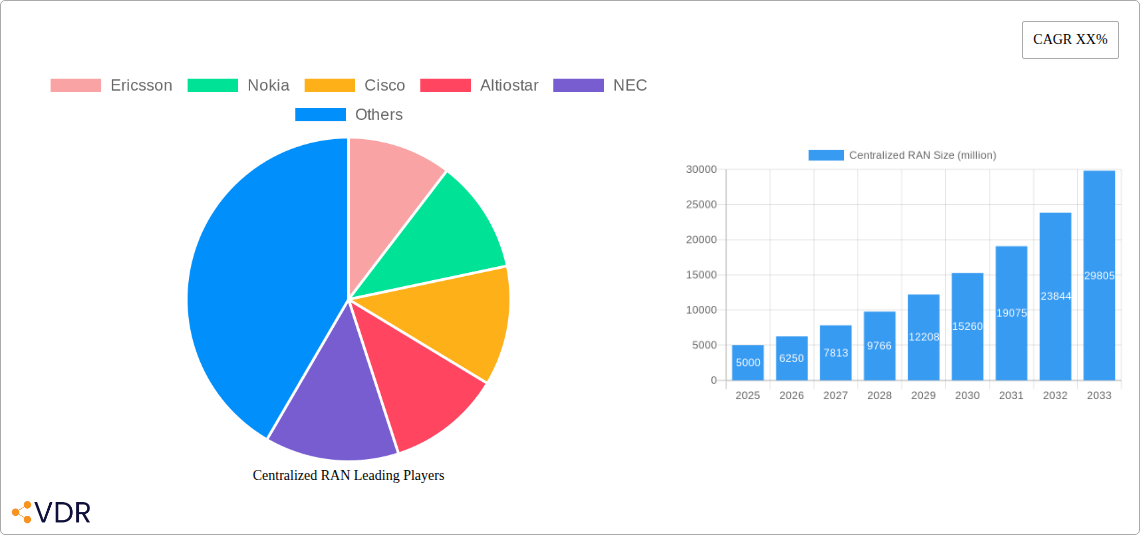
Centralized RAN Market Size (In Billion)
While the market presents significant opportunities, challenges remain. High initial investment costs for infrastructure upgrades and the complexity of integrating C-RAN with existing network infrastructure can hinder adoption, particularly for smaller service providers. Furthermore, security concerns related to centralized data processing and the need for skilled professionals to manage these complex systems pose potential obstacles. However, ongoing technological advancements, coupled with decreasing hardware costs and improved network security measures, are expected to mitigate these challenges over time. The market is poised for substantial expansion, particularly in regions with robust 5G deployments and a strong focus on digital infrastructure development. The continued development of Open RAN standards, promoting interoperability and competition, will further contribute to market growth in the coming years.
Centralized RAN Company Market Share
Centralized RAN Market Report: 2019-2033
This comprehensive report provides an in-depth analysis of the Centralized Radio Access Network (C-RAN) market, encompassing market dynamics, growth trends, regional dominance, product landscapes, key players, and future outlooks. The report covers the period 2019-2033, with a focus on the forecast period 2025-2033 and a base year of 2025. This detailed analysis is crucial for industry professionals, investors, and strategists seeking to understand and capitalize on the evolving C-RAN landscape. The parent market is the broader RAN market, while the child market is specifically focused on the centralized architecture within RAN.
Centralized RAN Market Dynamics & Structure
The global Centralized RAN market, valued at $XX million in 2024, is experiencing significant growth driven by the increasing demand for high-bandwidth, low-latency connectivity. Market concentration is moderate, with key players like Ericsson, Nokia, and Huawei holding substantial shares. Technological innovation, particularly in virtualization and cloud technologies, is a major driver. Regulatory frameworks, including spectrum allocation policies, influence market development. Competitive substitutes include traditional Distributed RAN (D-RAN) architectures, although C-RAN's advantages in scalability and efficiency are gradually increasing its appeal. End-user demographics are shifting towards increased adoption by mobile network operators (MNOs) and enterprises. M&A activity has been moderate, with approximately XX deals recorded between 2019 and 2024, primarily focusing on technology acquisitions and strategic partnerships.
- Market Concentration: Moderately concentrated, with top 3 players holding approximately XX% market share in 2024.
- Technological Innovation: Virtualization, cloud computing, and software-defined networking (SDN) are key drivers.
- Regulatory Frameworks: Spectrum allocation and licensing policies influence deployment strategies.
- Competitive Substitutes: Distributed RAN (D-RAN) architectures pose a competitive threat.
- M&A Activity: Approximately XX M&A deals between 2019 and 2024, mainly focused on technology integration.
- Innovation Barriers: High initial investment costs and complex integration challenges.
Centralized RAN Growth Trends & Insights
The C-RAN market is projected to witness robust growth during the forecast period (2025-2033), with a Compound Annual Growth Rate (CAGR) of XX%. This growth is fueled by several factors, including the increasing adoption of 5G networks, the rising demand for enhanced mobile broadband (eMBB) services, and the proliferation of Internet of Things (IoT) devices. Market penetration is expected to increase significantly from XX% in 2024 to XX% by 2033. Technological disruptions, such as the introduction of Open RAN architectures, are further shaping the market landscape. Consumer behavior shifts towards increased data consumption and demand for seamless connectivity are driving the adoption of C-RAN solutions.
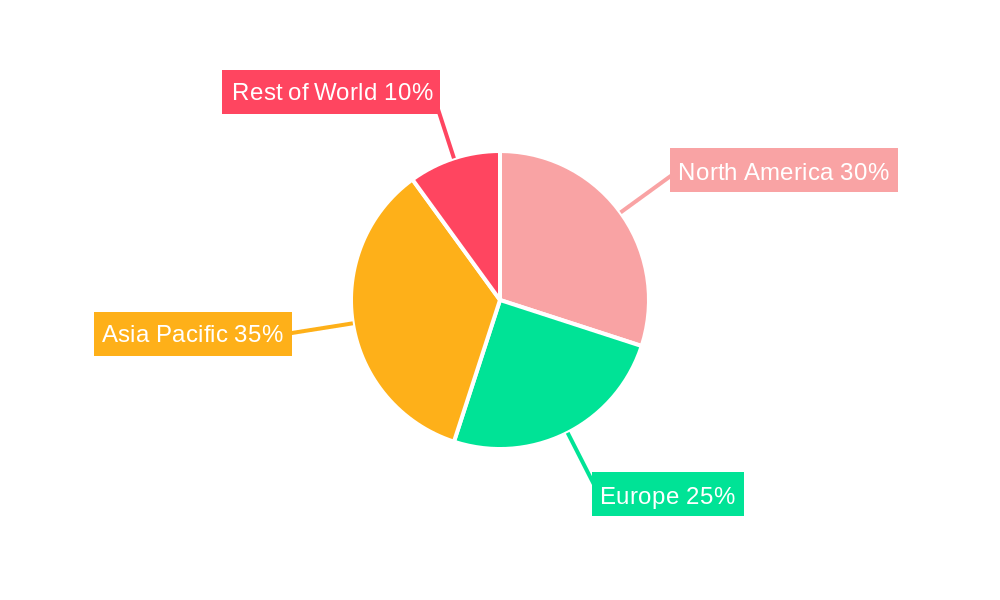
Dominant Regions, Countries, or Segments in Centralized RAN
North America and Asia-Pacific are expected to be the dominant regions in the C-RAN market during the forecast period. North America's strong technological infrastructure and early adoption of 5G contribute to its market leadership. Asia-Pacific, fueled by rapid economic growth and expanding telecommunications infrastructure in countries like China and India, displays significant growth potential. The enterprise segment is emerging as a significant growth driver, with increasing demand for private 5G networks.
- North America: Strong technological infrastructure, early 5G adoption, and high investment in telecom infrastructure.
- Asia-Pacific: Rapid economic growth, burgeoning telecommunications infrastructure, and a large potential user base.
- Enterprise Segment: Growing demand for private 5G networks for enhanced operational efficiency and data security.
- Market Share: North America holds approximately XX% of the market share in 2025, while Asia-Pacific is projected to reach XX% by 2033.
Centralized RAN Product Landscape
C-RAN products encompass various hardware and software components, including baseband units (BBUs), remote radio heads (RRHs), and virtualized network functions (VNFs). Innovations focus on improving energy efficiency, reducing latency, and enhancing scalability. Key performance metrics include spectral efficiency, latency, and network capacity. Unique selling propositions often involve advanced features like AI-driven network optimization and seamless integration with cloud platforms. Technological advancements are driven by the adoption of open interfaces and software-defined architectures.
Key Drivers, Barriers & Challenges in Centralized RAN
Key Drivers:
- The increasing demand for 5G and beyond 5G networks.
- Growing need for high-bandwidth and low-latency connectivity.
- Increased adoption of virtualization and cloud technologies.
- Government initiatives promoting digital transformation.
Challenges & Restraints:
- High initial investment costs for infrastructure deployment.
- Complexity in integrating various components and technologies.
- Security concerns related to centralized network architecture.
- Potential interoperability issues among different vendor equipment.
- Supply chain disruptions impacting component availability and pricing. This resulted in a XX% increase in component costs in 2022.
Emerging Opportunities in Centralized RAN
- Private 5G networks: Expanding adoption in enterprise sectors such as manufacturing, healthcare, and transportation.
- Edge computing integration: Enabling real-time processing and low-latency applications.
- Open RAN architecture: Fostering greater competition and vendor diversity.
- AI-driven network optimization: Enhancing network performance, efficiency, and security.
Growth Accelerators in the Centralized RAN Industry
Technological breakthroughs in virtualization, AI, and cloud computing will be significant growth drivers. Strategic partnerships between network equipment vendors and cloud service providers will accelerate market expansion. Government initiatives supporting 5G deployment and digital infrastructure development will also play a crucial role.
Notable Milestones in Centralized RAN Sector
- 2020, Q3: Ericsson launches its Cloud RAN solution.
- 2021, Q1: Nokia announces its end-to-end Cloud RAN portfolio.
- 2022, Q4: Significant increase in C-RAN deployments across several major telecom operators.
- 2023, Q2: First commercial deployment of an Open RAN-based C-RAN network.
In-Depth Centralized RAN Market Outlook
The C-RAN market is poised for continued strong growth throughout the forecast period, driven by factors such as the widespread adoption of 5G, the increasing demand for high-bandwidth applications, and the ongoing technological advancements in virtualization and cloud computing. The market will see increased competition and innovation, presenting significant opportunities for players that can effectively navigate the technological complexities and adapt to the evolving market demands. Strategic partnerships and investments in research and development will be key to success in this dynamic market.
Centralized RAN Segmentation
-
1. Application
- 1.1. Industrial Manufacturing
- 1.2. Smart Grid
- 1.3. Medical Care
- 1.4. Visual Display
- 1.5. Other
-
2. Types
- 2.1. Fixed Radio Access Network
- 2.2. Mobile Radio Access Network
Centralized RAN Segmentation By Geography
-
1. North America
- 1.1. United States
- 1.2. Canada
- 1.3. Mexico
-
2. South America
- 2.1. Brazil
- 2.2. Argentina
- 2.3. Rest of South America
-
3. Europe
- 3.1. United Kingdom
- 3.2. Germany
- 3.3. France
- 3.4. Italy
- 3.5. Spain
- 3.6. Russia
- 3.7. Benelux
- 3.8. Nordics
- 3.9. Rest of Europe
-
4. Middle East & Africa
- 4.1. Turkey
- 4.2. Israel
- 4.3. GCC
- 4.4. North Africa
- 4.5. South Africa
- 4.6. Rest of Middle East & Africa
-
5. Asia Pacific
- 5.1. China
- 5.2. India
- 5.3. Japan
- 5.4. South Korea
- 5.5. ASEAN
- 5.6. Oceania
- 5.7. Rest of Asia Pacific
Centralized RAN Regional Market Share
Geographic Coverage of Centralized RAN
Centralized RAN REPORT HIGHLIGHTS
| Aspects | Details |
|---|---|
| Study Period | 2020-2034 |
| Base Year | 2025 |
| Estimated Year | 2026 |
| Forecast Period | 2026-2034 |
| Historical Period | 2020-2025 |
| Growth Rate | CAGR of 28.1% from 2020-2034 |
| Segmentation |
|
Table of Contents
- 1. Introduction
- 1.1. Research Scope
- 1.2. Market Segmentation
- 1.3. Research Objective
- 1.4. Definitions and Assumptions
- 2. Executive Summary
- 2.1. Market Snapshot
- 3. Market Dynamics
- 3.1. Market Drivers
- 3.2. Market Restrains
- 3.3. Market Trends
- 3.4. Market Opportunities
- 4. Market Factor Analysis
- 4.1. Porters Five Forces
- 4.1.1. Bargaining Power of Suppliers
- 4.1.2. Bargaining Power of Buyers
- 4.1.3. Threat of New Entrants
- 4.1.4. Threat of Substitutes
- 4.1.5. Competitive Rivalry
- 4.2. PESTEL analysis
- 4.3. BCG Analysis
- 4.3.1. Stars (High Growth, High Market Share)
- 4.3.2. Cash Cows (Low Growth, High Market Share)
- 4.3.3. Question Mark (High Growth, Low Market Share)
- 4.3.4. Dogs (Low Growth, Low Market Share)
- 4.4. Ansoff Matrix Analysis
- 4.5. Supply Chain Analysis
- 4.6. Regulatory Landscape
- 4.7. Current Market Potential and Opportunity Assessment (TAM–SAM–SOM Framework)
- 4.8. VDR Analyst Note
- 4.1. Porters Five Forces
- 5. Market Analysis, Insights and Forecast 2021-2033
- 5.1. Market Analysis, Insights and Forecast - by Application
- 5.1.1. Industrial Manufacturing
- 5.1.2. Smart Grid
- 5.1.3. Medical Care
- 5.1.4. Visual Display
- 5.1.5. Other
- 5.2. Market Analysis, Insights and Forecast - by Types
- 5.2.1. Fixed Radio Access Network
- 5.2.2. Mobile Radio Access Network
- 5.3. Market Analysis, Insights and Forecast - by Region
- 5.3.1. North America
- 5.3.2. South America
- 5.3.3. Europe
- 5.3.4. Middle East & Africa
- 5.3.5. Asia Pacific
- 5.1. Market Analysis, Insights and Forecast - by Application
- 6. Global Centralized RAN Analysis, Insights and Forecast, 2021-2033
- 6.1. Market Analysis, Insights and Forecast - by Application
- 6.1.1. Industrial Manufacturing
- 6.1.2. Smart Grid
- 6.1.3. Medical Care
- 6.1.4. Visual Display
- 6.1.5. Other
- 6.2. Market Analysis, Insights and Forecast - by Types
- 6.2.1. Fixed Radio Access Network
- 6.2.2. Mobile Radio Access Network
- 6.1. Market Analysis, Insights and Forecast - by Application
- 7. North America Centralized RAN Analysis, Insights and Forecast, 2021-2033
- 7.1. Market Analysis, Insights and Forecast - by Application
- 7.1.1. Industrial Manufacturing
- 7.1.2. Smart Grid
- 7.1.3. Medical Care
- 7.1.4. Visual Display
- 7.1.5. Other
- 7.2. Market Analysis, Insights and Forecast - by Types
- 7.2.1. Fixed Radio Access Network
- 7.2.2. Mobile Radio Access Network
- 7.1. Market Analysis, Insights and Forecast - by Application
- 8. South America Centralized RAN Analysis, Insights and Forecast, 2021-2033
- 8.1. Market Analysis, Insights and Forecast - by Application
- 8.1.1. Industrial Manufacturing
- 8.1.2. Smart Grid
- 8.1.3. Medical Care
- 8.1.4. Visual Display
- 8.1.5. Other
- 8.2. Market Analysis, Insights and Forecast - by Types
- 8.2.1. Fixed Radio Access Network
- 8.2.2. Mobile Radio Access Network
- 8.1. Market Analysis, Insights and Forecast - by Application
- 9. Europe Centralized RAN Analysis, Insights and Forecast, 2021-2033
- 9.1. Market Analysis, Insights and Forecast - by Application
- 9.1.1. Industrial Manufacturing
- 9.1.2. Smart Grid
- 9.1.3. Medical Care
- 9.1.4. Visual Display
- 9.1.5. Other
- 9.2. Market Analysis, Insights and Forecast - by Types
- 9.2.1. Fixed Radio Access Network
- 9.2.2. Mobile Radio Access Network
- 9.1. Market Analysis, Insights and Forecast - by Application
- 10. Middle East & Africa Centralized RAN Analysis, Insights and Forecast, 2021-2033
- 10.1. Market Analysis, Insights and Forecast - by Application
- 10.1.1. Industrial Manufacturing
- 10.1.2. Smart Grid
- 10.1.3. Medical Care
- 10.1.4. Visual Display
- 10.1.5. Other
- 10.2. Market Analysis, Insights and Forecast - by Types
- 10.2.1. Fixed Radio Access Network
- 10.2.2. Mobile Radio Access Network
- 10.1. Market Analysis, Insights and Forecast - by Application
- 11. Asia Pacific Centralized RAN Analysis, Insights and Forecast, 2021-2033
- 11.1. Market Analysis, Insights and Forecast - by Application
- 11.1.1. Industrial Manufacturing
- 11.1.2. Smart Grid
- 11.1.3. Medical Care
- 11.1.4. Visual Display
- 11.1.5. Other
- 11.2. Market Analysis, Insights and Forecast - by Types
- 11.2.1. Fixed Radio Access Network
- 11.2.2. Mobile Radio Access Network
- 11.1. Market Analysis, Insights and Forecast - by Application
- 12. Competitive Analysis
- 12.1. Company Profiles
- 12.1.1 Ericsson
- 12.1.1.1. Company Overview
- 12.1.1.2. Products
- 12.1.1.3. Company Financials
- 12.1.1.4. SWOT Analysis
- 12.1.2 Nokia
- 12.1.2.1. Company Overview
- 12.1.2.2. Products
- 12.1.2.3. Company Financials
- 12.1.2.4. SWOT Analysis
- 12.1.3 Cisco
- 12.1.3.1. Company Overview
- 12.1.3.2. Products
- 12.1.3.3. Company Financials
- 12.1.3.4. SWOT Analysis
- 12.1.4 Altiostar
- 12.1.4.1. Company Overview
- 12.1.4.2. Products
- 12.1.4.3. Company Financials
- 12.1.4.4. SWOT Analysis
- 12.1.5 NEC
- 12.1.5.1. Company Overview
- 12.1.5.2. Products
- 12.1.5.3. Company Financials
- 12.1.5.4. SWOT Analysis
- 12.1.6 Intel
- 12.1.6.1. Company Overview
- 12.1.6.2. Products
- 12.1.6.3. Company Financials
- 12.1.6.4. SWOT Analysis
- 12.1.7 HRMavenir System
- 12.1.7.1. Company Overview
- 12.1.7.2. Products
- 12.1.7.3. Company Financials
- 12.1.7.4. SWOT Analysis
- 12.1.8 Huawei
- 12.1.8.1. Company Overview
- 12.1.8.2. Products
- 12.1.8.3. Company Financials
- 12.1.8.4. SWOT Analysis
- 12.1.9 GIGABYTE
- 12.1.9.1. Company Overview
- 12.1.9.2. Products
- 12.1.9.3. Company Financials
- 12.1.9.4. SWOT Analysis
- 12.1.10 ZTE
- 12.1.10.1. Company Overview
- 12.1.10.2. Products
- 12.1.10.3. Company Financials
- 12.1.10.4. SWOT Analysis
- 12.1.1 Ericsson
- 12.2. Market Entropy
- 12.2.1 Company's Key Areas Served
- 12.2.2 Recent Developments
- 12.3. Company Market Share Analysis 2025
- 12.3.1 Top 5 Companies Market Share Analysis
- 12.3.2 Top 3 Companies Market Share Analysis
- 12.4. List of Potential Customers
- 13. Research Methodology
List of Figures
- Figure 1: Global Centralized RAN Revenue Breakdown (undefined, %) by Region 2025 & 2033
- Figure 2: North America Centralized RAN Revenue (undefined), by Application 2025 & 2033
- Figure 3: North America Centralized RAN Revenue Share (%), by Application 2025 & 2033
- Figure 4: North America Centralized RAN Revenue (undefined), by Types 2025 & 2033
- Figure 5: North America Centralized RAN Revenue Share (%), by Types 2025 & 2033
- Figure 6: North America Centralized RAN Revenue (undefined), by Country 2025 & 2033
- Figure 7: North America Centralized RAN Revenue Share (%), by Country 2025 & 2033
- Figure 8: South America Centralized RAN Revenue (undefined), by Application 2025 & 2033
- Figure 9: South America Centralized RAN Revenue Share (%), by Application 2025 & 2033
- Figure 10: South America Centralized RAN Revenue (undefined), by Types 2025 & 2033
- Figure 11: South America Centralized RAN Revenue Share (%), by Types 2025 & 2033
- Figure 12: South America Centralized RAN Revenue (undefined), by Country 2025 & 2033
- Figure 13: South America Centralized RAN Revenue Share (%), by Country 2025 & 2033
- Figure 14: Europe Centralized RAN Revenue (undefined), by Application 2025 & 2033
- Figure 15: Europe Centralized RAN Revenue Share (%), by Application 2025 & 2033
- Figure 16: Europe Centralized RAN Revenue (undefined), by Types 2025 & 2033
- Figure 17: Europe Centralized RAN Revenue Share (%), by Types 2025 & 2033
- Figure 18: Europe Centralized RAN Revenue (undefined), by Country 2025 & 2033
- Figure 19: Europe Centralized RAN Revenue Share (%), by Country 2025 & 2033
- Figure 20: Middle East & Africa Centralized RAN Revenue (undefined), by Application 2025 & 2033
- Figure 21: Middle East & Africa Centralized RAN Revenue Share (%), by Application 2025 & 2033
- Figure 22: Middle East & Africa Centralized RAN Revenue (undefined), by Types 2025 & 2033
- Figure 23: Middle East & Africa Centralized RAN Revenue Share (%), by Types 2025 & 2033
- Figure 24: Middle East & Africa Centralized RAN Revenue (undefined), by Country 2025 & 2033
- Figure 25: Middle East & Africa Centralized RAN Revenue Share (%), by Country 2025 & 2033
- Figure 26: Asia Pacific Centralized RAN Revenue (undefined), by Application 2025 & 2033
- Figure 27: Asia Pacific Centralized RAN Revenue Share (%), by Application 2025 & 2033
- Figure 28: Asia Pacific Centralized RAN Revenue (undefined), by Types 2025 & 2033
- Figure 29: Asia Pacific Centralized RAN Revenue Share (%), by Types 2025 & 2033
- Figure 30: Asia Pacific Centralized RAN Revenue (undefined), by Country 2025 & 2033
- Figure 31: Asia Pacific Centralized RAN Revenue Share (%), by Country 2025 & 2033
List of Tables
- Table 1: Global Centralized RAN Revenue undefined Forecast, by Application 2020 & 2033
- Table 2: Global Centralized RAN Revenue undefined Forecast, by Types 2020 & 2033
- Table 3: Global Centralized RAN Revenue undefined Forecast, by Region 2020 & 2033
- Table 4: Global Centralized RAN Revenue undefined Forecast, by Application 2020 & 2033
- Table 5: Global Centralized RAN Revenue undefined Forecast, by Types 2020 & 2033
- Table 6: Global Centralized RAN Revenue undefined Forecast, by Country 2020 & 2033
- Table 7: United States Centralized RAN Revenue (undefined) Forecast, by Application 2020 & 2033
- Table 8: Canada Centralized RAN Revenue (undefined) Forecast, by Application 2020 & 2033
- Table 9: Mexico Centralized RAN Revenue (undefined) Forecast, by Application 2020 & 2033
- Table 10: Global Centralized RAN Revenue undefined Forecast, by Application 2020 & 2033
- Table 11: Global Centralized RAN Revenue undefined Forecast, by Types 2020 & 2033
- Table 12: Global Centralized RAN Revenue undefined Forecast, by Country 2020 & 2033
- Table 13: Brazil Centralized RAN Revenue (undefined) Forecast, by Application 2020 & 2033
- Table 14: Argentina Centralized RAN Revenue (undefined) Forecast, by Application 2020 & 2033
- Table 15: Rest of South America Centralized RAN Revenue (undefined) Forecast, by Application 2020 & 2033
- Table 16: Global Centralized RAN Revenue undefined Forecast, by Application 2020 & 2033
- Table 17: Global Centralized RAN Revenue undefined Forecast, by Types 2020 & 2033
- Table 18: Global Centralized RAN Revenue undefined Forecast, by Country 2020 & 2033
- Table 19: United Kingdom Centralized RAN Revenue (undefined) Forecast, by Application 2020 & 2033
- Table 20: Germany Centralized RAN Revenue (undefined) Forecast, by Application 2020 & 2033
- Table 21: France Centralized RAN Revenue (undefined) Forecast, by Application 2020 & 2033
- Table 22: Italy Centralized RAN Revenue (undefined) Forecast, by Application 2020 & 2033
- Table 23: Spain Centralized RAN Revenue (undefined) Forecast, by Application 2020 & 2033
- Table 24: Russia Centralized RAN Revenue (undefined) Forecast, by Application 2020 & 2033
- Table 25: Benelux Centralized RAN Revenue (undefined) Forecast, by Application 2020 & 2033
- Table 26: Nordics Centralized RAN Revenue (undefined) Forecast, by Application 2020 & 2033
- Table 27: Rest of Europe Centralized RAN Revenue (undefined) Forecast, by Application 2020 & 2033
- Table 28: Global Centralized RAN Revenue undefined Forecast, by Application 2020 & 2033
- Table 29: Global Centralized RAN Revenue undefined Forecast, by Types 2020 & 2033
- Table 30: Global Centralized RAN Revenue undefined Forecast, by Country 2020 & 2033
- Table 31: Turkey Centralized RAN Revenue (undefined) Forecast, by Application 2020 & 2033
- Table 32: Israel Centralized RAN Revenue (undefined) Forecast, by Application 2020 & 2033
- Table 33: GCC Centralized RAN Revenue (undefined) Forecast, by Application 2020 & 2033
- Table 34: North Africa Centralized RAN Revenue (undefined) Forecast, by Application 2020 & 2033
- Table 35: South Africa Centralized RAN Revenue (undefined) Forecast, by Application 2020 & 2033
- Table 36: Rest of Middle East & Africa Centralized RAN Revenue (undefined) Forecast, by Application 2020 & 2033
- Table 37: Global Centralized RAN Revenue undefined Forecast, by Application 2020 & 2033
- Table 38: Global Centralized RAN Revenue undefined Forecast, by Types 2020 & 2033
- Table 39: Global Centralized RAN Revenue undefined Forecast, by Country 2020 & 2033
- Table 40: China Centralized RAN Revenue (undefined) Forecast, by Application 2020 & 2033
- Table 41: India Centralized RAN Revenue (undefined) Forecast, by Application 2020 & 2033
- Table 42: Japan Centralized RAN Revenue (undefined) Forecast, by Application 2020 & 2033
- Table 43: South Korea Centralized RAN Revenue (undefined) Forecast, by Application 2020 & 2033
- Table 44: ASEAN Centralized RAN Revenue (undefined) Forecast, by Application 2020 & 2033
- Table 45: Oceania Centralized RAN Revenue (undefined) Forecast, by Application 2020 & 2033
- Table 46: Rest of Asia Pacific Centralized RAN Revenue (undefined) Forecast, by Application 2020 & 2033
Frequently Asked Questions
1. What is the projected Compound Annual Growth Rate (CAGR) of the Centralized RAN?
The projected CAGR is approximately 28.1%.
2. Which companies are prominent players in the Centralized RAN?
Key companies in the market include Ericsson, Nokia, Cisco, Altiostar, NEC, Intel, HRMavenir System, Huawei, GIGABYTE, ZTE.
3. What are the main segments of the Centralized RAN?
The market segments include Application, Types.
4. Can you provide details about the market size?
The market size is estimated to be USD XXX N/A as of 2022.
5. What are some drivers contributing to market growth?
N/A
6. What are the notable trends driving market growth?
N/A
7. Are there any restraints impacting market growth?
N/A
8. Can you provide examples of recent developments in the market?
N/A
9. What pricing options are available for accessing the report?
Pricing options include single-user, multi-user, and enterprise licenses priced at USD 3350.00, USD 5025.00, and USD 6700.00 respectively.
10. Is the market size provided in terms of value or volume?
The market size is provided in terms of value, measured in N/A.
11. Are there any specific market keywords associated with the report?
Yes, the market keyword associated with the report is "Centralized RAN," which aids in identifying and referencing the specific market segment covered.
12. How do I determine which pricing option suits my needs best?
The pricing options vary based on user requirements and access needs. Individual users may opt for single-user licenses, while businesses requiring broader access may choose multi-user or enterprise licenses for cost-effective access to the report.
13. Are there any additional resources or data provided in the Centralized RAN report?
While the report offers comprehensive insights, it's advisable to review the specific contents or supplementary materials provided to ascertain if additional resources or data are available.
14. How can I stay updated on further developments or reports in the Centralized RAN?
To stay informed about further developments, trends, and reports in the Centralized RAN, consider subscribing to industry newsletters, following relevant companies and organizations, or regularly checking reputable industry news sources and publications.
Methodology
Step 1 - Identification of Relevant Samples Size from Population Database


Step 2 - Approaches for Defining Global Market Size (Value, Volume* & Price*)

Note*: In applicable scenarios
Step 3 - Data Sources
Primary Research
- Web Analytics
- Survey Reports
- Research Institute
- Latest Research Reports
- Opinion Leaders
Secondary Research
- Annual Reports
- White Paper
- Latest Press Release
- Industry Association
- Paid Database
- Investor Presentations

Step 4 - Data Triangulation
Involves using different sources of information in order to increase the validity of a study
These sources are likely to be stakeholders in a program - participants, other researchers, program staff, other community members, and so on.
Then we put all data in single framework & apply various statistical tools to find out the dynamic on the market.
During the analysis stage, feedback from the stakeholder groups would be compared to determine areas of agreement as well as areas of divergence